

ajphoto/iStock via Getty Images
Why I Turned Bullish On Residential REITs
While the image above may seem like a joke, the reality is that housing affordability has reached a point where it is basically no longer possible for the average person (or family for that matter) to afford a typical house on their own. Most people accept the fact that they will never be able to own a large house with all the bells and whistles but many in the Millennial and Gen Z crowd are beginning to accept that homeownership may never be possible. It would be one thing if this was truly just a “this is how I feel” type of statement but unfortunately the data where I live reinforces this conclusion.
According to the US Census Bureau, the median annual household income in Spokane, Washington (for clarification, I live in a small suburb on the outskirts) is $64,079 (this was last updated in 2021). The median value of owner-occupied housing over the same time frame is $273,200. If we consider the purchase price of $273,200 with a $10k down payment (which is arguably light and would likely require a special program to qualify) and then estimates closing, property tax, insurance, etc. we would arrive at a monthly payment of $1630.13 for principal, interest, property tax and insurance. This equates to a payment to income of 30.5% or roughly 1/3 of the median household’s income.
Other than assuming that a household has $10,000 to put as a down payment there are two major details that I left out. When I ran these calculations, I used an interest rate of 3.25% on a 30-year mortgage because this represented one of the lowest rates that we’ve seen (and it was readily available less than two years ago). A little more recently than this example, my wife and I were able to finalize the purchase of our home before the month of May 2022 which allowed us to lock in an interest rate of 3.875% for 30 years.
Fast-forward to today, and the current interest rate at the time I am writing this article is 6.484% on a 30-year note. Even when we look at ARM options the rate is about 100 basis points less coming in at 5.487%. Using the same information, the monthly payment associated with a $273,200 house would result in a payment of $2,145.50 on a 30-year note at 6.484%. Using the median household income of $64,079 this would represent a payment to income of 40.2%!
The second piece of information I left out is that the median sale price is much higher than the information provided by the US Census Bureau. The image below comes from Redfin (RDFN) and suggests that even today prospective homebuyers would need to consider the reality that the median sale price is closer to $365,000 (nearly $100,000 more than the Census Bureau supplied). Once again, using the same math above we would arrive at a monthly payment of $2,763.02 which results in an unsustainable payment to income of 51.7%!
RDFN – Spokane Housing Trends.jpg (Redfin)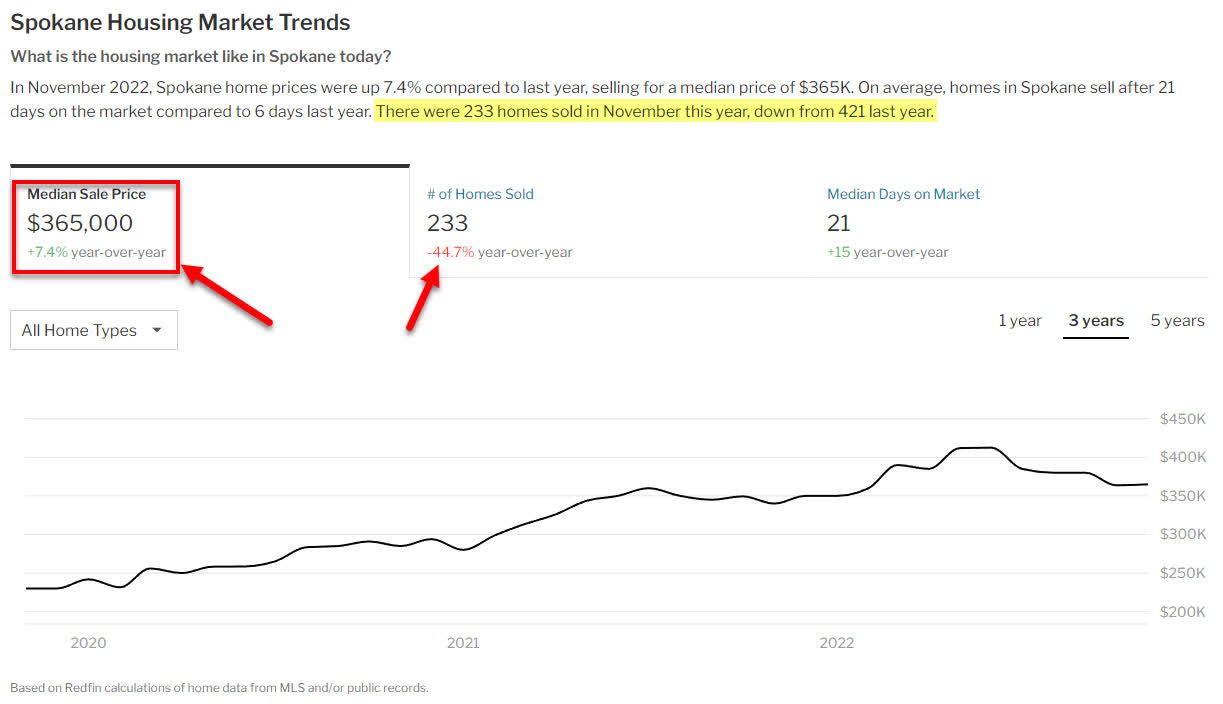
We are beginning to see the median sale price trend downwards, however the fall of housing prices goes hand in hand with the reduction in the number of houses sold (a total of 233 homes sold in November 2022 compared to 421 homes in November 2021 which represents a -44.7% year-over-year trend for the month of November).
Recency Bias
Recency bias is a newer term to me, but I think it offers the best explanation of the problem that is building in the housing market. Recency bias refers to the challenges the average person faces when it comes to the bias they have when remembering recent events. In these situations, people can place more emphasis on one fact while ignoring or downplaying other facts and it may depend on how well they understand the subject or preferences they have on certain topics. Simply put – recency bias occurs when you get stuck on certain facts, figures, etc. even when there is other information that could have a significant impact on the outcome.
Let’s consider a non-financial example first. Let’s say you are working on a car and when you put it into drive it doesn’t move. You check everything and realize that the parking brake is on and once it’s released you can start moving forward without the resistance. Now, let’s say you put it into drive and it won’t move and you become fixated on the idea that it has to be the parking brake (after all, the last time you had this issue it was in fact the parking brake). After releasing the brake and checking everything the car still won’t move freely but it ends up that the real reason why the car won’t move is that when you went to start the vehicle it never started and the ignition is stuck in the on position.
A relevant example of recency bias can be seen in how consumers view rising interest rates compared to falling housing prices. A consumer who previously had a mortgage with an exceptionally low rate of 3.25% would scoff at selling their home and taking out a new mortgage at 6.50%. At the same time, they would likely dismiss the idea of selling their home at a discounted price (the discount being that sale prices are currently coming down) even if it means they could buy a new home at an equivalent discount.
Recency bias – Rates – Borrowers who say “6.5% on a 30-year mortgage is ridiculous” might find it exceptionally difficult to look at the sale price of $225K at 6.5% and compare it to the payments that would be associated with a home at $275K and 3.875% and realize that the discount on the house is helping compensate for the higher interest rates.
Recency bias – Sale Price – Borrowers who are focused on maximizing the sale price of their home might find it difficult to let go of the idea that their house has to be worth a certain amount in order for them to want to sell the home. I expect to see quite a bit of this over the next few years because the average person has been conditioned to see their house as an always appreciating asset and they get attached to it where they begin to assign a sentimental value that doesn’t factor into how others value it.
These examples of Recency Bias in the real estate sector are likely to make the slowdown worsen because interest rates being low was part of what fueled the rise of both housing sales and house prices over the last two years. The sudden departure from record-low interest rates will require housing prices to come down considerably in order to make housing affordable again for the average median income. The Federal Reserve has made it clear that the most optimistic scenario for interest rates is that they will begin to plateau at the end of 2023 and possibly begin to drop in 2024. I am personally not so optimistic and believe that interest rates may begin to plateau but that we will be stuck with a scenario where we have higher rates for longer.
How Does This Play Out?
Because of the challenges in the housing market, I expect that this means that apartment rentals are likely to remain more attractive to consumers. With interest rates and the cost of housing, it is going to be a long process of give and take to where interest rates and the price of housing can find an equilibrium. New housing is one factor that can help stimulate things because home builders don’t experience recency bias when selling brand-new homes (builders have no sentimental attachment as long as they are making enough to pay the bills).
It will be interesting to see how fast builders drop the price of new housing before it can be seen as affordable. My biggest concern with this is that builders may choose to limit the number of housing starts to avoid the kind of drop-off in demand that would lead to the decimation of the margins, and in a worse-case scenario, possible bankruptcy. Even if builders continue to new housing starts at current levels It is likely that this will be a multi-year process before a meaningful number of houses can make a dent in the demand. For this reason, it would appear that apartment complexes will remain the more affordable option for the next several years.
The image below presents the average rent in the Spokane area and demonstrates that renting makes more sense for the average consumer.
Average Rent In Spokane (Rent.com)
The fact that a two-bedroom apartment is the same payment as housing was when priced at $273K but with an interest rate of 3.25% says a lot about the current environment we are in and reinforces just how challenging the environment will be over the next few years.
Before I review six Residential REITs that are attractive, I wanted to note that the above analysis is true of the market I live in and may not apply to other markets across the United States. As a whole, I believe that recency bias is going to be prevalent in most markets because the current 30-year note exceeds the rate that loans have been originated at for well over a decade which means that we have very few mortgagees who have an interest rate anywhere close to the current rate. Even though there may be significant differences between markets I believe that the following statements are true of most markets in the United States.
- Interest rate increases have made renting significantly more affordable than buying a house.
- We are at the infancy stage of recency bias for interest rates and housing prices which will contribute significantly to binding up the housing market.
- Recency bias for housing prices means that only those with means will choose to sell their home to upgrade to a larger house (for example, accommodating a growing family). I believe homeowners in this situation are more likely to make improvements to their existing homes instead.
- Recency bias for interest rates impacts housing more than any other sector (cars, RVs, boats, etc.) and this will continue to be the case until housing prices moderate.
- Car prices are dropping rapidly so recency bias has been minimal with cars because the consumer is still making a comparable monthly payment because the price of the car has decreased.
- Lastly, houses purchased at record highs over the last few years have the potential to be underwater (the borrower owes more than the house is worth). Still, one key difference with 2008 is that the mortgage is more likely to be affordable because they financed at such a low-interest rate. Even if housing prices drop I predict that upside-down borrowers are much more likely to keep their homes as long as they are able to afford the payment.
Attractive Residential REITs
Residential REITs focused on apartments have never been a primary component of my investment strategy but the dramatic shift in interest rates and challenges associated with housing affordability have changed how I feel about the sector. The other key development is that many of these REITs have seen their stock prices crash from a 52-week high all the way to a 52-week low. It is also worth pointing out that these are not speculative companies with many of the ones included in this article considered to be the highest-quality Residential REITs available.
- Essex Property Trust (NYSE:ESS)
- Avalon Bay (AVB)
- Camden Property Trust (CPT)
- Equity Residential (EQR)
- Mid-America Apartment Communities (MAA)
- UDR (UDR)
Consecutive Dividend Increases
Because most of what I focus on is related to dividend investing, I am always curious to know what a company’s track record of consecutive dividend increases is. Consistency matters especially when heading into a recession and is pretty compelling when the track record shows the company has been able to continue delivering during difficult times. In addition to the number of years of increases, I also like to review the 10-year dividend growth rate (CAGR) to get an idea of how the dividend growth has performed over time. The 10-year dividend growth rate can give more context to companies that maybe weren’t able to maintain their dividend growth streak but still offer a compelling history of dividend growth.
ESS – 29 Years – 10-Year Rate 7.18%
AVB – 0 Years – 10-Year Rate 5.07%
CPT – 1 Year – 10-Year Rate 5.32%
EQR – 1 Year – 10-Year Rate 3.46%
MAA – 13 Years – 10-Year Rate 5.88%
UDR – 13 Years – 10-Year Rate 5.62%
It doesn’t take much convincing from the information above to say that ESS looks like one of the best buys going into a recession with a consecutive dividend growth history that is more than double the length of any competitor and has also maintained a 10-year growth rate that is at least 150 basis points more than its next closest competitors.
Dividend Yield
A company that grows its dividend over time often outperforms its competition because this often indicates superior management, which demonstrates an above-average competence when it comes to asset allocation (which subsequently drives more value). All of these REITs have fairly comparable yields but once again ESS stands out because over the last five years it went from being the lowest yield option to now currently being the second highest yield.
Dividend Yield Comparison (SeekingAlpha)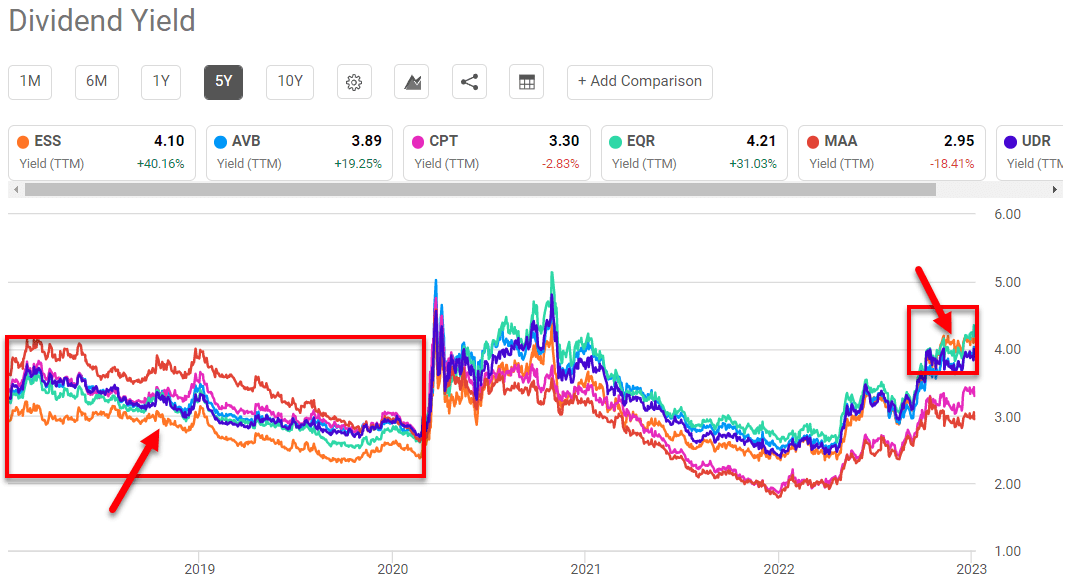
Initially (in the first red box above), ESS clearly outperforms the others when it comes to growth which is why it would make sense that the dividend yield is lower (because we would expect a higher share price). Interestingly enough, the dividend yield with the recent price drop puts it at the second highest compared to its competitors. This further emphasizes that ESS is more attractively priced and offers a deeper value than its competitors. Only EQR has a higher yield but they also offer the least compelling dividend growth history so it makes sense that the yield for EQR would need to be higher to compensate for its lackluster history.
Payout Ratio
The payout ratio reflects how much of a REITs earnings are paid out as the dividend. One important consideration when looking at REITs is to consider Funds From Operations (‘FFO’) instead of Earnings Per Share (EPS) which will make the payout ratio look unsustainable. Investopedia explains that:
“FFO compensates for cost-accounting methods that may inaccurately communicate a REIT’s true performance. GAAP accounting requires that all REITs depreciate their investment properties over time using one of the standard depreciation methods. However, many investment properties actually increase in value over time, making depreciation inaccurate in describing the value of a REIT. Depreciation and amortization must be added back to net income to reconcile this issue.”
The payout ratio is calculated by dividing the dividends paid annually by the amount of annual FFO earned in total.
ESS – $8.80 / $14.44 = 60.9%
AVB – $6.36 / $9.79 = 65%
CPT – $3.76 / $6.60 = 57%
EQR – $2.50 / $3.53 = 70.8%
MAA – $5.60 / $8.40 = 60.7%
UDR – $1.52 / $2.32 = 65.5%
All six REITs have very reasonable payout ratios that show they are capable of paying their current dividend payout. The payout ratios are similar enough that I wouldn’t use them as a metric to determine if one stock is better than the other.
Price to Funds From Operations (P/FFO)
The P/FFO ratio is the last metric to use to show how discounted shares are relative to where the stock price has been in the past. P/FFO by itself is not a sufficient metric to use by itself because it can tell you that a company is undervalued relative to historical figures but not why it is undervalued (a company in turmoil, poor earnings results, etc.). For this reason, it is important to take the P/FFO with a grain of salt but if operations are running smoothly then it is a great tool to help indicate that a stock is undervalued relative to where it has been historically.
The second thing to consider with P/FFO is that you must look at a long enough time period to get a true idea of where the stock P/FFO has been on average (this means it’s a good idea to use a 5- or 10-year average since this will minimize any short-term increases/decreases due to one-time events such as the drop in stock price when COVID lockdowns took place). FastGraphs is my tool of choice when I am wanting to do this because it achieves multiple objectives at once.
ESS – Average 10-year P/FFO of 21x VS current P/FFO of 14.8x.
ESS – 2023-1 – FastGraphs (FastGraphs)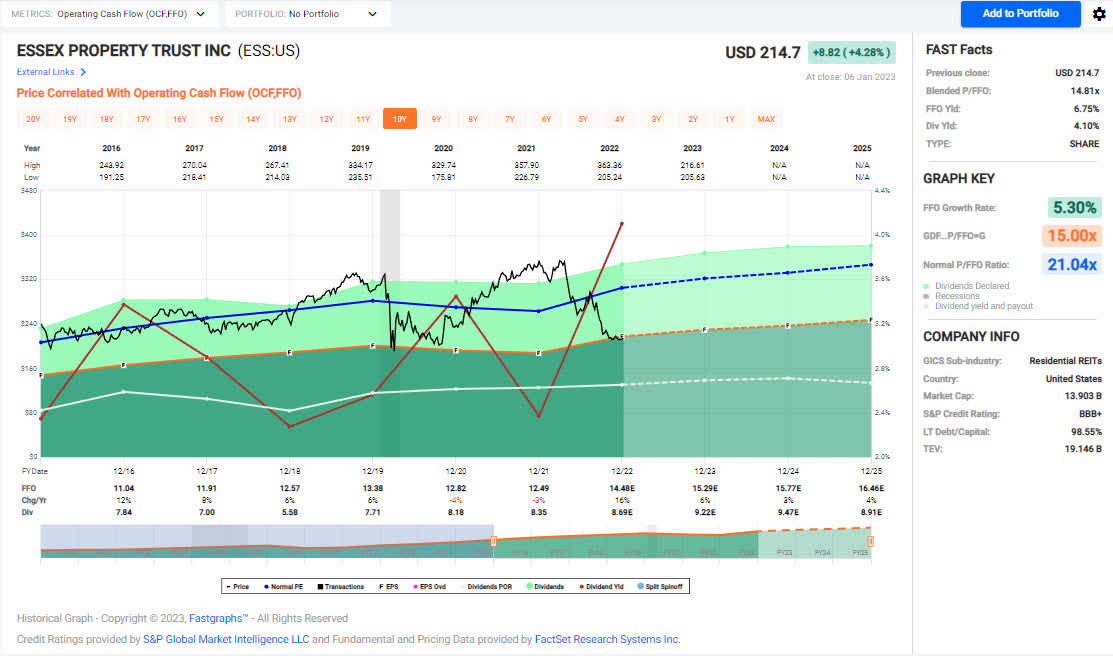
AVB – Average 10-year P/FFO of 21.24x VS current P/FFO of 16.7x.
AVB – 2023-1 – FastGraphs (FastGraphs)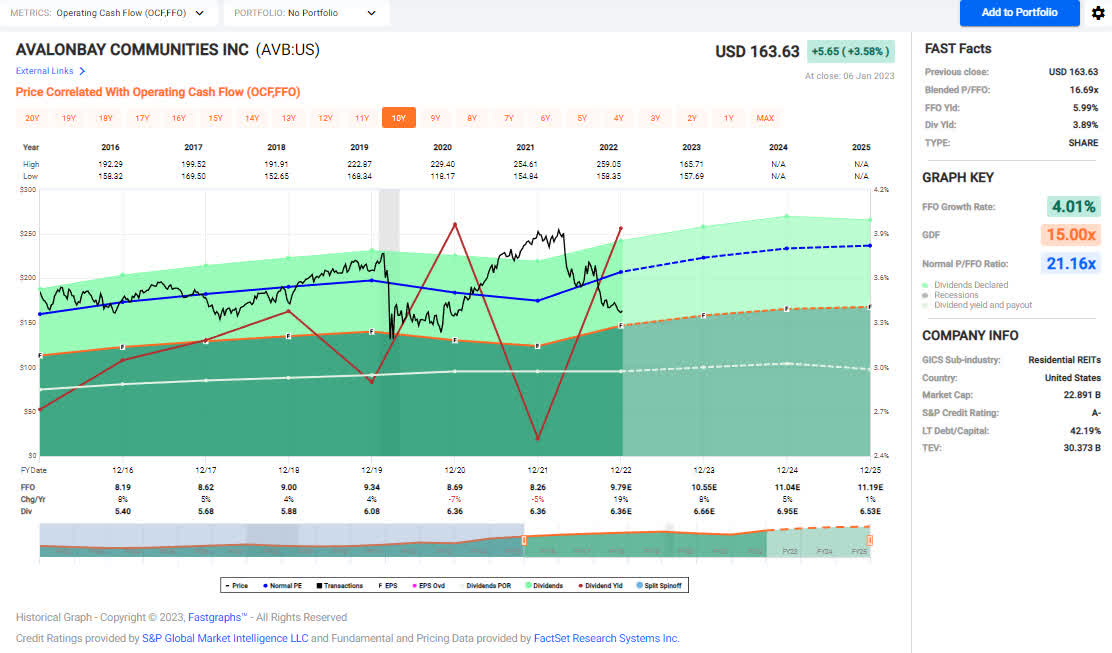
CPT – Average 10-year P/FFO of 19.2x VS current P/FFO of 17.3x.
CPT – 2023-1 – FastGraphs (FastGraphs)
EQR – Average 10-year P/FFO of 21.1x VS current P/FFO of 16.8x.
EQR – 2023-1 – FastGraphs (FastGraphs)
MAA – Average 10-year P/FFO of 18.2x VS current P/FFO of 18.8x.
MAA – 2023-1 – FastGraphs (FastGraphs)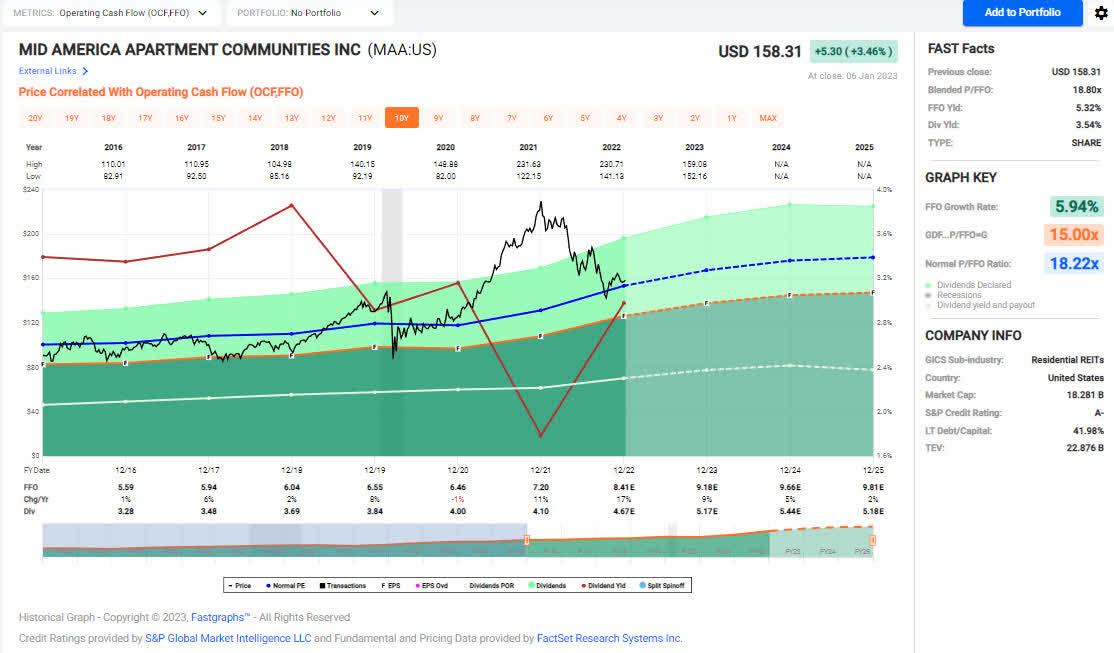
UDR – Average 10-year P/FFO of 21x VS current P/FFO of 16.6x.
UDR – 2023-1 – FastGraphs (FastGraphs)
Conclusion
I personally believe that ESS is the clear winner of this comparison. It offers the longest track record of dividend increases, the most consistent average increase over the last 10 years, a very comfortable payout ratio, and the most discounted P/FFO ratio of the six companies we looked at. While the other REITs mentioned may have been at the top of a certain category, ESS demonstrates that it consistently ranked high in every category and therefore offers the best value at this point in time.
Be the first to comment