

sasirin pamai/iStock via Getty Images
Strategy and portfolio
The First Trust Multi-Asset Diversified Income Index Fund (NASDAQ:MDIV), is a high yield fund paying monthly distributions with a 12-month distribution yield of 5.49% and a net expense ratio of 0.61%. It was launched on 08/13/2012 and tracks the Nasdaq US Multi-Asset Diversified Income Index, a rule-based strategy mixing different categories of securities.
As described on FirstTrust website, the fund invests in five asset segments: equity securities, REITs, preferred securities, MLPs and high yield corporate bonds. The underlying index allocates 20% of its weight to each segment. The high yield corporate bond segment is represented by the First Trust Tactical High Yield ETF (HYLS).
Equity securities (excluding REITs) must meet conditions of capitalization and liquidity, and show:
- dividends paid each of the last three years,
- positive total earnings in the trailing 12 months,
- a dividend payout ratio no greater than 80%,
- one year realized volatility below the Nasdaq Benchmark Index one-year realized volatility plus 15%.
Then, 50 stocks passing the rules are selected and weighted by yield.
REITs must meet the same criteria, with a higher threshold for the payout ratio: 150%. The index selects 25 REITs and weights them by yield.
Preferred stocks must pass a similar screen, without the positive earnings conditions and with lower requirements in capitalization and liquidity. Eligible preferred stocks are ranked based on yield and volatility. The top 25 are included in the index and weighted by yield.
The screen for MLPs also drops the positive earnings conditions and follows the same principles with specific rules. It results in another group of 25 constituents.
Fund composition (source: FirstTrust)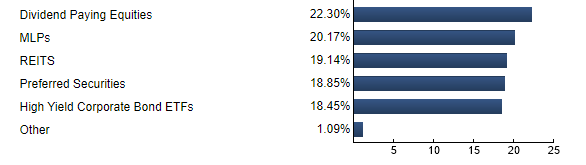
Excluding the high yield bond ETF, the heaviest securities issuers in MDIV are AGNC Investment Corp (AGNC) with 2.66% and Citigroup Inc (C) with 2.41%. These weights combine several lines of securities for each company. As a consequence, risk exposure related to any individual company is limited.
Performance
Since inception in 2012, MDIV with dividends reinvested has lagged the S&P 500 by 9.7 percentage points in annualized return (see next table). Moreover, maximum drawdown and volatility point to a higher risk.
|
Total Return |
Annual Return |
Drawdown |
Sharpe ratio |
Volatility |
|
|
MDIV |
44.59% |
3.83% |
-46.59% |
0.32 |
14.24% |
|
SPY |
247.94% |
13.58% |
-32.05% |
0.97 |
13.65% |
The next chart plots the equity value of $100 invested in MDIV and SPY since MDIV inception (dividends reinvested).
MDIV vs. SPY (chart: author; data: portfolio123)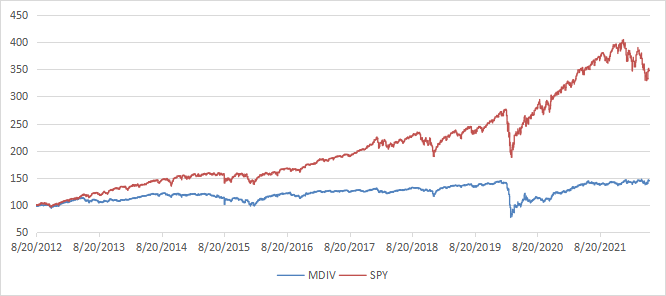
The annualized return reinvesting all distributions, without paying any tax on them, is below the distribution rate. This is a red flag pointing to capital decay. It is confirmed by MDIV share price history: it has lost about 17% since inception.
MDIV share price, without dividends (TradingView on SeekingAlpha)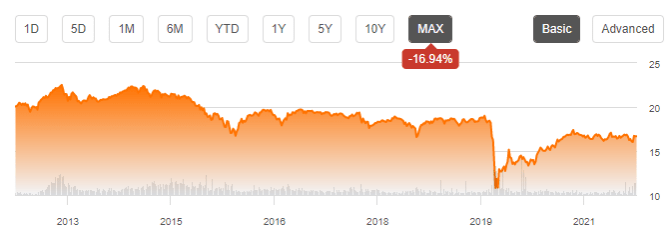
Capital decay also means income stream decay: the yield cannot go up continuously to offset the loss in asset value. The annual sum of distributions went down from $1.18 in 2013 to $0.88 in 2021 (source). This is a loss of income stream of 26% in 8 years. Current inflation is an additional drag.
This issue is not specific to MDIV: securities paying yields above 6% suffer from capital decay, with rare exceptions. The 10-year average annualized return including dividends of all ETFs with a yield superior to 6% is 4.5%, for an average yield of 8.8%. The 10-year average annualized return including dividends of all Russell 1000 stocks with a dividend yield superior to 6% is 5.9%, for an average yield of 8% (data calculated with Portfolio123).
MDIV may be used as an instrument for swing trading or tactical allocation, but I don’t recommend it as a long-term holding in a sustainable retirement plan. This is true for a number of high-yield instruments, not only this one.
How to manage capital decay in high yield securities
Capital and income decay is a structural issue in many closed-end funds, like in most high-yield instruments. However, it is not inexorable if one knows how to trade CEFs instead of using them as buy-and-hold instruments. I designed a 5-factor ranking system statistically related to forward returns across the full CEF universe, and started publishing the 8 best ranked liquid CEFs in Quantitative Risk & Value (QRV) after the March 2020 market meltdown. The list is updated every week. Its average dividend yield varies around 7-8%. It is not a model portfolio: trading the list every week is too costly in spreads and slippage. Its purpose is helping income investors find funds with a good entry point. In the table and chart below I give the hypothetical example of starting a portfolio on 3/25/2020 with my initial “Best 8 Ranked CEFs” list and updating it every 3 months since then, ignoring intermediate updates to limit transaction costs. Returns are calculated with holdings initially in equal weights without rebalancing until the next 3-month update. Dividends are reinvested at the beginning of every 3-month period.
|
Since 3/25/2020 |
Total Return |
Annual Return |
Drawdown |
Sharpe ratio |
Volatility |
|
Best 8 CEFs quarterly |
147.32% |
51.20% |
-13.33% |
2.38 |
16.80% |
|
SPY |
74.10% |
28.81% |
-18.22% |
1.43 |
17.13% |
This simulation is not a real portfolio and not a guarantee of future return (Data calculated with Portfolio123)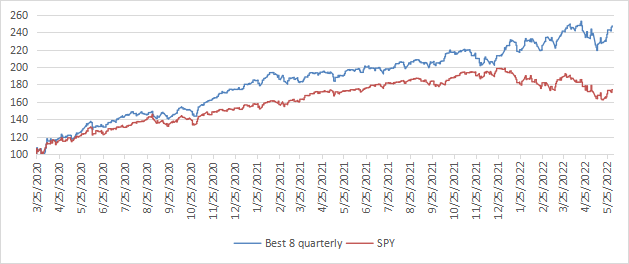
The usual disclaimer says that past performance (real or simulated) is not representative of future return. I go farther: the “Best 8” list has very little chance to perform as well in a future 2-year period as in the past 2 years. The March 2020 meltdown resulted in price dislocation and exceptional opportunities in the CEF universe. The 2022 downturn was also a source of opportunities in energy and infrastructure funds. This is unlikely to be reproducible in the future. However, I think a discount-driven rotational strategy in CEFs has a much better chance to protect both capital and income stream against erosion and inflation than any high-yield passive investment like MDIV. Dates and lists can be checked in QRV post history (trial is free).
Be the first to comment