

Diego Thomazini
Environment, social, and corporate governance (ESG) considerations have quickly become an important metric in investments. The total investments in global sustainable assets grew from $5 billion in 2018 to $2.5 trillion by mid-2022[1].
The materiality of ESG scores on company risk has been studied in various contexts. The relationship between ESG and equity metrics (alpha, downside risk) has been demonstrated to be weak at best,[2] though there is some evidence of correlation between CDS spreads and ESG scores over a dataset of aggregated issuer-year observations[3]. We follow the work of Barth, et. al.[4] and apply the common factor analysis technique used by Fama and French[5] on S&P Global’s ESG scores as we look for correlations between the changes in the CDS spread to changes in other factors. This line of study does not directly point to individual firm-level ESG scores as predictors of firm risk; instead, we use the universe of ESG scores to construct a new risk factor time series that may be able to predict how firms’ CDS spreads will change.
The ENV, SOC and GOV factors
S&P Global ESG scores are updated annually, and each company’s score is published on a different date. [6] We first generate a ranking of the ESG scores as of the last day of each month by assuming the latest available scores for each company. Then we create a hypothetical, equal-weighted, monthly-rebalanced stock portfolio that is long the top tercile of the monthly score rankings and short the bottom tercile of the monthly score rankings. We borrow the nomenclature of Barth, et al. by naming ENV, SOC, and GOV as the hypothetical portfolios created by ranking the environmental, social, and governance scores, respectively.
The ENV, SOC, and GOV factor returns can be interpreted as a market sentiment of ESG scores—and by extension, the broader ESG movement—as proxied by equity returns. For example, the ENV portfolio will exhibit positive returns if the market participants reward companies with high environment scores and sell off companies with low environment score, and vice versa. Note that the ENV, SOC, and GOV factors are, by construction, market neutral.
We generated the hypothetical monthly price of ENV, SOC, and GOV portfolios from September 2013 to August 2022 on a universe of 127 U.S. publicly traded companies[7], assuming a price of 1.0 at September 2013.
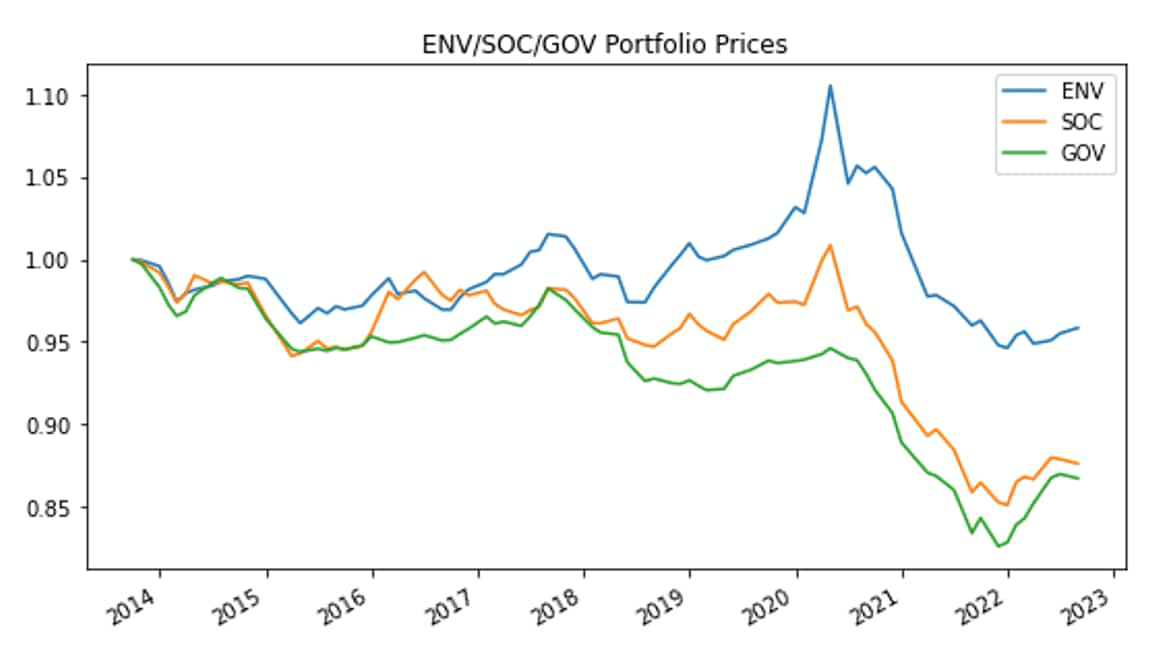
The ENV, SOC, and GOV factors suggest that there was a peak in market sentiment—to the environment scores in particular—in April 2020, after which all factors faced steep downturns. In the plot below, we focus on the ENV time series and decompose it into the top (long) and bottom (short) terciles.
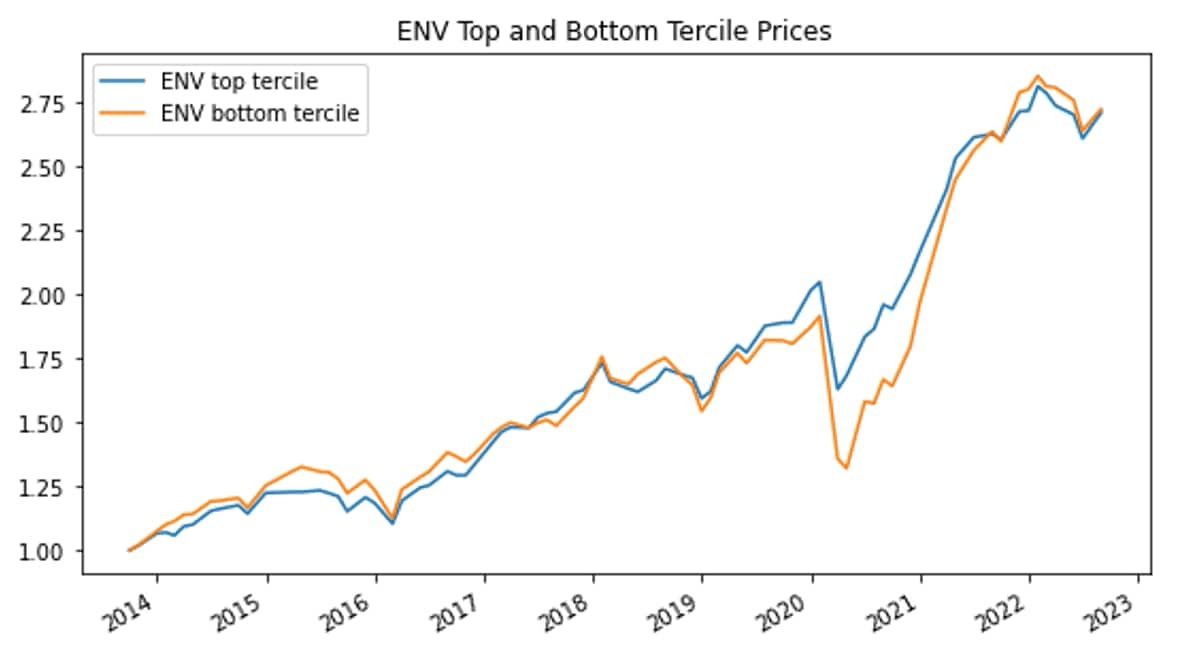
Note how the prices move more or less in tandem until a divergence started to form around mid-2019. The COVID-19 shock caused a much deeper drop in the bottom tercile, but it subsequently outperformed the top tercile and moved back in tandem with it. The underperformance of high environmental-scored companies may be responsible for the peaking and gradual decline of the U.S. sustainable fund inflows in the first quarter of 2021[8].
It is plausible that the COVID-19 shock of February 2020 bears some responsibility for this sudden shift in sentiment[9], but it should be noted that major markets, such as the broader U.S. stock market and the crude oil market, had reversed their initial losses by the end of 2020. The drop in ENV, SOC, and GOV factors have somewhat started to reverse in 2022 but are still well below pre-2020 levels.
Factor analysis of single-name CDS spreads
We proceeded to investigate whether the ENV, SOC, and/or GOV factors had any predictive ability of the change in the single-name CDS spreads. To this end, as a base case, we regressed the change in the single-name CDS spread against the (publicly traded) monthly stock returns, the stock volatility, and the CDS sector curve for the company rating: that is, for a company

,

where,
-


-


-

-


The plot and table below summarize the regression characteristics by fitting the above model via a linear regression.
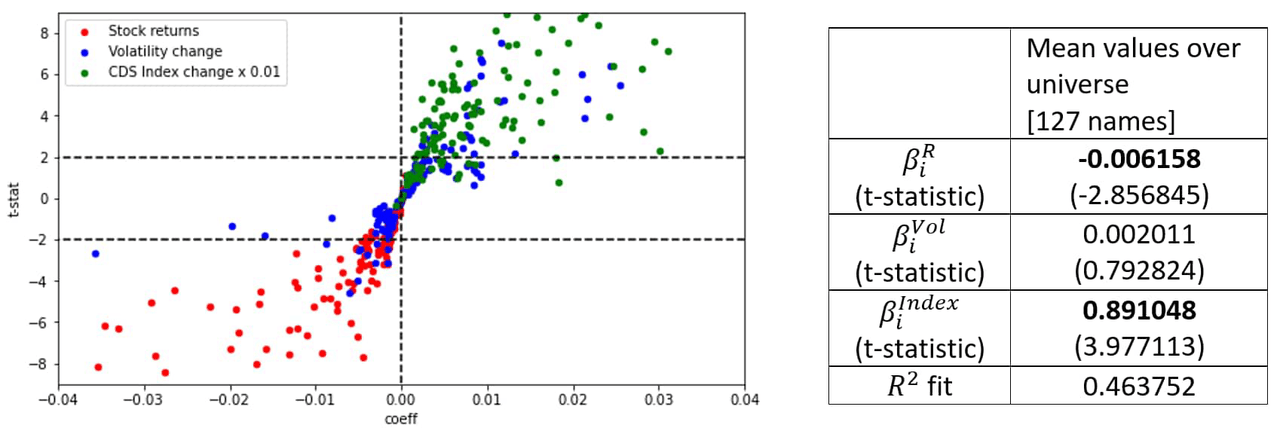
We find that the stock returns and CDS index spread changes are statistically significant factors in predicting the single-name CDS spread changes, and are negatively and positively correlated, respectively. The change in the monthly volatility is not statistically significant.
Next, we added the ENV, SOC, and GOV factors, independently, to the aforementioned base case to see how it changes the regression fit:


Where

,

, and

are the monthly returns for the ENV, SOC, and GOV factors from month

to month t. Below is a plot of the regressed coefficients

,

, and

with their t-statistics.
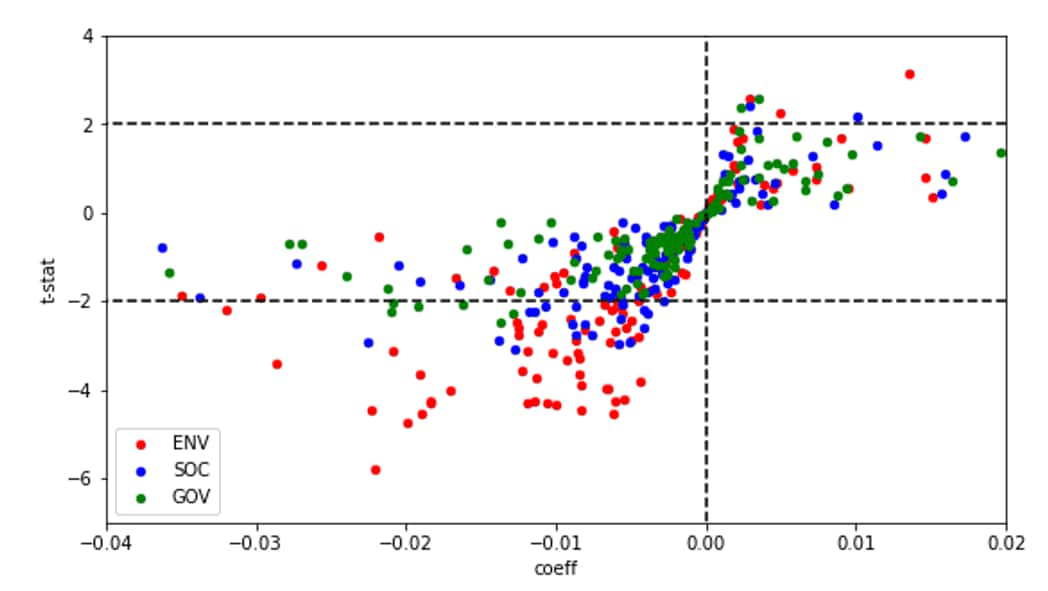
The statistically significant coefficient (absolute value of t-statistic is greater than 2, or about 95% confidence interval) are most prominent for the ENV factor with negative coefficients, and to a lesser extent, the SOC factor. Most of the positive coefficients, as well as the GOV factor, have no statistical significance.
For the ENV factor, we divide the universe of companies into quintiles of

(quintile 1 has the smallest

and quintile 5 has the largest

); each quintile contains approximately 25 names.
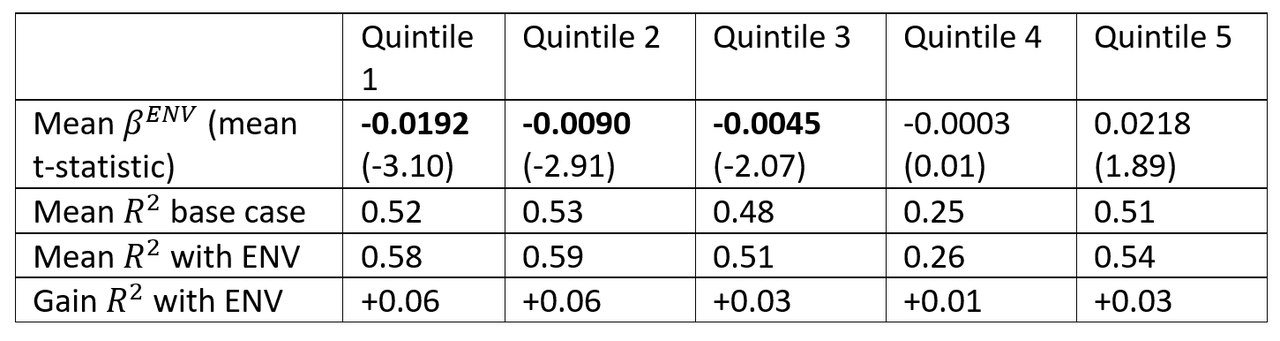
We find that quintiles 1 through 3, which all have negative

, have statistically significant coefficient values and also significantly increase the

fit.
Based on this analysis, we find that the changes to CDS spreads of most names have negative coefficients to the ENV factor and that names that have more negative coefficients to the ENV factor tend to be more statistically significant and materially improve the

fit. An interpretation of these results is that a specific company’s risk decreases during periods of increased market sentiment to the environmental dimension, and vice versa. No similar statistically significant results were found for the SOC or the GOV factors.
The ENV factor as a stress definition of credit risk
It is common for financial risk management teams to consider certain stress scenarios, such as a sudden jump in interest rates, a drop in equity prices, a jump in bond yields, or any combinations of similar scenarios. The ENV factor may be a new risk factor to capture sudden or prolonged changes in the market sentiment in the environmental dimension that manifests as changes in CDS spreads. We continue to investigate the materiality of the ENV factor time series in the context of sectors, ratings, broad market sentiment, the macro environment, and other factors.
Footnotes:
[1] Does ESG really matter—and why? McKinsey Quarterly, August 10, 2022. Does ESG really matter–and why?
[2] Bruno G, Esakia M, Goltz F, Honey, I shrunk the ESG alpha: Risk-adjusting ESG portfolio returns. Scientific Beta Publication, April 2021.
[3] Reznick M, Viehs M. Pricing ESG risk in credit markets. Hermes Credit and Hermes EOS Research paper, Q2 2017. Available online: https://www.hermes-investment.com/uploads/2021/11/3fde0f24c45f95b3b633bd66ecda3805/hermes-credit-esg-paper-april-2017.pdf
[4] Barth F, Hubel B, Scholz H. ESG and corporate credit spreads. SSRN, last updated March 1, 2021.
[5] Fama E, French K. Common risk factors in the returns on stocks and bonds. Journal of Financial Economics, 1993;33(1):3-56.
[6] Starting in 2013, S&P Global publishes annual ESG scores for over 11,300 global firms. https://www.marketplace.spglobal.com/en/datasets/s-p-global-esg-scores-(171)#dataset-overview
[7] The universe was filtered for companies that had liquid CDS contracts (average liquidity score of 3.5 or more).
[8] Stankiewicz A. The number of new sustainable funds hits an all-time record. Morningstar, Oct 28, 2021. The Number of New Sustainable Funds Hits an All-Time Record
[9] See, for example: Murugaboopathy P, Jessop S. Demond for sustainable funds wanes as Ukraine war puts focus on oil and gas. Reuters, March 17, 2022. Demand for sustainable funds wanes as Ukraine war puts focus on oil and gas
Editor’s Note: The summary bullets for this article were chosen by Seeking Alpha editors.
Be the first to comment