

peshkov
Overview
For those that don’t know, equity risk premium is the premium investors expect to receive by holding risk assets, such as stocks, as opposed to risk-free assets, such as Treasury bonds. U.S. Treasuries are considered a risk-free asset because it is highly unlikely the U.S. government will default on its loans. Indeed, the Fed will simply print more money. So, the yield offered by the 10-year bond, for example, is considered risk-free because you are near guaranteed to get your money back plus interest, which as of this writing, is 3%.
When investors place their money in stocks rather than bonds, they expect a higher rate of return for taking on said risk. After all, investors are not guaranteed a positive return in stocks. History has a lot to say about what’s an appropriate equity risk premium (ERP) and clearly reveals how the Fed’s interest rates have a profound influence on market returns.
Using history as our guide, I’ll dive into what I believe are reasonable expectations for the future. Spoiler alert – it looks a lot like the past!
About the Data
A few important items regarding the data I present in this article:
- ERP = S&P 500 earnings yield minus 10 YR real Treasury yield
- Real Treasury yield = nominal yield minus CPI average
- Average annual inflation per year = 3.8%
- Forecasted S&P 500 annual EPS growth = 7% (excluding dividends)
For this exercise, I pulled the S&P 500 Earnings Yield and 10 YR Treasury Yield from January 1962 to May 2022. I also pulled annual CPI data from 1962-2021, which is what I used to calculate the real yield.
Historical Equity Risk Premium
Equity risk premium is important because it helps determine an appropriate multiple (P/E ratio) for the market. As treasury yields increase, the market multiple decreases. This is because the P/E ratio and earnings yield move inversely to each other. As P/E increases, earnings yield decreases and vice versa. For example, a P/E of 20 equates to a 5% earnings yield (1 divided by 20). If the P/E compresses to 15, the earnings yield increases to 6.7% (1 divided by 15). This phenomenon is why Treasury yields have such a profound impact on markets. Markets are in a constant flux to maintain an appropriate ERP based on changing Treasury yields.
Over the past 60 years, the average ERP for the S&P 500 is 4%. The ERP spends very little time at 4%, but that’s the average, nonetheless. In fact, the ERP spent only 26% of the time between 3% and 5% but was <3% 38% (premium valuation) of the time and >5% 37% (undervalued) of the time. In this regard, ERP is not dissimilar to the S&P 500 which historically returns 7% on average, but very rarely returns 7% in any given year.
Equity Risk Premium vs 10YR Treasury (Author’s personal data)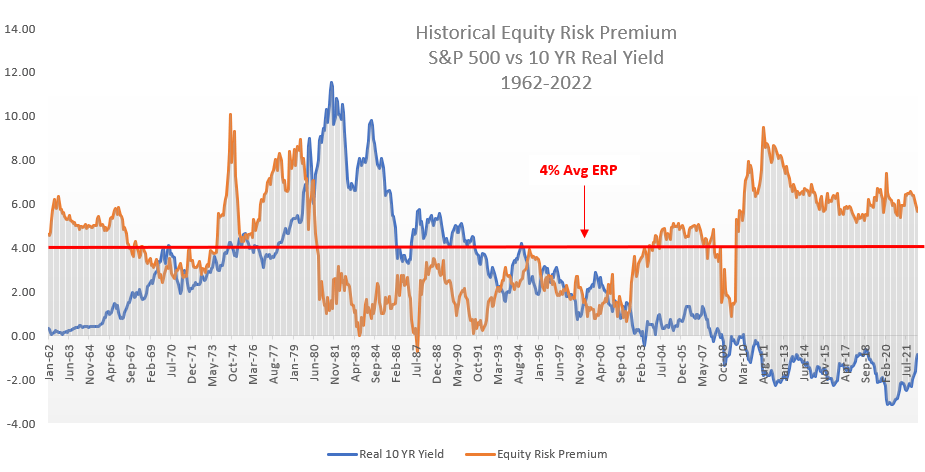
Below is an XY Scatterplot showing the monthly ERP and 10 YR Real Yield for the same period. This data includes 725 data points, and I’ve added a linear trendline with equation to the chart; this will come into play later.
ERP vs 10 YR Real Yield (Author’s personal data)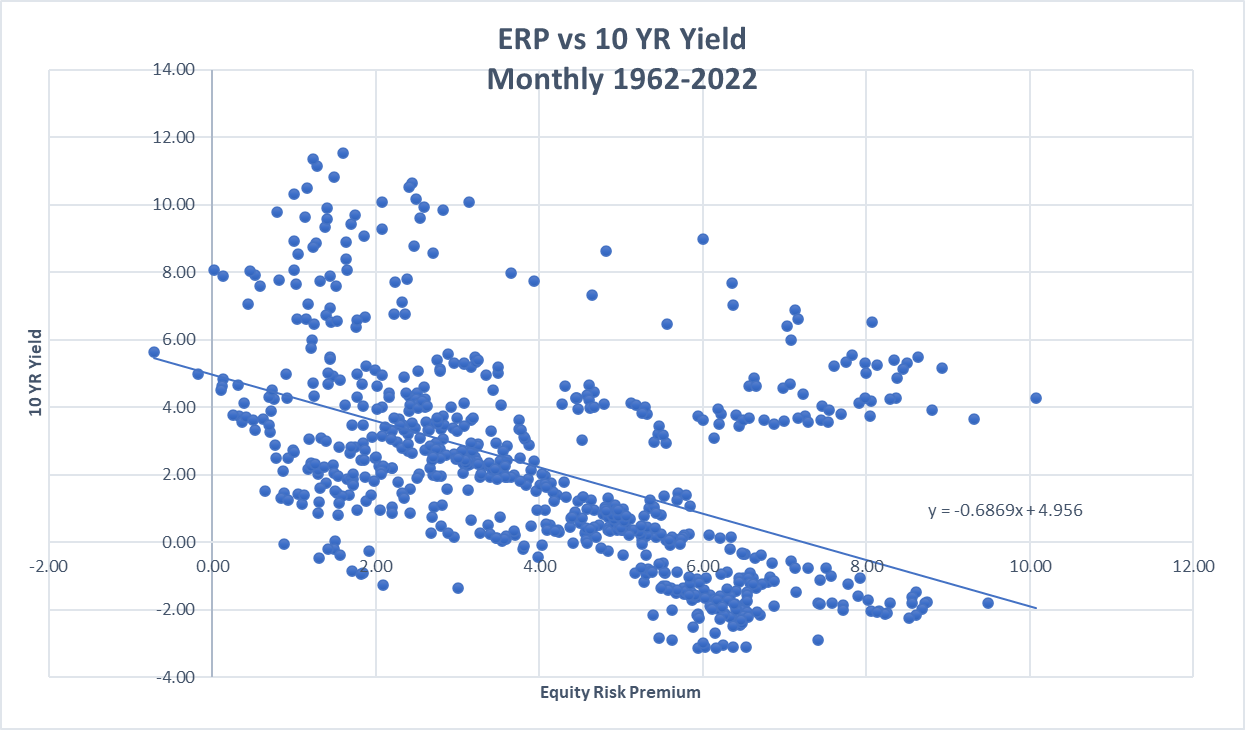
Using the Past to Predict the Future
Equipped with this knowledge, we can make a reasonable conclusion on the S&P 500’s current valuation and predict how the market may perform in the future.
In January 2020, the Congressional Budget Office released The Budget and Economic Outlook: 2020 to 2030. Within the outlook, the Fed includes their long-term targets for CPI and 10 YR nominal yield.
Federal Reserve Targets (Congressional Budget Office)
How the Fed will perform against these targets is anyone’s guess, and the bout of inflation they’re currently facing derails much of this analysis. But I will assume inflation does normalize at some point in the near future and use these long-term targets to forecast the S&P 500’s future returns.
Statistics for Dummies
I am by no means a statistician, but I do recall the concept of linear regression and y = mx + b. With a sample size of 725 months, we can use our formula of y = -0.6869x + 4.956 (from XY Scatterplot above) to calculate an appropriate ERP based on the Fed’s long-term, inflation-adjusted targets. For the calculation, x = ERP and y = 10 YR Real Yield. By solving for x, I am able to back into a “Forecast PE” and utilize the assumed 7% EPS growth to calculate a fair value for the S&P 500.
S&P 500 Forecast Return (Author’s personal data)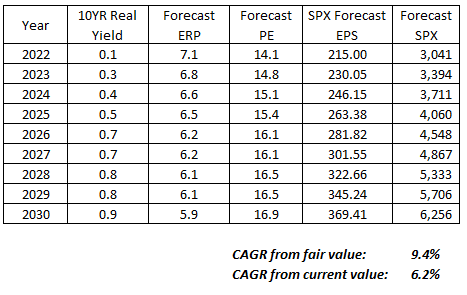
Current Valuation and Future Performance
Based on this information and because the market is forward-looking, I believe a fair value for the S&P 500 is around 3,400. With a current price near 3,950, the market appears to be approximately 16% overvalued.
S&P 500 Forecast Return w/ PE (Author’s personal data)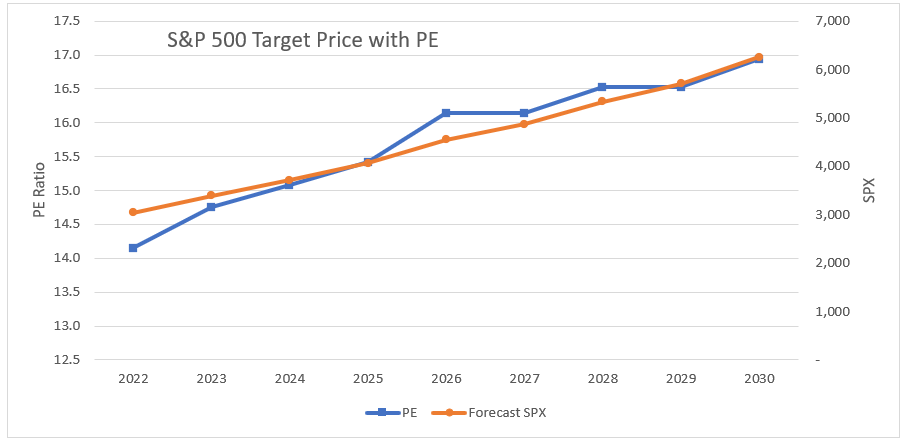
The data also indicates investors should be prepared for the market to go nowhere for the next couple of years as the Fed slowly increases interest rates to reach their target.
Lastly, the data indicates the market is likely to repeat history in returning around 7% annually between now and 2030. I know, it’s a rather anticlimactic conclusion, but the data does help establish a bit of confidence in the result.
Key Takeaways
Valuation and forecasting are more art than science. The data used to estimate the fair value and forecasted return for the S&P 500 is based on numerous assumptions and is by no means perfect. There is a near infinite number of micro and macroeconomic factors that will influence the actual outcome, but it does provide a level of understanding and expectation for investors. For instance, I personally will not be counting on much multiple expansion in the coming years as a result of this analysis.
My recommendation for readers is to utilize this data as a guidepost or litmus test in determining opportune times to buy or sell individual stocks. Or simply to temper expectations for a 20% average EPS growth and PE of 24 for the S&P 500. History simply doesn’t support this thesis. However, Mr. Market is oftentimes irrational and swings prices too high on good days and too low on bad days. Use this data to help identify Mr. Market’s mood and take advantage when he is in an irrational state!
Finally, the most important question an investor should ask themselves before purchasing an individual stock is “do I believe this stock will beat the market over the next several years?” If your analysis indicates Apple (AAPL), for example, will return 8% annually while the S&P 500 will return 7%, why take the risk on Apple? Why not simply buy the index and guarantee yourself a fair share of the market’s return?
Be the first to comment