

francescoch/iStock via Getty Images
I don’t usually like to promote equity CEFs that trade at ultra-high market price premiums of say 20% or more, but when two such funds are so clearly differentiated by just about every metric in the book, you have to wonder why a shareholder of one fund wouldn’t immediately swap over to the other, especially if high income is a prerequisite.
The Cornerstone Strategic Value Fund (NYSE:CLM), $10.33 current market price at the time of writing, and the Gabelli Multi-Media Trust (NYSE:GGT), $7.70 current market price at the time of writing, both offer income investors extremely high current market yields with their all-equity portfolios.
Note: Cornerstone offers two very similar funds, CLM and the Cornerstone Total Return Fund (CRF). For purposes of this article though, I will only use CLM for comparison
But if one offers an 11.4% current market yield and the other offers a much higher 21.0% market yield, would one be considered realistic while the other perhaps unrealistic?
Those uber high-market yields may be what brings investors flocking to these funds in the first place but the bigger question is: a) What are the NAV yields of the two funds, since that is what a fund actually needs to cover, and b) What are the NAV total returns of the two funds, since you will need portfolio appreciation and portfolio income if you want to have any hope of covering those huge distributions.
Let’s start with NAV yield. CLM’s current NAV yield is 26.6% while GGT’s is 16.3%. That may sound like it’s even more unrealistic for CLM, which actually sets a 21% NAV distribution each year, but due to this year’s bear market, CLM’s current NAV yield has climbed to 26.6%. Not exactly an easy nut to cover.
But guess what, Cornerstone readily admits that its funds aren’t necessarily expected to cover those NAV yields and that’s why Cornerstone conducts accretive Rights Offerings just about every year to help pad the NAV. This year’s Rights Offering was priced at 12% over NAV, which was higher than the usual 7%, and it was still massively oversubscribed by shareholders.
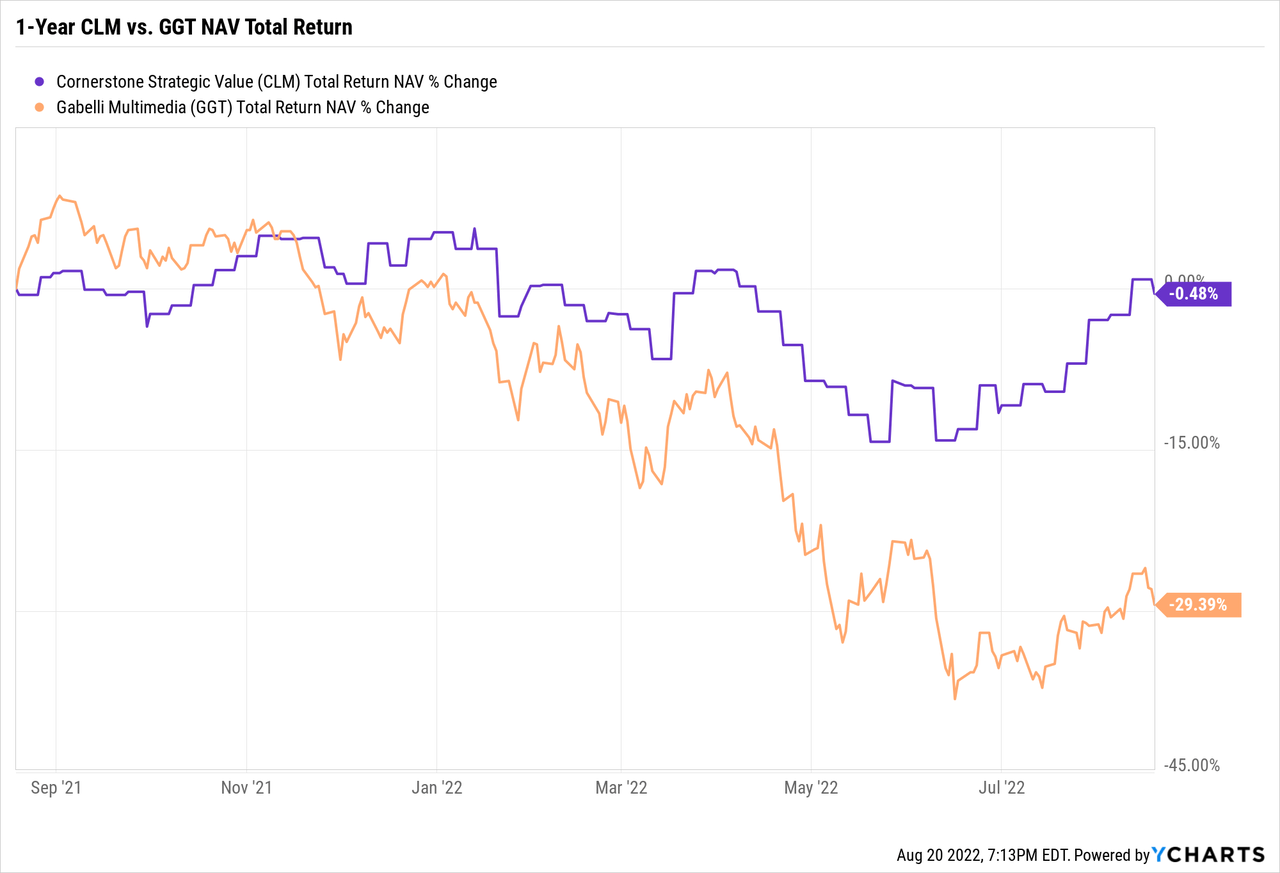
Now let’s look at NAV performance since if you’re going to offer uber high yields, you better have the performance goods to deliver. Let’s start with a 1-year NAV total return comparison.
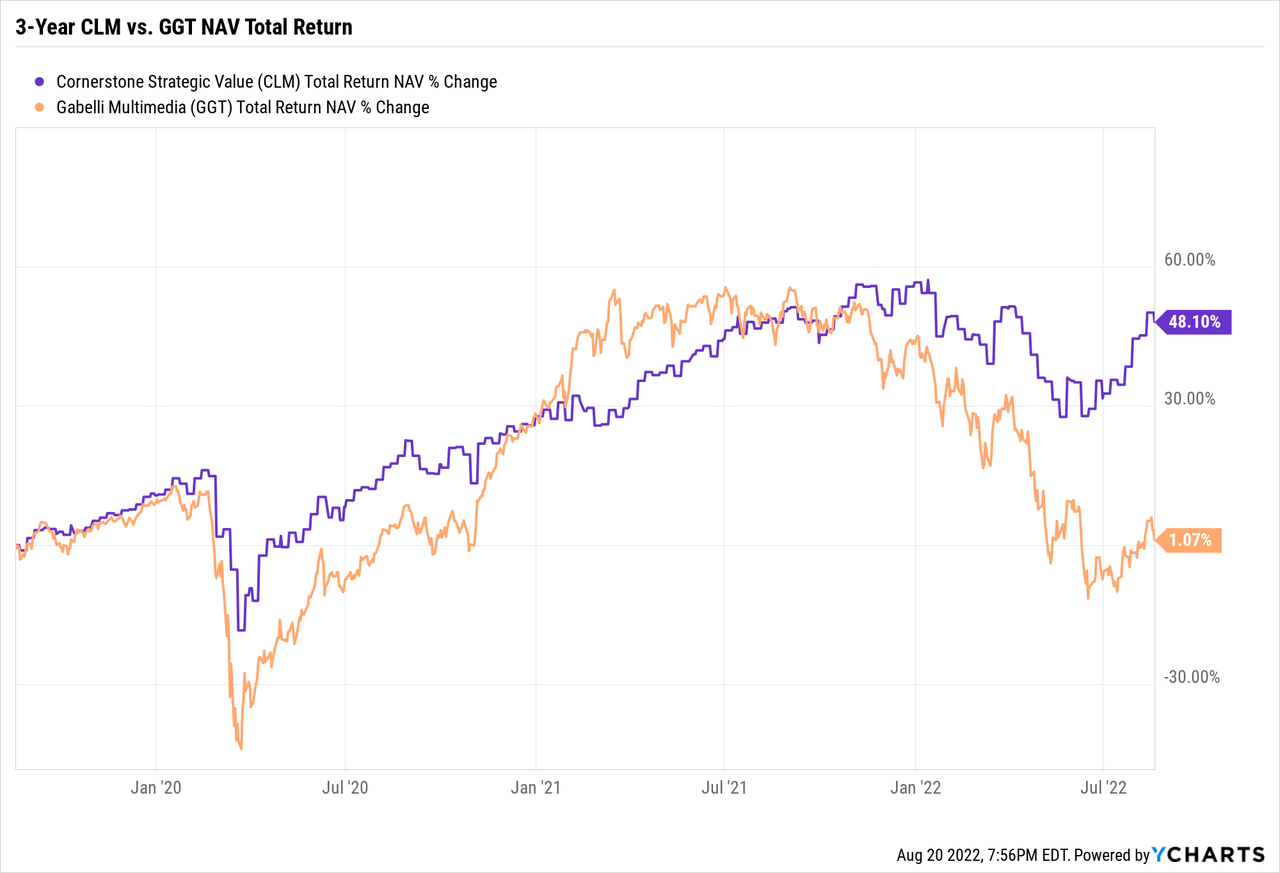
Let’s move on to a 3-year NAV total return comparison:
And here is a 5-year NAV total return comparison:
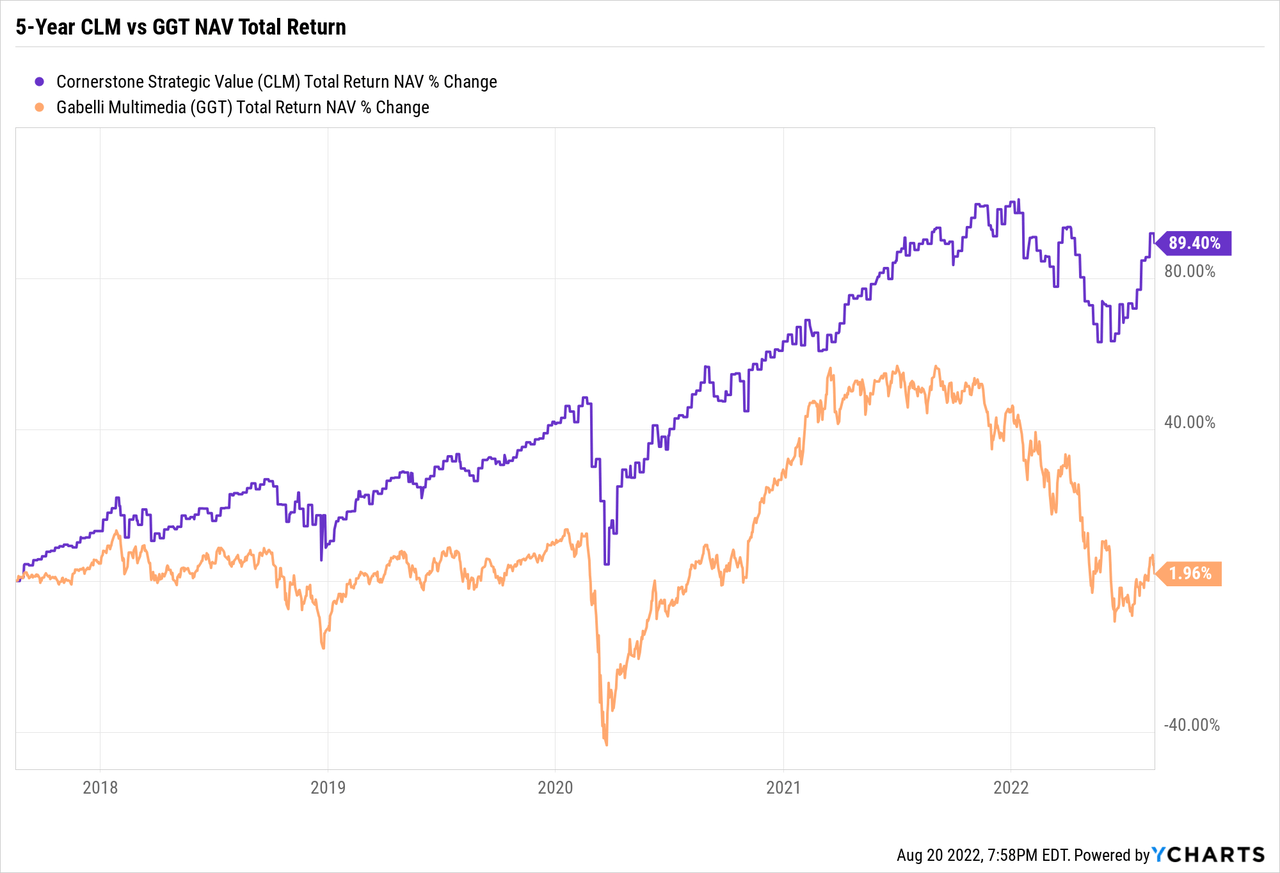
Those are pretty dramatic performance differences at NAV and it shows that at least CLM was in the running to cover those huge 21% NAV yields each year, whereas GGT hasn’t come even close to covering its annual 10% NAV distribution policy.
So the next question is whether or not GGT’s whopping 42.9% premium is due partly to shareholder expectations that a leveraged portfolio of multimedia stocks has a better chance of covering a 10% NAV distribution policy than say a fund that includes a significantly higher 21% NAV distribution policy.
Well, if you go on the 1-year, 3-year and 5-year NAV performances just shown, it appears that CLM should be the one trading at the much higher premium, which it was earlier this year when CLM hit a 60% premium high.
Here’s a 1-year Premium/Discount graph for CLM and GGT
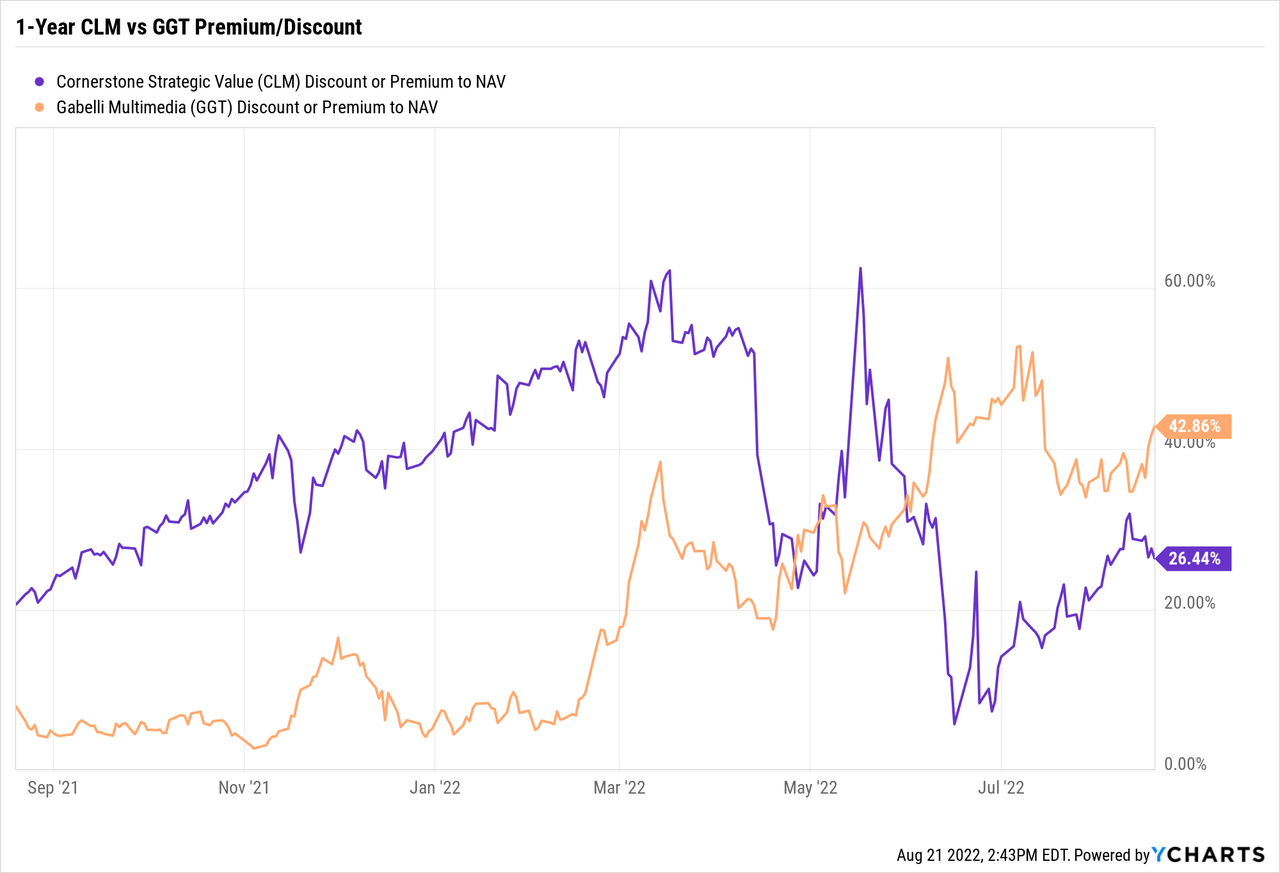
If you go back up to the 1-year NAV Total Return comparison graph in which CLM’s NAV is only down -0.5% while GGT’s NAV is down -29.4%, it’s hard to rationalize why GGT’s premium has been increasing while CLM’s has taken a sharp turn down.
Well, in the case of the Cornerstone funds, we know that CLM’s premium tends to peak before a Rights Offering, which this year was announced on April 8th, began on April 15th, was suspended on May 16th due to adverse market conditions and then resumed a week later on May 23rd. And we also know that CLM tends to bottom in valuation right around completion of the Rights Offering, which this year was on June 10th.
And as you can see below, this April to mid-June time period resulted in some wild gyrations in CLM’s premium and market price, made even more so due the Rights Offering suspension on May 16th, which spiked CLM’s back up to a 60% premium.
Y charts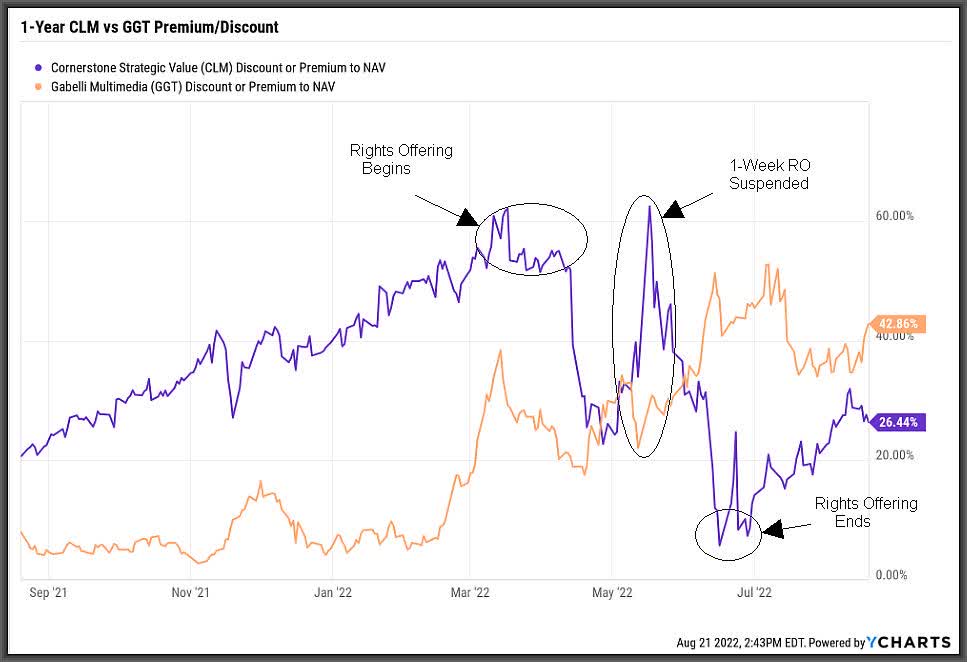
But more importantly, these gyrations were all very predictable around these dates, and as you can see, ever since the completion of this year’s Rights Offering around mid-June, CLM’s premium is back on the way up.
Which makes sense considering CLM’s superior NAV performance, which is down only -6.0% YTD compared to the S&P 500 down -11.3% YTD. On the other hand, who could possibly rationalize GGT’s valuation increase when its NAV is down -29.3% YTD.
Maybe shareholders expect a rebound in the communication, cable and entertainment stocks that GGT invests in? Or maybe this says more about shareholders misreading how slower growth for large-cap communication, cable and entertainment stocks is contributing to GGT’s underperformance at NAV even while the fund maintains a $0.22/share quarterly distribution that is becoming less and less likely to cover. More on that below.
One thing is for sure. GGT has been short on growth from its portfolio in recent years and portfolio income is virtually non-existent. In fact, any shareholder relying on CEFConnect.com for information on GGT better understand that GGT’s distributions are NOT 100% ordinary income as shown on CEFConnect.com but rather are mostly destructive Return-of-Capital at this point.
How do I know that? Just go to GGT’s Annual Report as of 12/31/2021 and you’ll see that last year, GGT’s distributions were 68.9% long term capital gains (the $15,660,653 below) and 23.3% Return-of-Capital (the $5,303,790 below), a rather large increase from 2020.
Ordinary Income was the smallest by far at only $1,768,849 for the year or 7.8% on a percentage basis. And that percentage included short term gains too.
GAMCO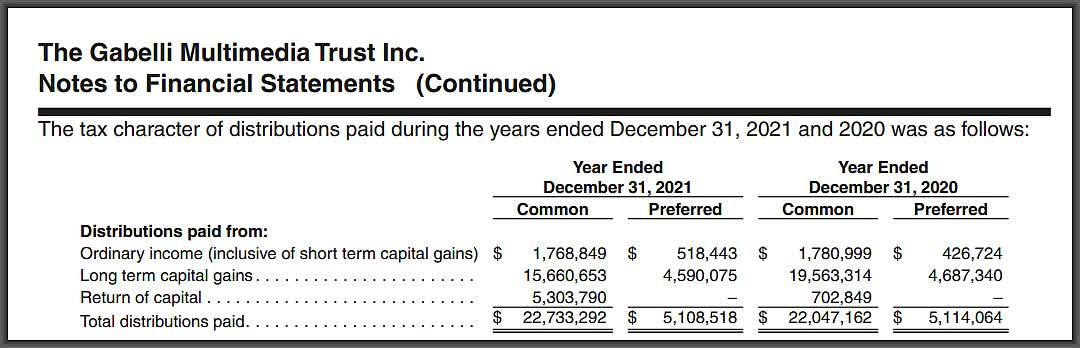
And that was during an UP year in 2021 for GGT in which its NAV gained 12% and its market price gained 20.1%. So imagine what is going to happen this year when GGT’s NAV has already collapsed from $8.25 at the beginning of this year to a current $5.39, or a mind-boggling -34.7% on an absolute basis. I think it’s safe to say that GGT’s distributions for 2022 will show a much higher Return-of-Capital percentage and mostly of the destructive kind.
Note: Return-of-Capital in a fund’s distribution is not necessarily a negative, particularly for option-income CEFs, but it is most definitely a problem for leveraged CEFs that rely on portfolio appreciation
Now let’s look at CLM. The Cornerstone funds are more like a sector diversified S&P 500 fund though with far less than 500 holdings. In fact, CLM has about 150 large cap holdings including other high yielding CEFs to bring in income.
That might help explain why CLM’s NAV has performed so much better since a diversified portfolio in sectors like healthcare, financials, industrials and energy has definitely produced better results recently than just being overloaded in the large cap information technology sector.
But does CLM’s dramatic NAV outperformance over 1-year, 3-year and 5-year periods include the Rights Offerings which helped buffer the NAV? Well, of course it does but that’s part of Cornerstone’s strategy and why they offer such a high NAV yield, the highest by far of any CEFs.
But there’s one more reason why CLM makes for a dramatically more attractive premium-priced CEF than GGT. And that has to do with Cornerstone’s reinvestment plan. Unlike CEFs like GGT, which allows shareholders to reinvest those big distributions at 95% of the fund’s market price when they trade at large premiums, Cornerstone allows shareholders to reinvest those even bigger percentage distributions at NAV no matter what the premium is.
This is, by far, the most attractive feature of the Cornerstone funds and no other CEF uses this strategy more effectively than Cornerstone. In fact, this feature by itself could arguably reduce CLM’s high premium valuation in half, since what is it worth to be able to reinvest 21% of your position each year well below the market price? I can’t say for sure but that certainly brings down the high premium valuation considerably.
So if CLM climbs back to a 60% market price premium, where it was earlier this year just before this year’s Rights Offering and before the bear market really hit, can you see what an advantage that is for shareholders who reinvest? Even at a current 26.4% market price premium, lower than GGT’s 42.9% current premium, that is still a hefty advantage in CLM’s favor if you could re-invest at the much lower NAV rather than 95% of the market price.
It also makes you wonder what do investors see in GGT? I follow well over 100 equity CEFs and if you just look at the funds that are showing -20% or more total return NAV loss this year (includes distributions), they are all showing roughly similar market price total return losses too. Except for GGT, which is shown in the yellow circle below.
Source: Capital Income Management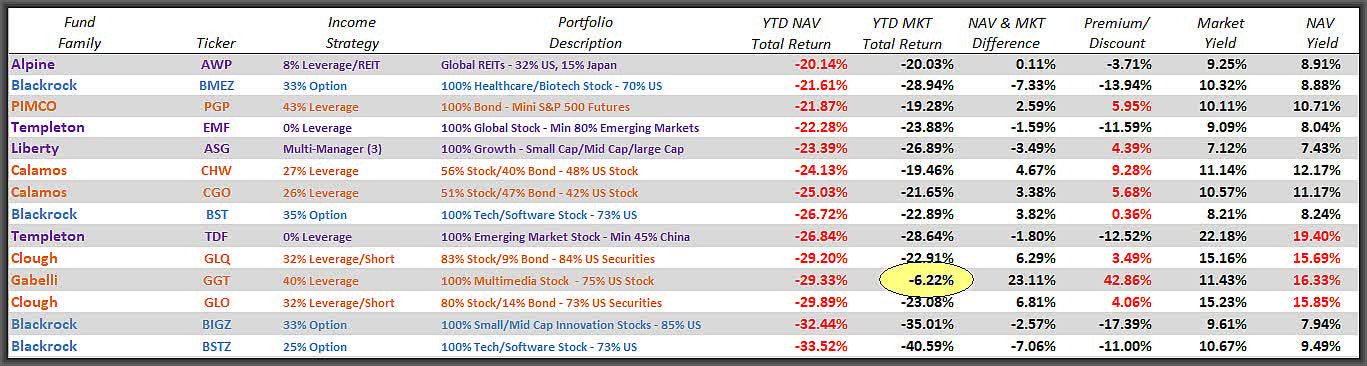
So would somebody please explain to me how GGT’s market price is only down -6.2% YTD when it has the fourth worst NAV performance of all the equity CEFs I follow?
That’s utterly absurd and frankly, GGT should be trading at no better than par valuation right now. Because there’s one more reason why GGT shareholders would be wise to swap over to a fund like CLM which trades at a far lower premium and offers a much higher yield paid monthly, not quarterly like GGT.
And that is because GGT’s $0.22/share per quarter distribution is going to be in serious jeopardy in the 4th quarter of this year. Everybody knows that the Cornerstone funds, CLM and CRF, will be cutting their distributions for 2023 based on their 21% NAV distribution policy.
There’s no surprise there and in fact, Cornerstone raised their fund’s distributions this year based on last year’s NAV performance of up 22.4%, which was CLM’s NAV total return for 2021. Cornerstone simply uses the last business day of October to determine the next year’s 21% of NAV distribution divided by 12 monthly payments.
But for GGT shareholders, the expectation is that GGT’s $0.22/share quarterly distribution will remain the same, as if in perpetuity, just like it has for the last three years at $0.22/share quarterly distributions or $0.88/share each year. That has not wavered even during COVID-19 when Gabelli kept GGT’s distribution at $0.22/share even though the fund had already used up its 10% of NAV by the 3rd quarter distribution.
I even pointed this out in this article from November of 2020, Equity CEFs: Count Yourself Lucky If You Own GAB Or GGT, that if Gabelli had gone by the book on its 10% NAV distribution policy, GAB would have had to cut its 4th quarter distribution from $0.15/share to $0.03/share while GGT should not have had a distribution at all since it had already used up its 10% NAV distribution by the 3rd quarter.
And that’s exactly where we find ourselves today. GGT has once again used up its total distribution for the year by maintaining its quarterly distribution at $0.22/share, only this time it’s even worse. Gabelli even said last week in its 3rd quarter distribution declaration Press Release that,
We note that the minimum annual distribution of 10% of the average net asset value of the Fund is based on the ending net asset values per share as of December 31, 2021, March 31, 2022, June 30, 2022, and September 30, 2022. The current net asset value is $5.51 per share and 10% of the average net asset values of the Fund would be an annualized amount approaching $0.66 per share.
That is exactly the same language that Gabelli used in their 3rd quarter of 2020 distribution declaration when they said:
We note that the minimum annual distribution of 10% of the average net asset value of the Fund is based on the ending net asset values per share as of December 31, 2019, March 31, 2020, June 30, 2020, and September 30, 2020. The current net asset value is $6.98 per share and 10% of the average net asset values of the Fund would be an annualized amount approaching $0.66 per share.
If you read between the lines, what this means is that Gabelli (GAMCO) is telling shareholders that, “Hey, if we use GGT’s current NAV for the September 30th calculation, we’re just letting you know that GGT has already paid its full 10% distribution in the previous three quarters.”
In other words, there’s no guarantee that we will kick the can down the road again this year like we did in 2020. We’ll find out in November but here’s a warning for GGT shareholders.
The fund may look fine from a market price performance standpoint but with an NAV having eroded another -21% between August of 2020 and August of 2022, i.e. from $6.98 to a current $5.39, it’s only a matter of time before Gabelli is forced to cut GGT’s distribution and I believe it’s going to happen this year.
Conclusion
In the world of high-yielding and high-premium priced CEFs, predictability of distributions and predictability of valuations can be your lifeline in case of a bear market.
In the case of the Cornerstone funds like CLM, there is a high degree of predictability there even if you can’t predict when a bear market will hit. But for GGT, no fund is more deserving of a negative surprise this year than this fund, so if high income is what you’re looking for and aren’t too concerned about valuations, CLM offers a far better set of fundamentals than GGT.
Again, I don’t like to promote CEFs that trade at 20%+ premiums, but if you want to remember one point from this article besides CLM’s much higher yield and much better NAV performance than GGT, remember this.
Being able to reinvest distributions at NAV no matter what the market price premium, brings down the Cornerstone’s valuations considerably. How much I can’t say but half would not be out of the question.
To me, this swap idea is a no-brainer but I understand that we’re talking about two different funds both in size, GGT at about $250 million in managed assets ($150 million in net assets) vs. almost a billion for CLM, as well as shareholder overlap, which may be minimal.
But that’s beside the point. If a CEF like GGT can rise to a 42.9% market price premium with the terrible fundamentals it has, how high in price and valuation should a fund like CLM being trading at? I don’t know but certainly north of GGT.
Be the first to comment