

Jira Pliankharom/iStock via Getty Images
The article is primarily based on technical analysis, which I use personally to assess if a bounce is likely in a downtrend. In the past 9 weeks, the S&P 500 (NYSEARCA:SPY) has had a handful of positive days. The downtrend might make a temporary bottom, but to have a meaningful turnaround for equities, several headwinds will have to become tailwinds. That is unlikely to happen until inflation comes down meaningfully and sequentially. Once inflation falls for multiple months, the Fed could change forward guidance.
Technical Analysis
For the past few days the S&P 500 has been closing just around 3600. Weekly charts are very important from an intermediate perspective. There are two main reasons for this from my perspective, based on technical analysis.
The first reason is that the S&P 500 is just above or around the 200 weekly moving average. This is closely followed by lots of institutions and investors.
The second reason is a 50% retrace of the up move from COVID lows to the January 2022 high for S&P 500 at 3505. It is possible for the S&P 500 to spike lower, but it is likely to close above 3550.
If you take the trade, then remain in the trade as long as the S&P 500 stays above 3500 and close the trade for a small loss if S&P 500 has a weekly close below 3500. However, if the bounce lasts a few weeks, then the S&P 500 could rally to the 4050-4150 zone.
S&P 500 weekly chart (Author )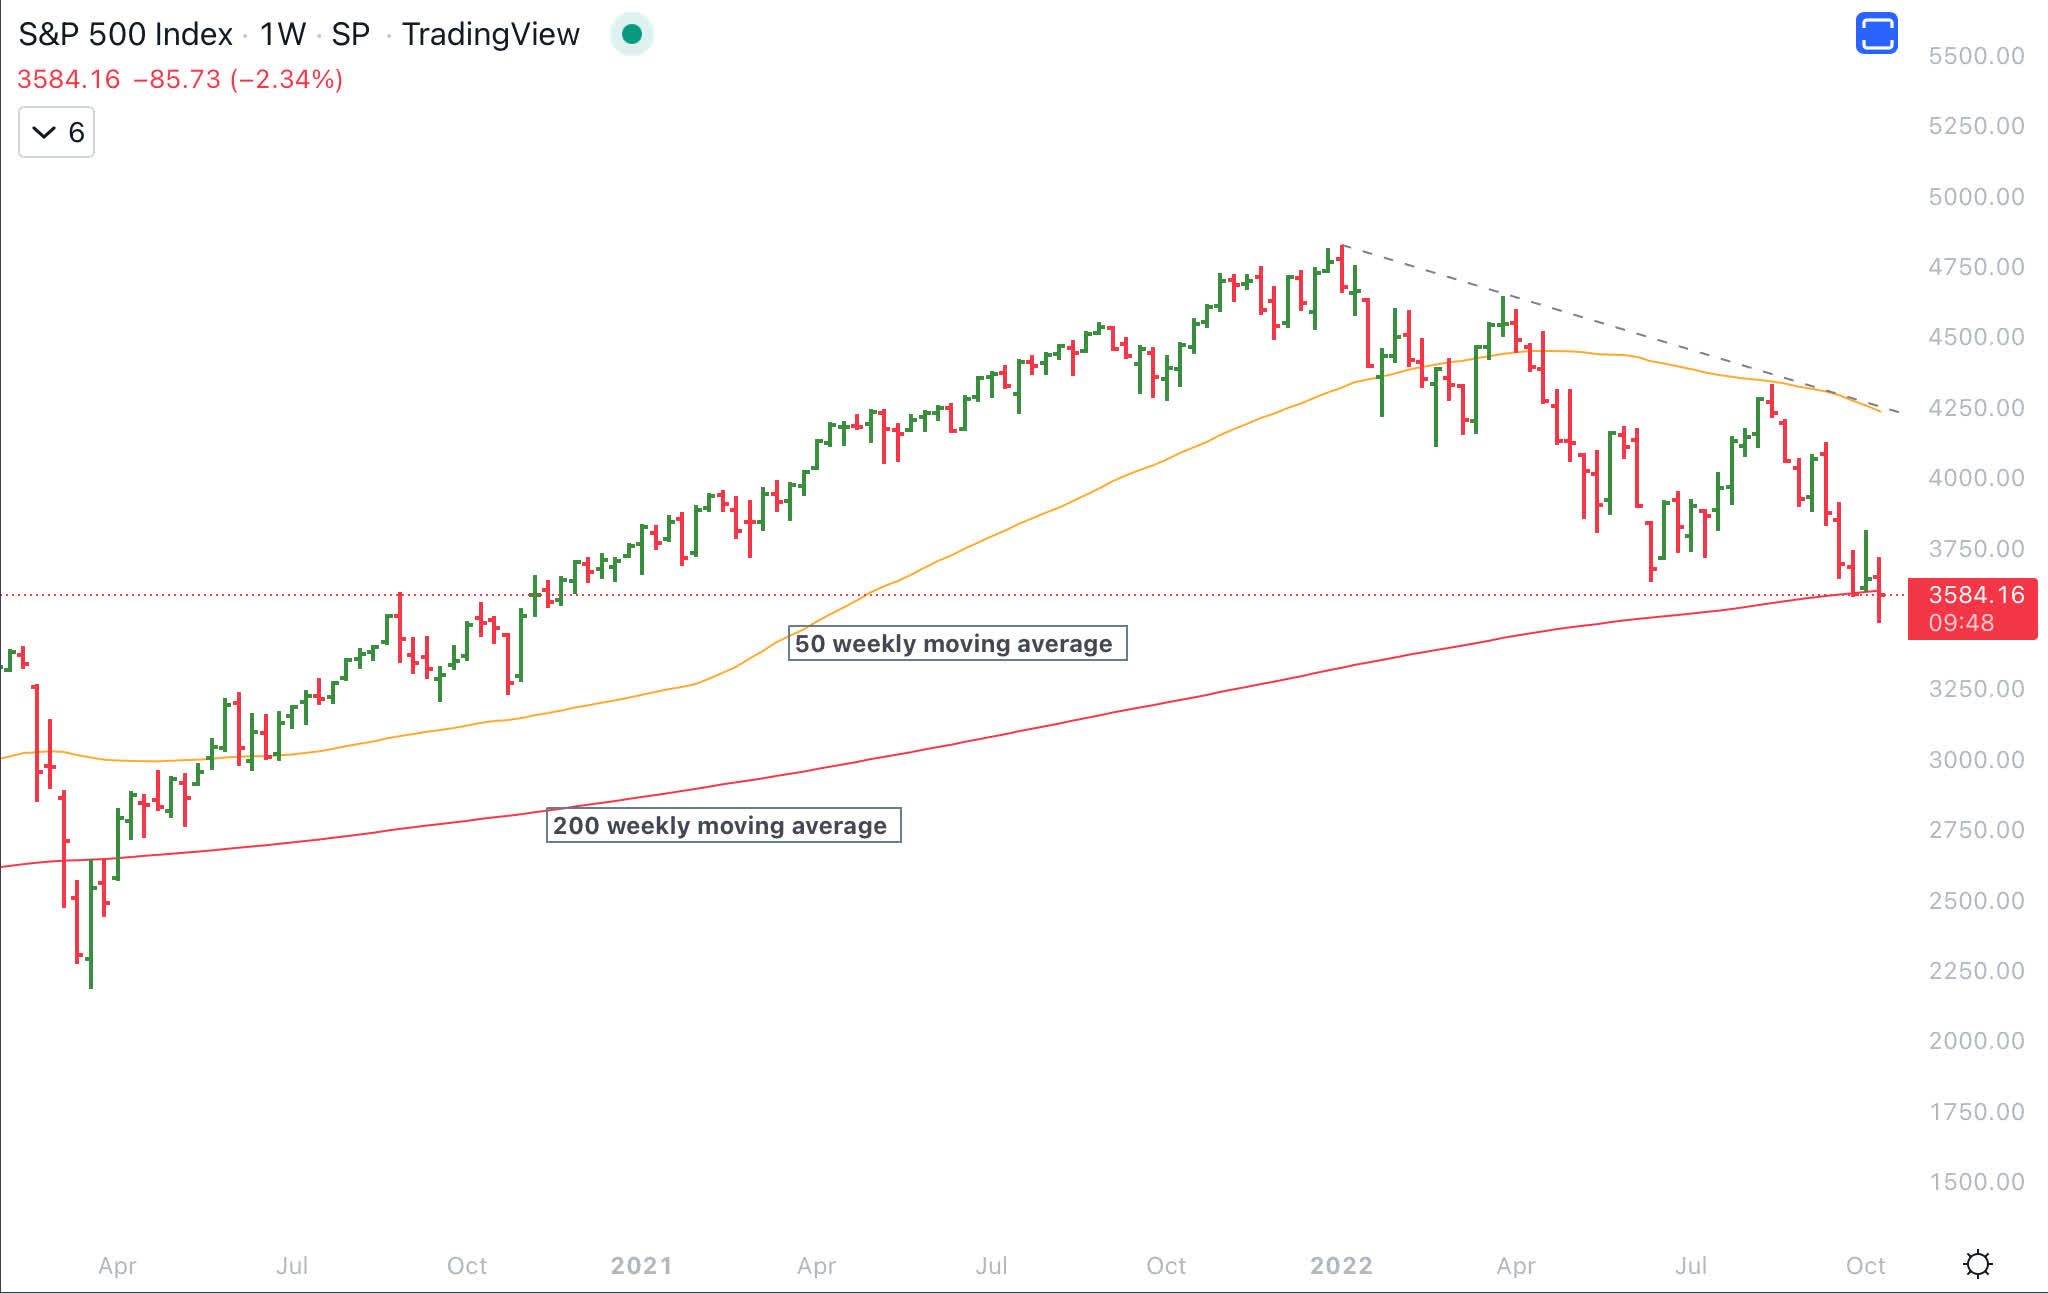
Divergence
There are a few divergences that I’m seeing. These divergences are the primary reasons I’m saying that we are near a temporary bottom from which equities could rally. The divergences are:
High Yield corporate bond (HYG) is making higher lows while the S&P 500 is making lower lows on the daily chart.
S&P 500 HYG Chart (Author)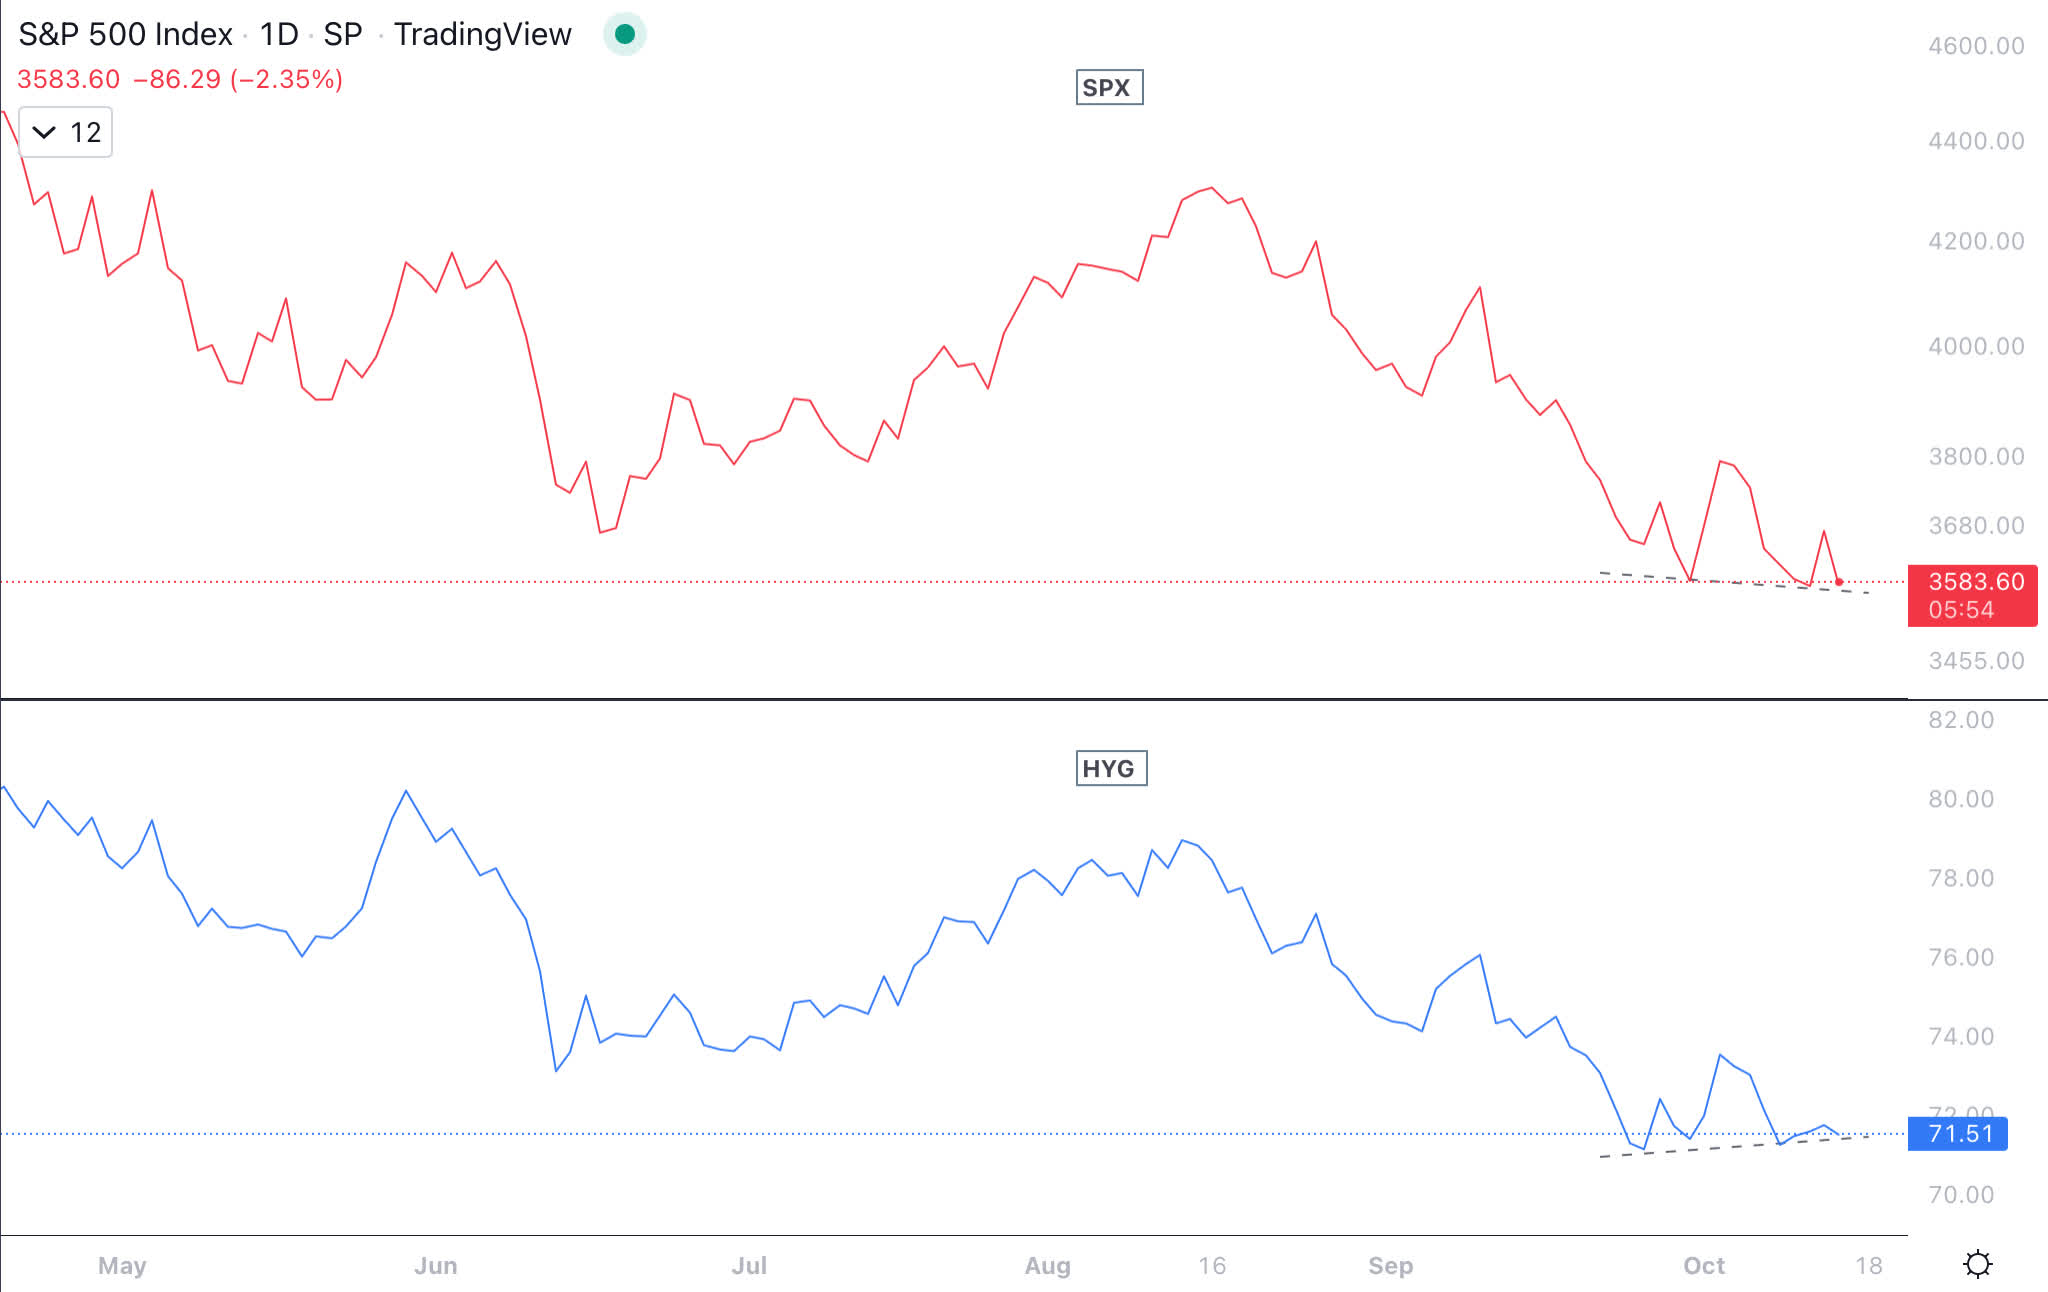
The second divergence is visible on the daily chart. Volatility (VIX) has not made higher highs in October 2022 compared to June 2022 level while S&P 500 has made lower lows in October 2022 compared to lows in June 2022.
S&P 500 VIX Chart (Author )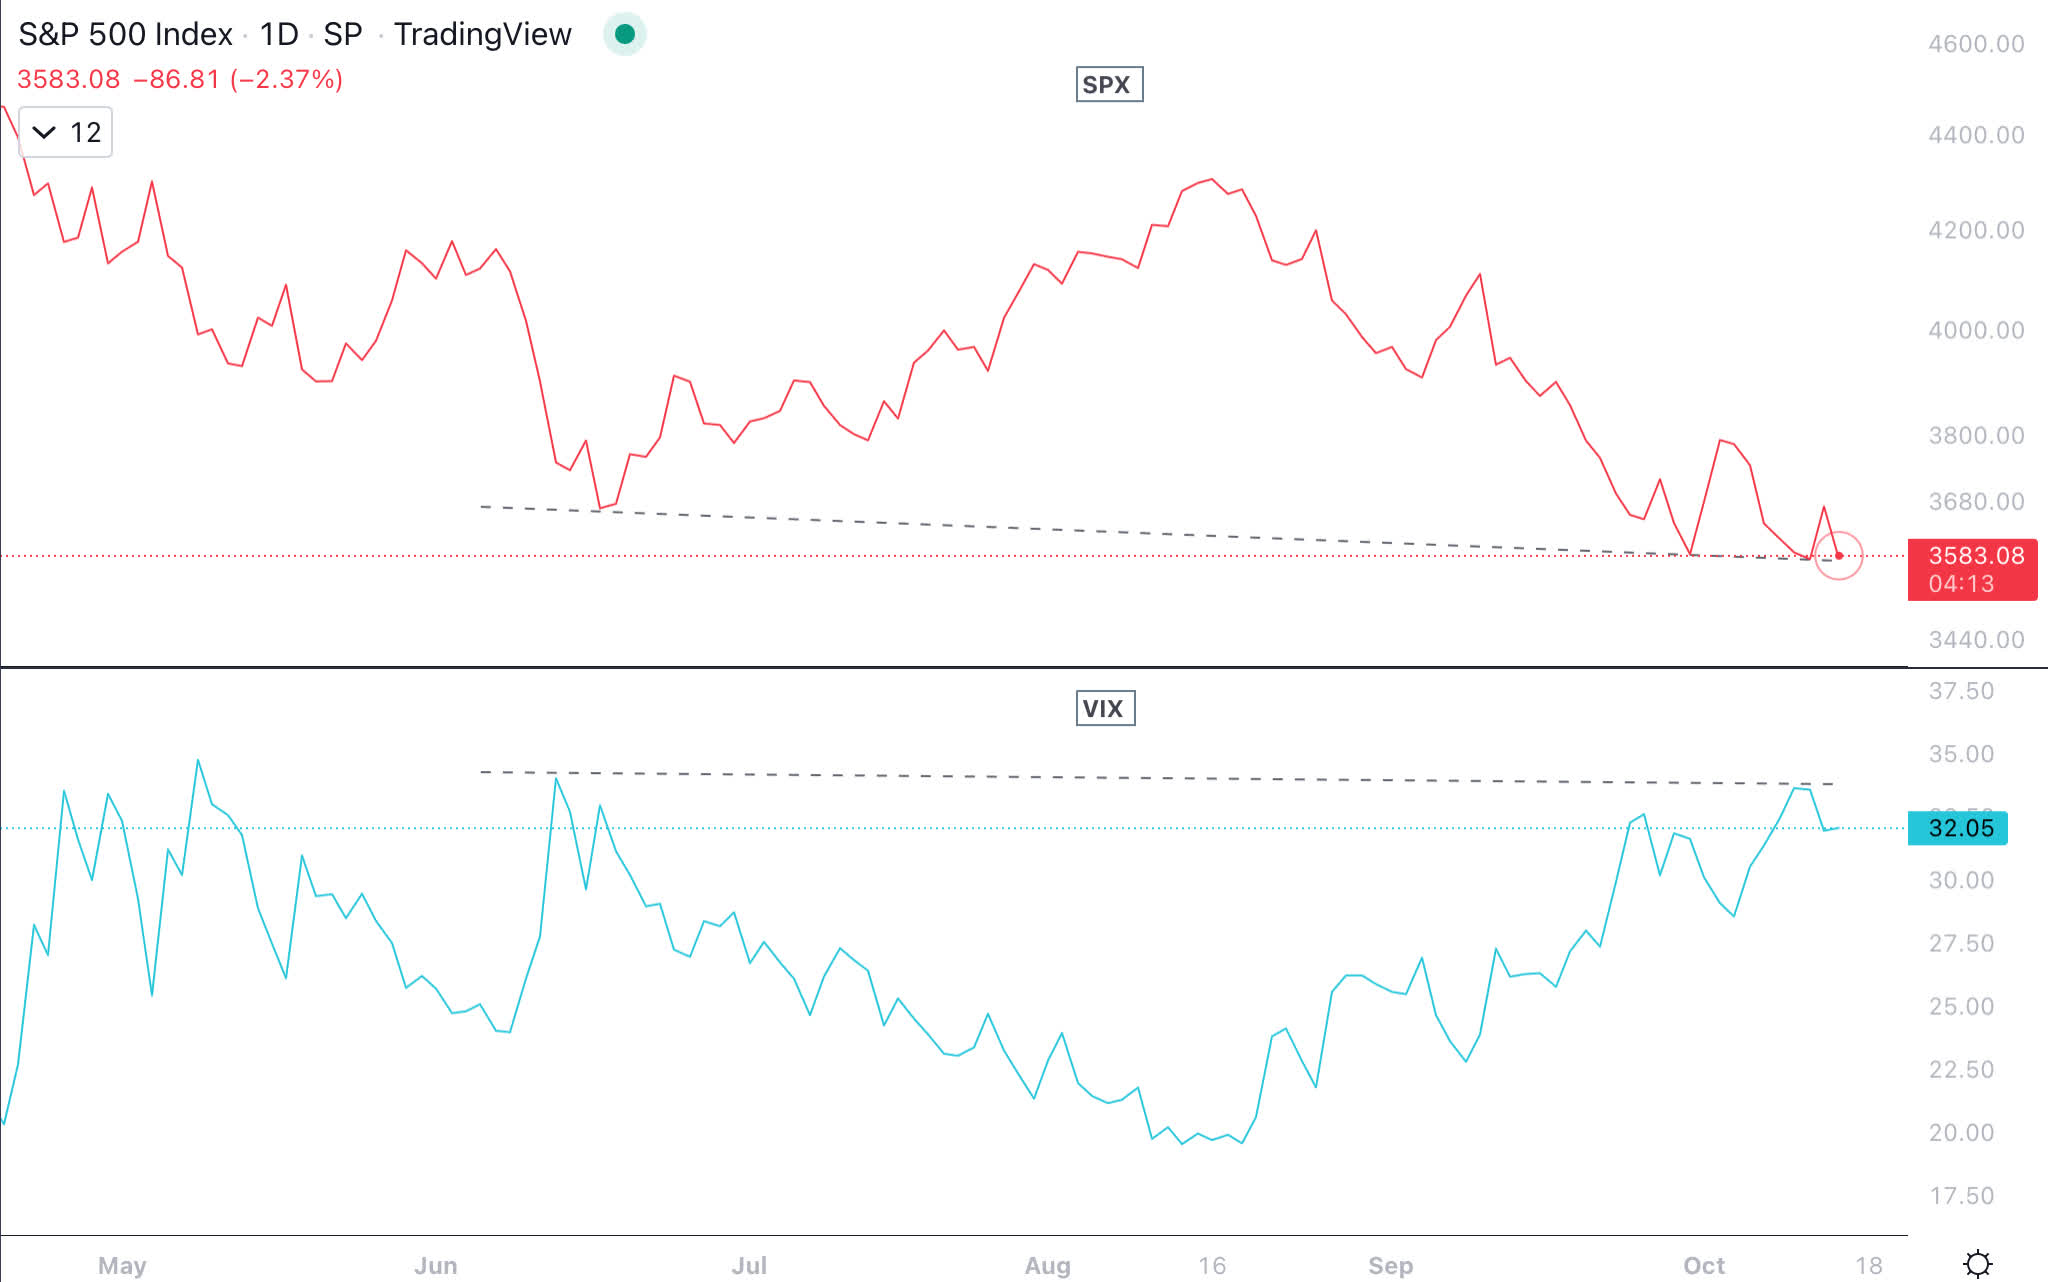
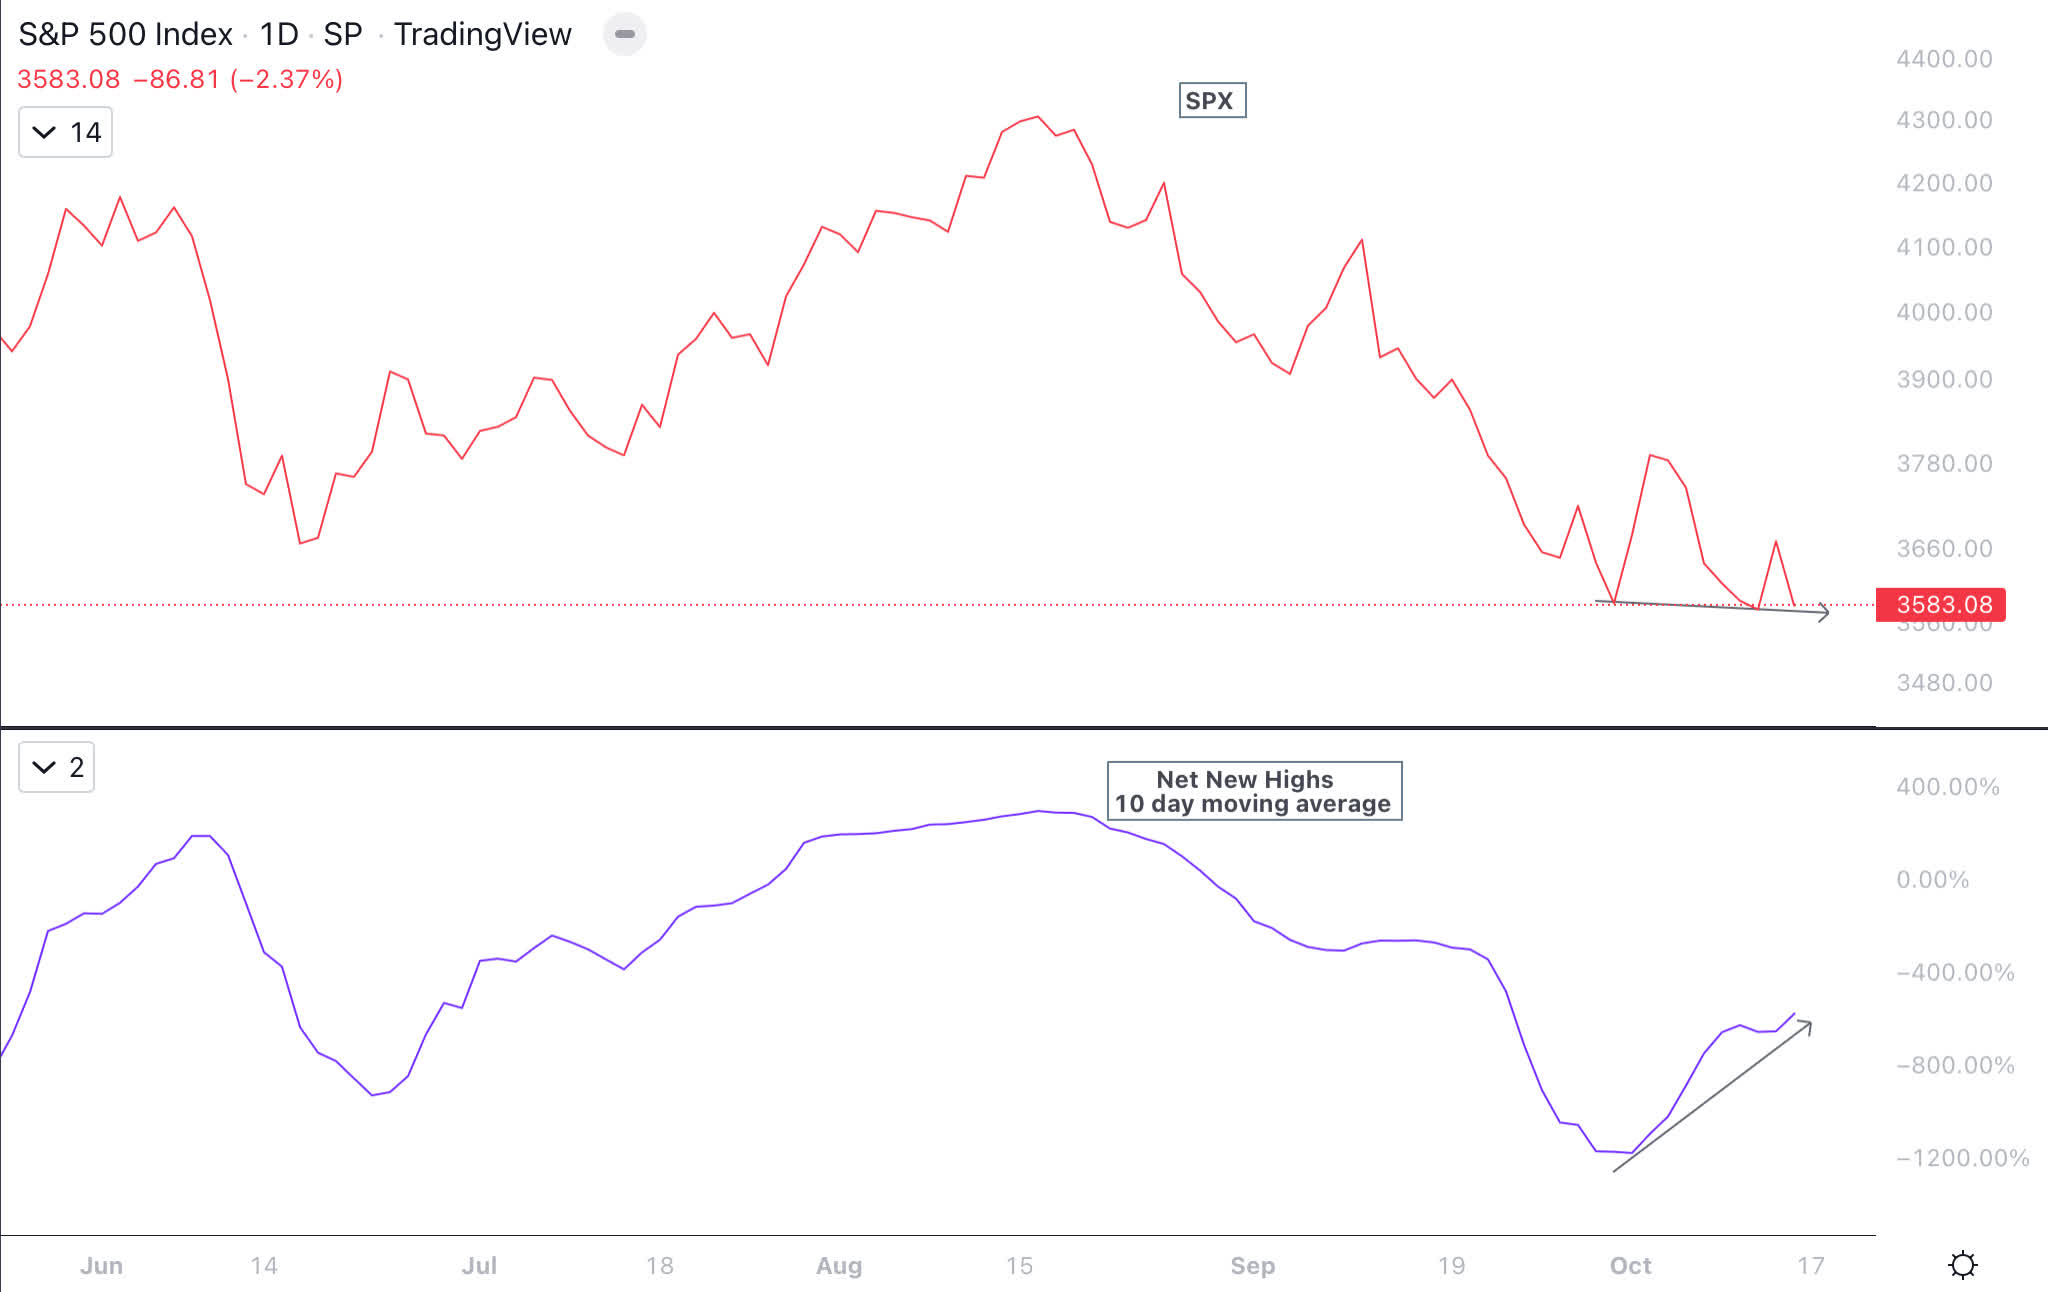
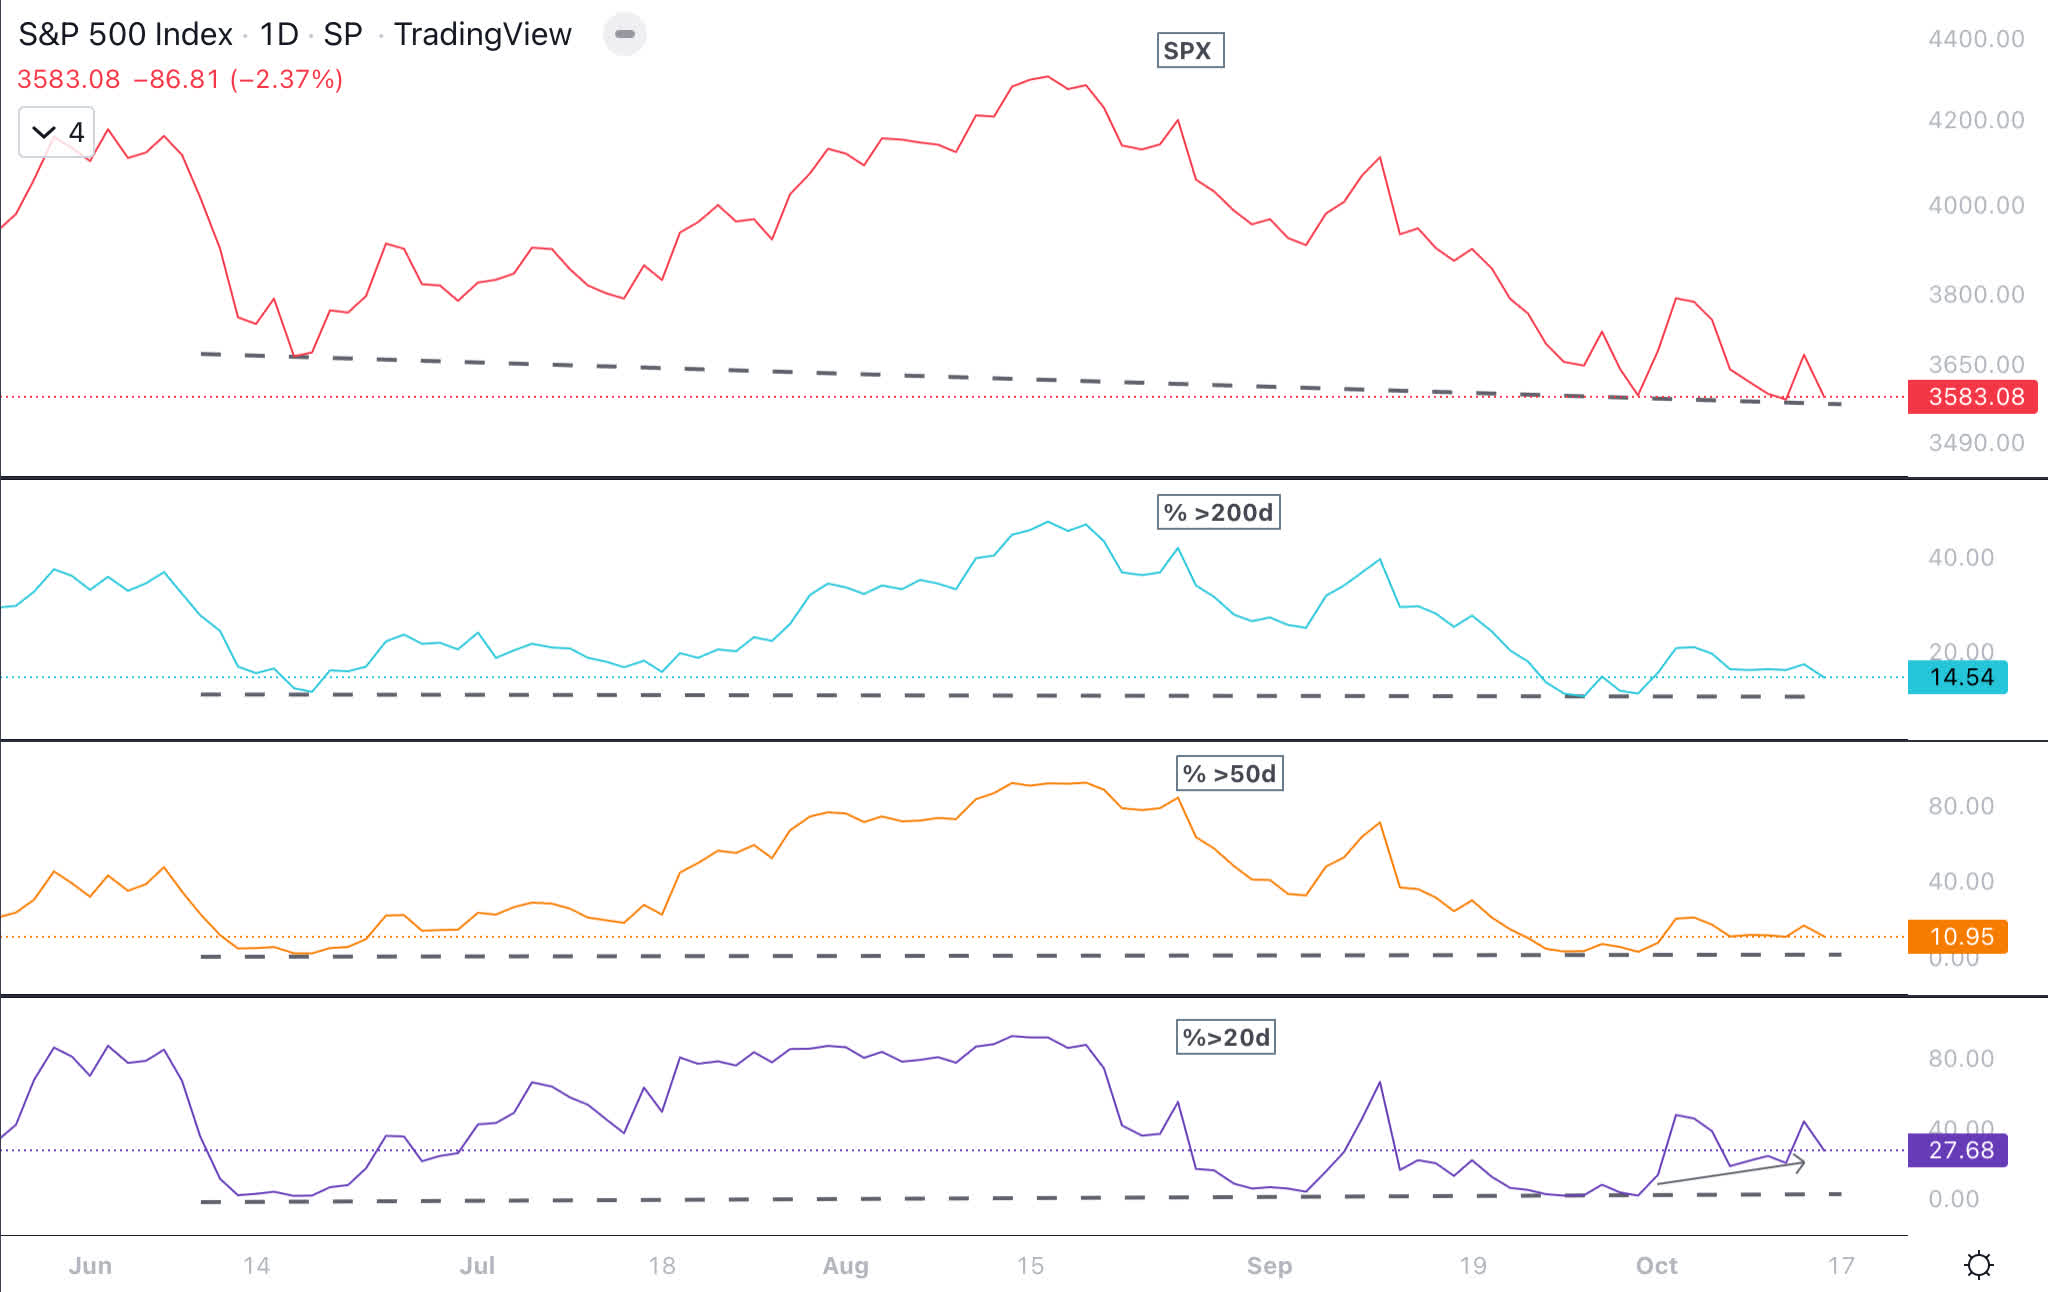
Small caps (IWM) have not broken below June 2022 lows while the S&P 500 has broken below June 2022 lows and has a clear divergence. Below that are charts showing divergences for “Net Advancing stocks,” “Net New Highs” and percentage above 20 day moving average, 50 day moving average and 200 day moving average.
S&P 500 Small Cap Chart (Author)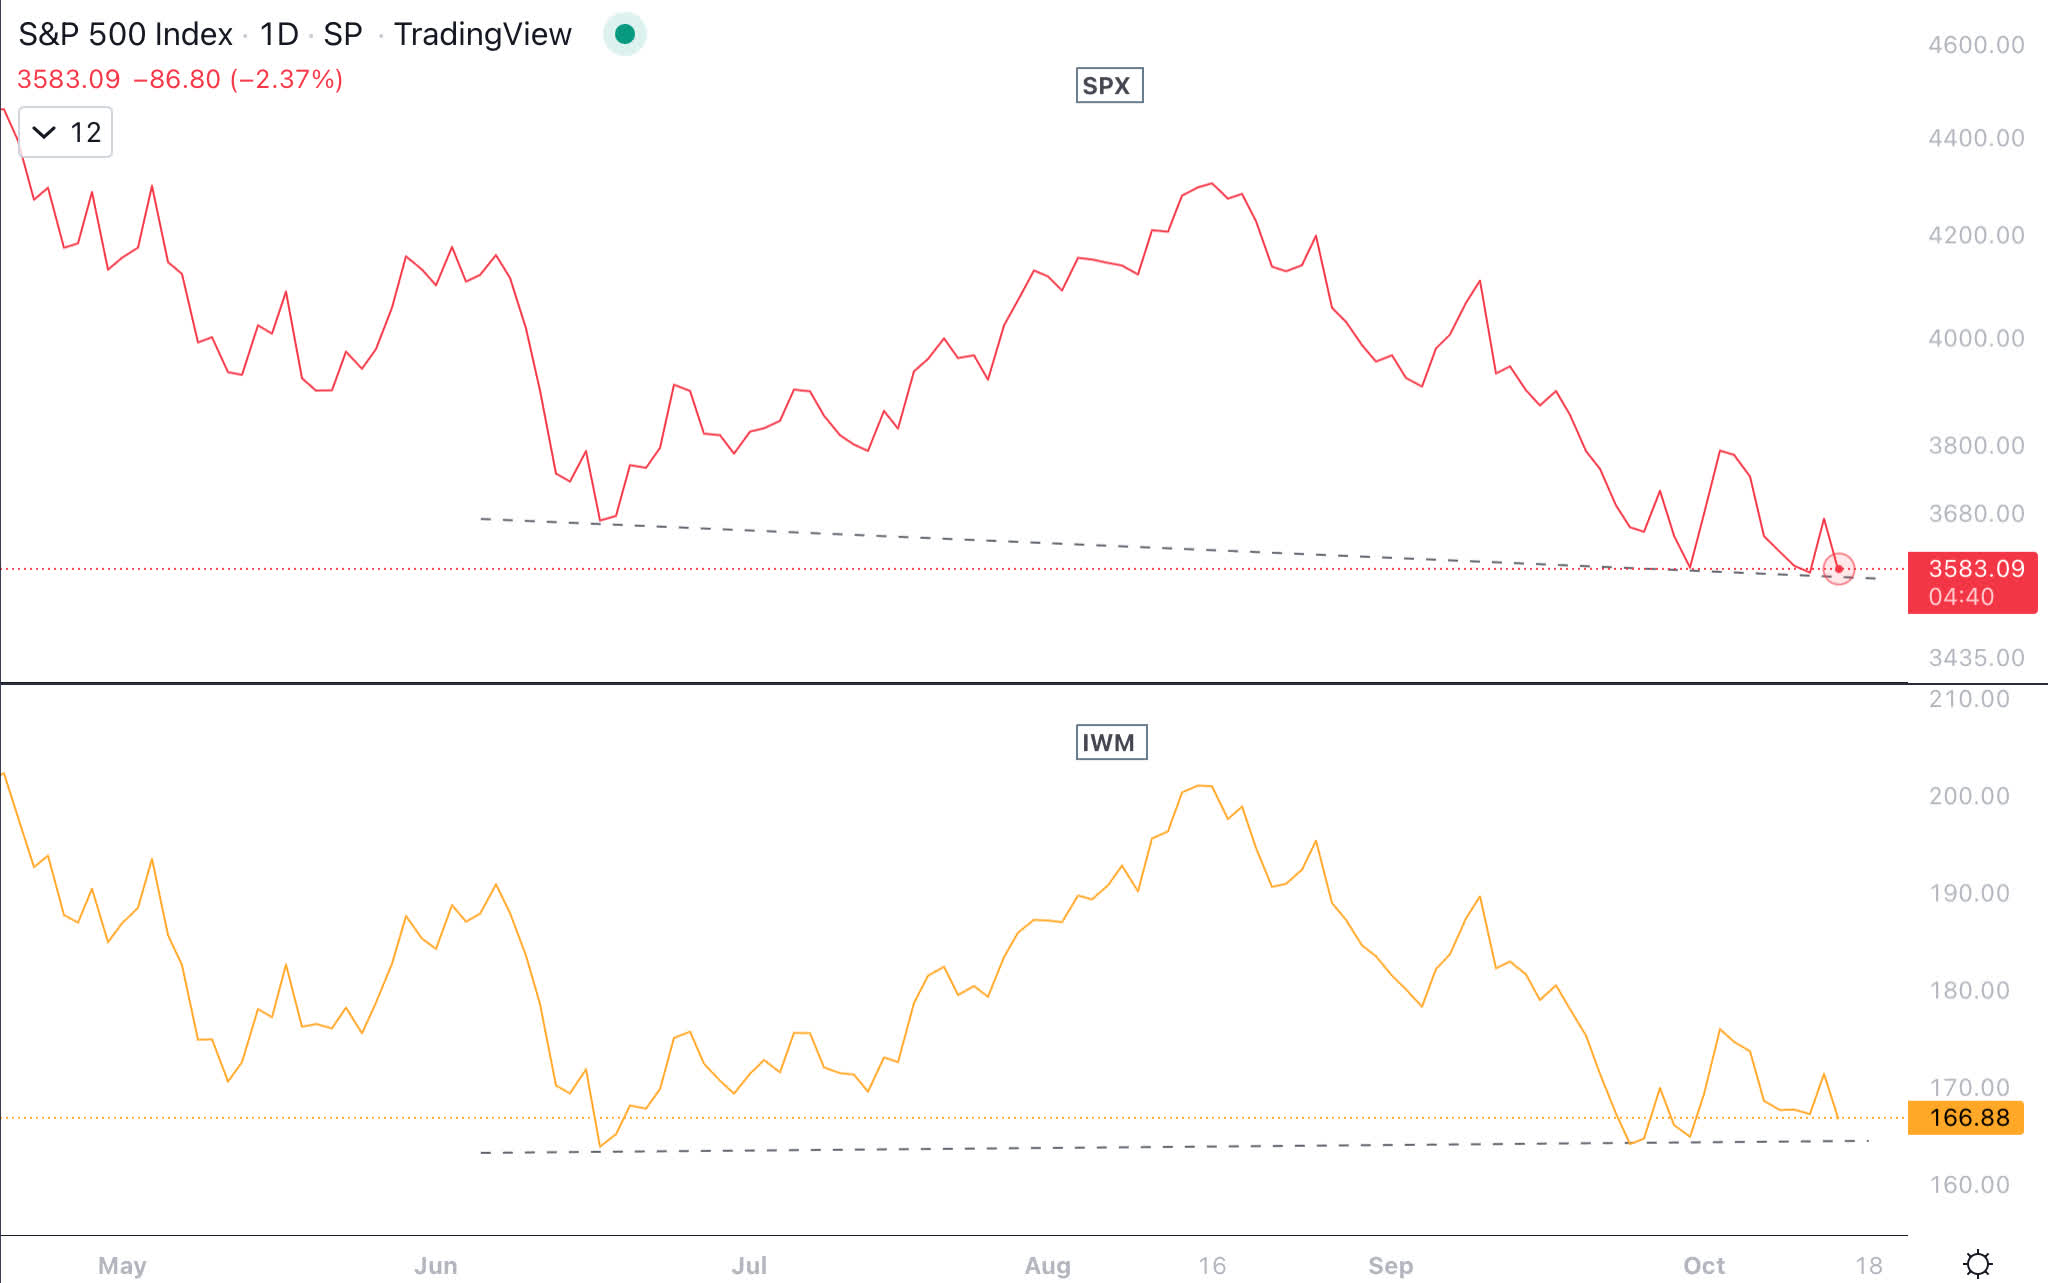
Net Advance (Author ) Net New Highs (Author) Pct above moving average 20, 50 & 200 (Author )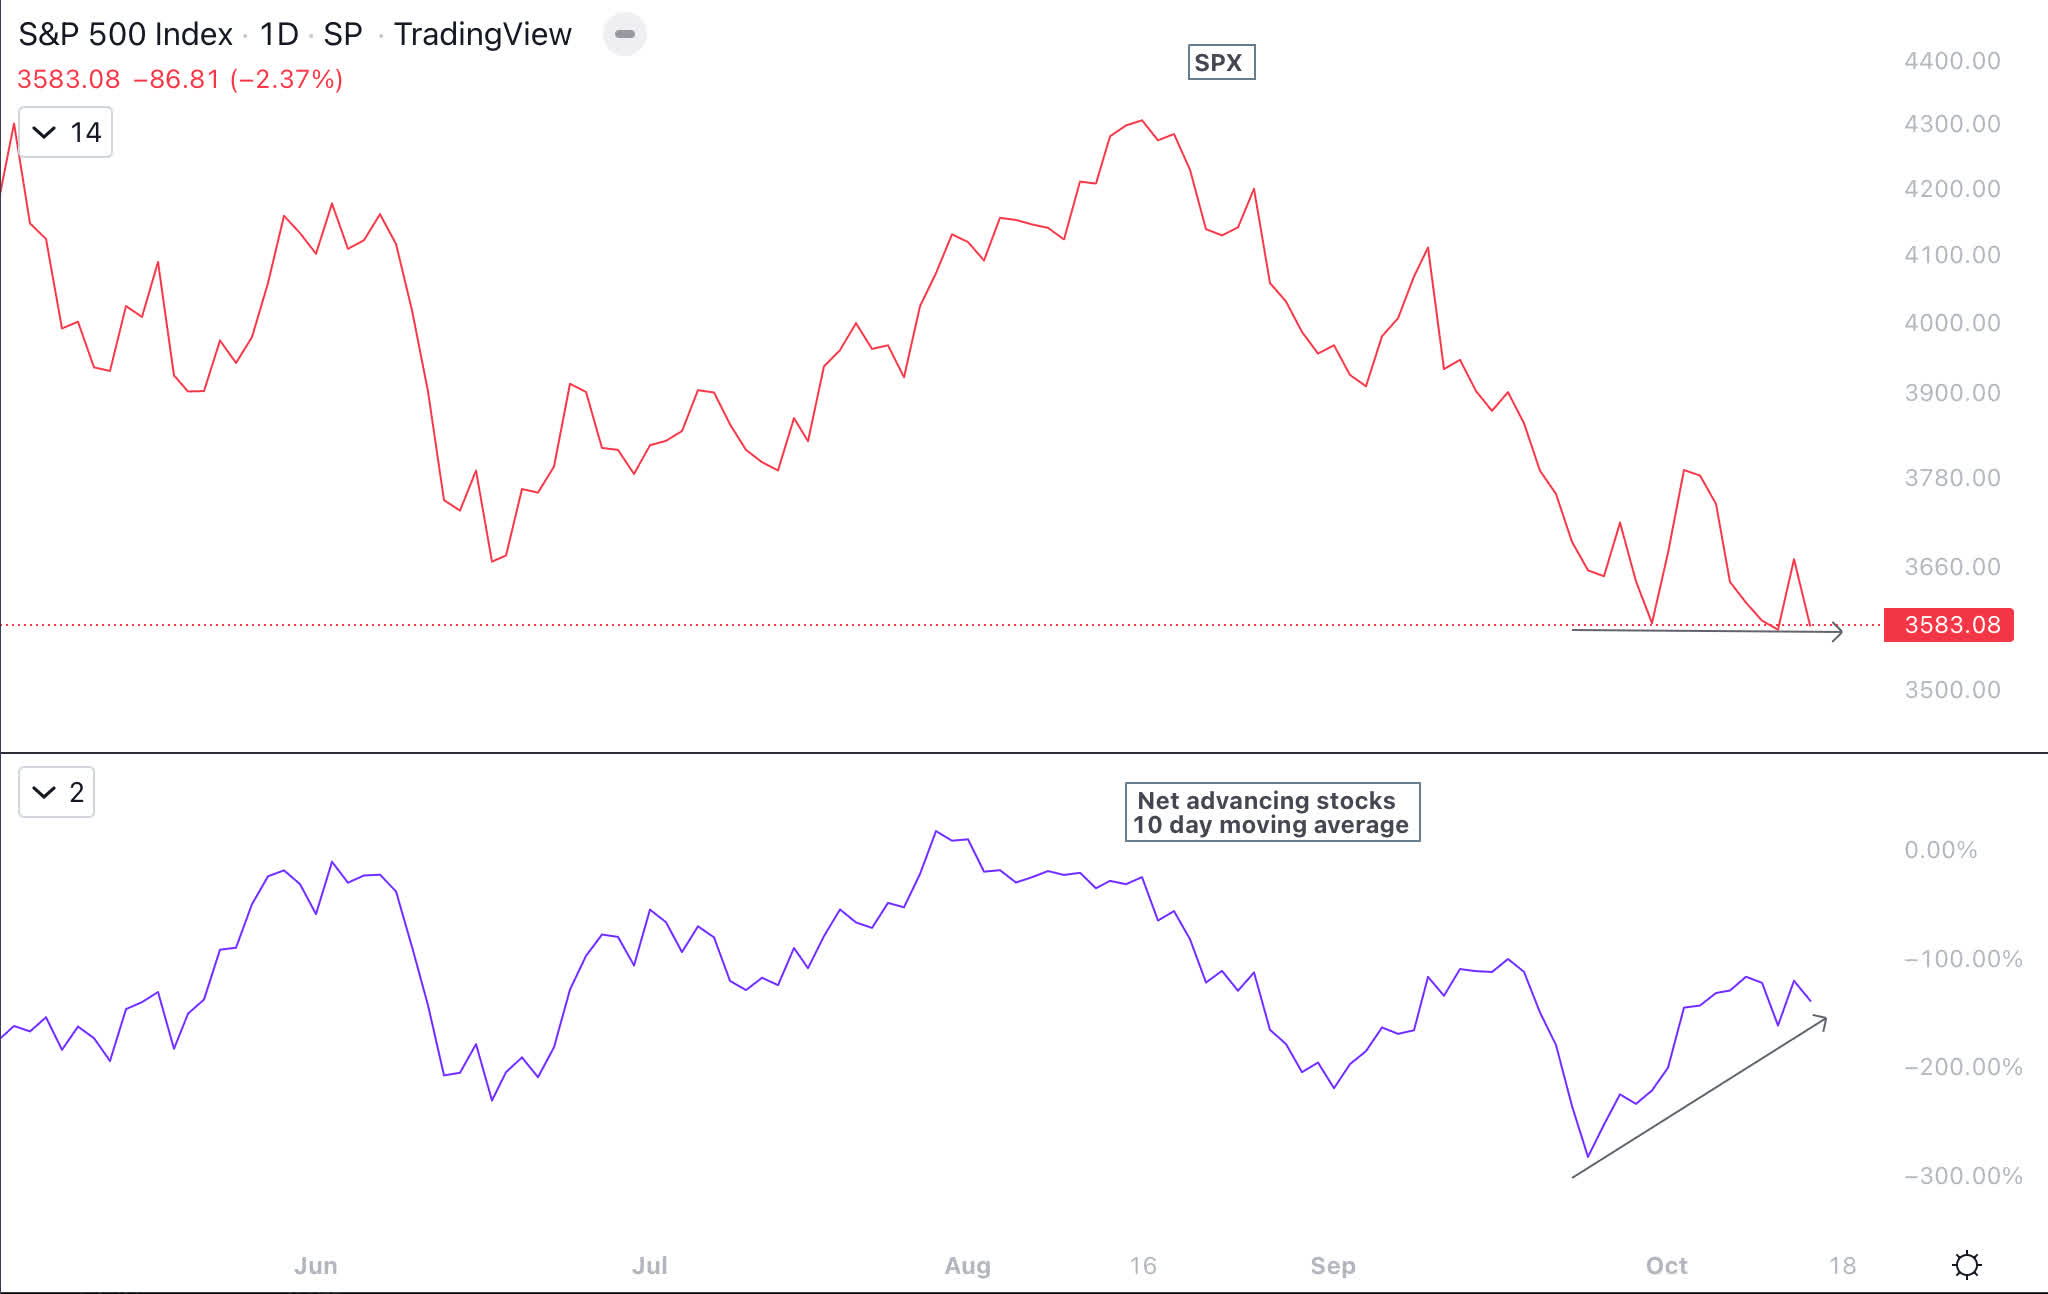
Is it possible that divergences fail? Yes, it is absolutely possible that divergences fail and equities make a new low for 2022. However, equities are in the neighborhood of new lows for the year.
Sentiment
Below are charts of sentiment as measured by AAII and NAAIM. These low sentiment readings in the past have occurred near the stock market bottom. While there are lots of good reasons for the sentiment readings to be this low, when sentiment and positioning reach such low levels then we are close to a bottom if not the bottom.
AAII Sentiment (AAII) NAAIM Sentiment (NAAIM )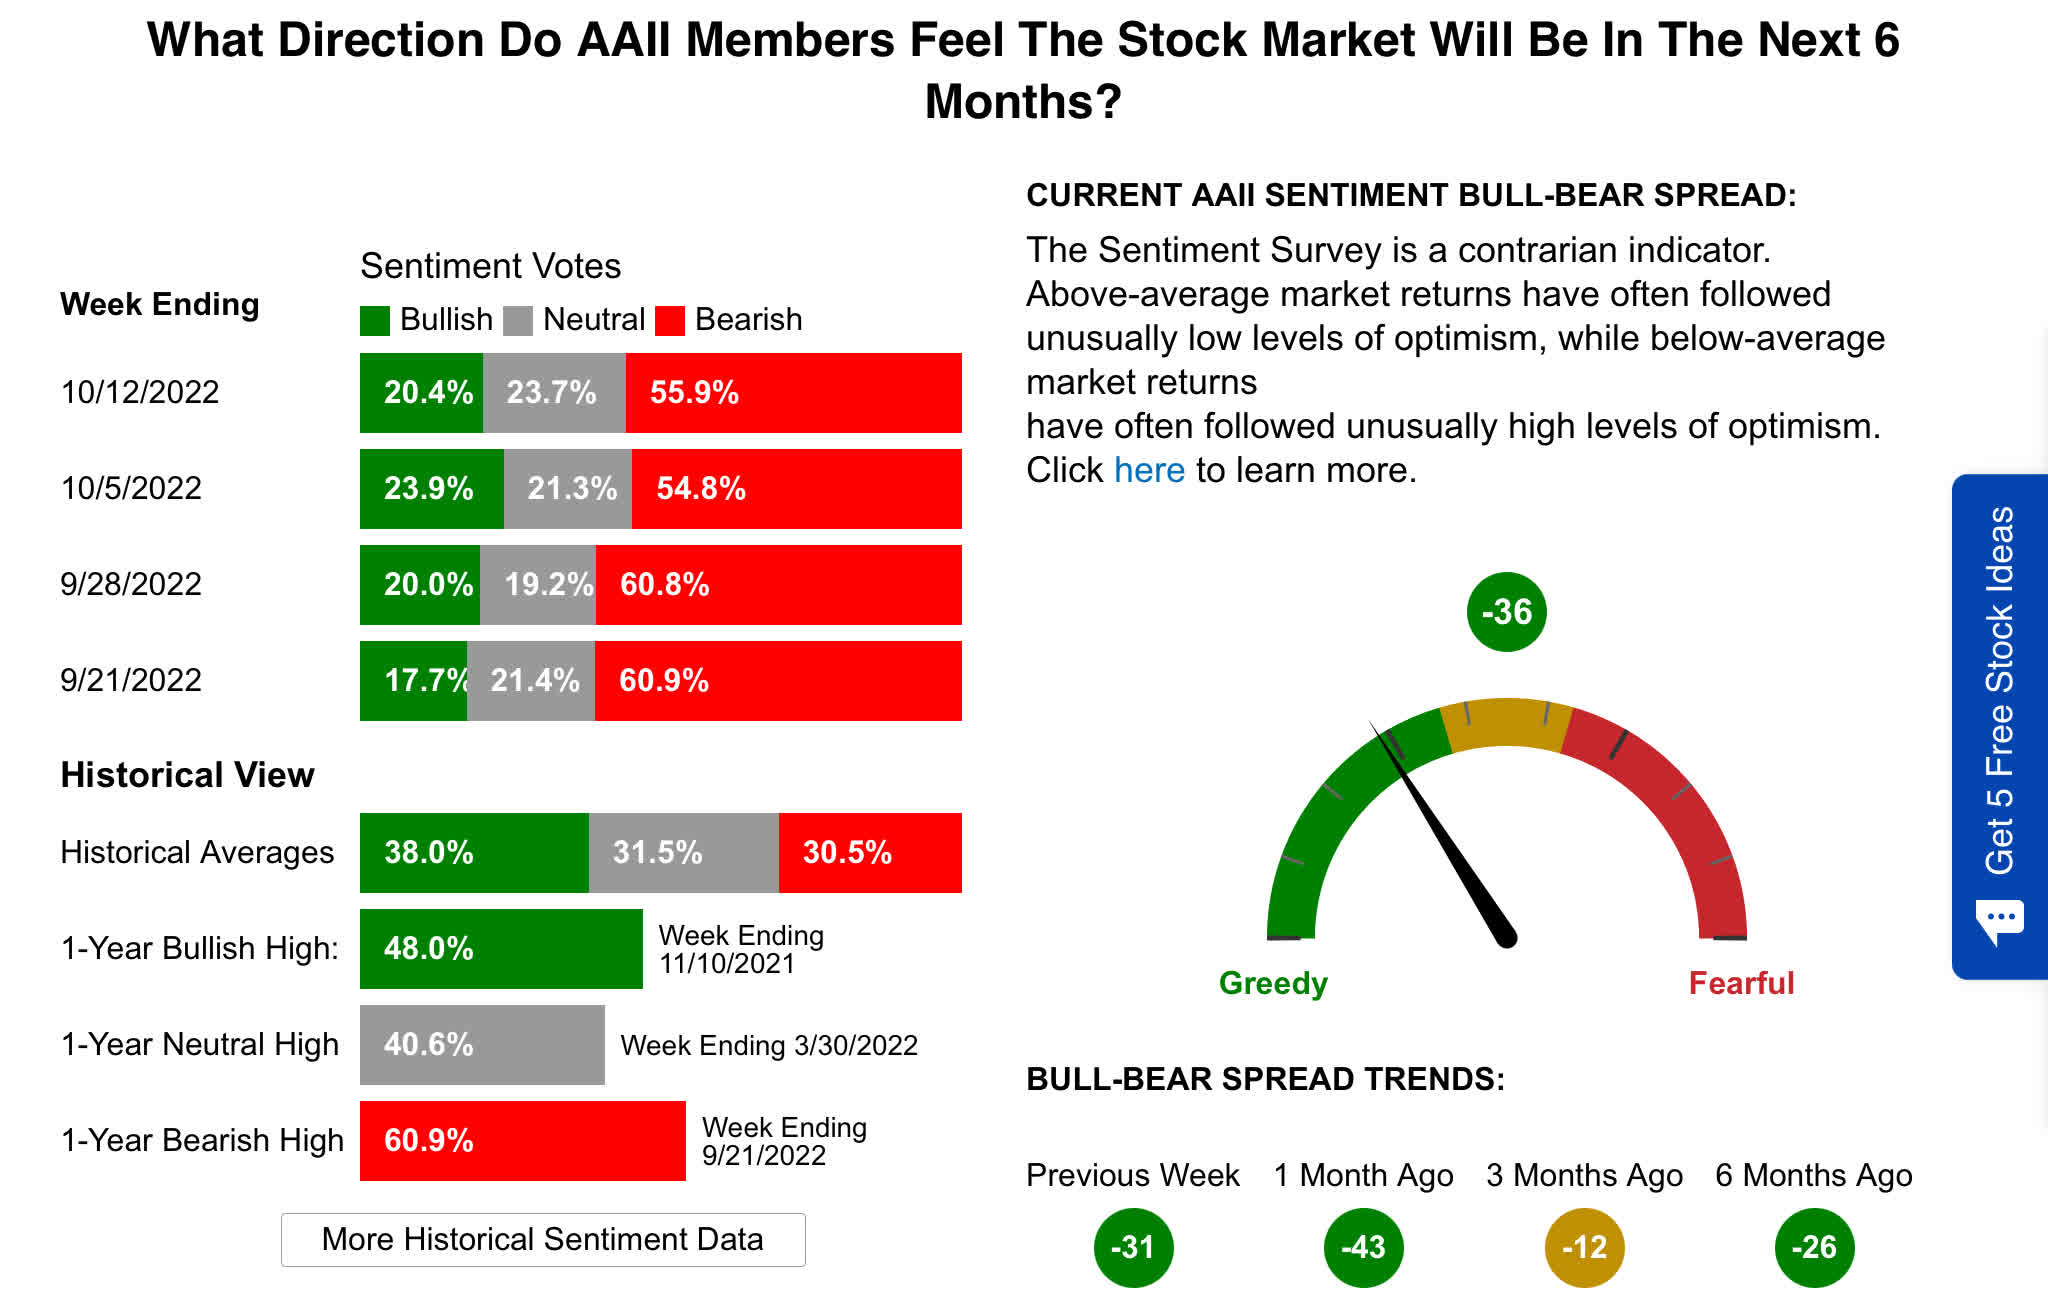
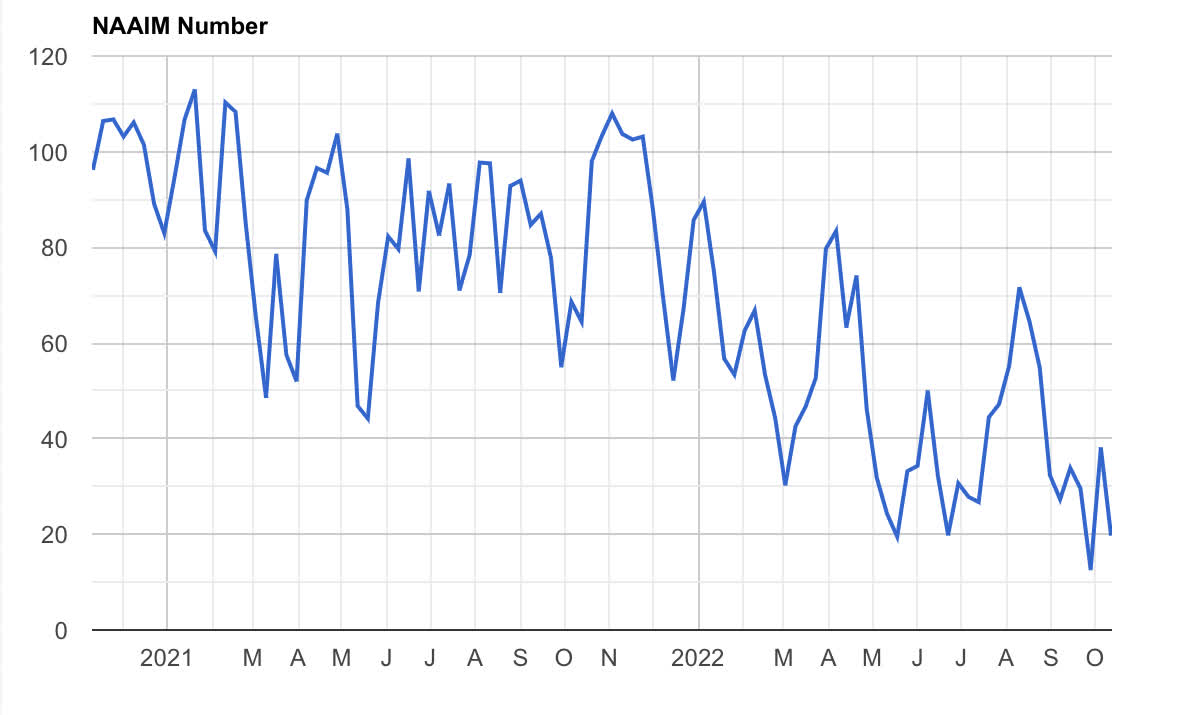
AAII & NAAIM have had series of extremely low sentiment readings recently, which have been seen near market bottoms in the past.
Don’t Fight the Fed
Unless one is nimble and uses stop loss, this is not the time to take the risk. However, if you have experience and know how to handle risk then the S&P 500 could be a short-term trade to consider for the next few weeks. Buy if the S&P 500 has a weekly close above 3550. The target is 4050-4150 with a stop loss on a weekly close below 3500. If the past few weeks made you uncomfortable holding stocks, then you should consider reducing risk on a bounce above 4050.
While there is no fool-proof way to predict the “top” or “bottom” in the stock market, when several factors come together it is possible we get an enduring bounce. The end of October to the end of December is favorable for equities, especially in a mid-term election year. Stocks over time are a decent hedge against inflation. So would it be prudent to put some cash to work for the long term? For me, the answer is “yes”.
However, “Don’t fight the Fed” due to inflation, higher interest rates, conflict in Europe, COVID-related shutdown in China, earnings growth challenge, strong US Dollar, and many more reasons. No one knows if and when the stock market reaches a bottom, but one has to weigh the risk to reward based on one’s risk tolerance.
While the news is already factored into the stock market, equities could remain in a downtrend longer than most investors can remain patient. As long as there are no new surprises, the S&P 500 is near a bottom and likely to bounce from my technical analysis perspective. Based on how the future unfolds, there could be stocks that have meaningfully come down to levels that make them a great time to own if one has more than a decade before needing those funds.
Be the first to comment