

Torsten Asmus
Thesis
EOG Resources, Inc. (NYSE:EOG) stock recovered remarkably from its July lows before it met stiff resistance at its August highs. Our analysis suggests that it would be challenging for EOG to revisit its June highs as WTI crude (CL1:COM) continues to struggle for momentum as it nears its August lows. Therefore, we surmise that EOG leveraged the momentum surge in Henry Hub natural gas (NG1:COM) prices in July.
However, the buying momentum in natural gas futures has stalled since August, despite Russia shutting down the gas pipeline to Europe “indefinitely.” Therefore, we deduce that the price action in natural gas futures corroborates our thesis of a steeper fall ahead, which could impact the upward momentum of EOG further.
Furthermore, EOG’s underlying metrics suggest that its growth could normalize moving ahead, as it laps challenging comps from FY22. Therefore, we postulate that the buying upside in EOG could face significant headwinds as the market parses the impact of demand destruction, counteracted by the tight supply/demand dynamics in the underlying market.
Therefore, we deduce the reward-to-risk profile seems skewed toward the downside moving forward. Given the significant run-up for EOG over the past year, we think it’s appropriate for investors to capitalize on its recent rally to cut exposure and start layering out.
Accordingly, we rate EOG as a Sell.
OPEC+ Hawkish Commentary And Russia’s Suspension Of Gas Flows Didn’t Spook The Market
The recent hawkish commentary by OPEC+ led to a nominal production cut of 100K barrels per day from next month. However, neither the hawkish commentary nor its production cut was followed through decisively in the market, as WTI remains well entrenched close to its August lows. Therefore, we surmise that the market remains concerned about the potential for demand destruction, given increased recessionary fears, leading to a further fall in energy prices.
WTI crude futures price chart (weekly) (TradingView)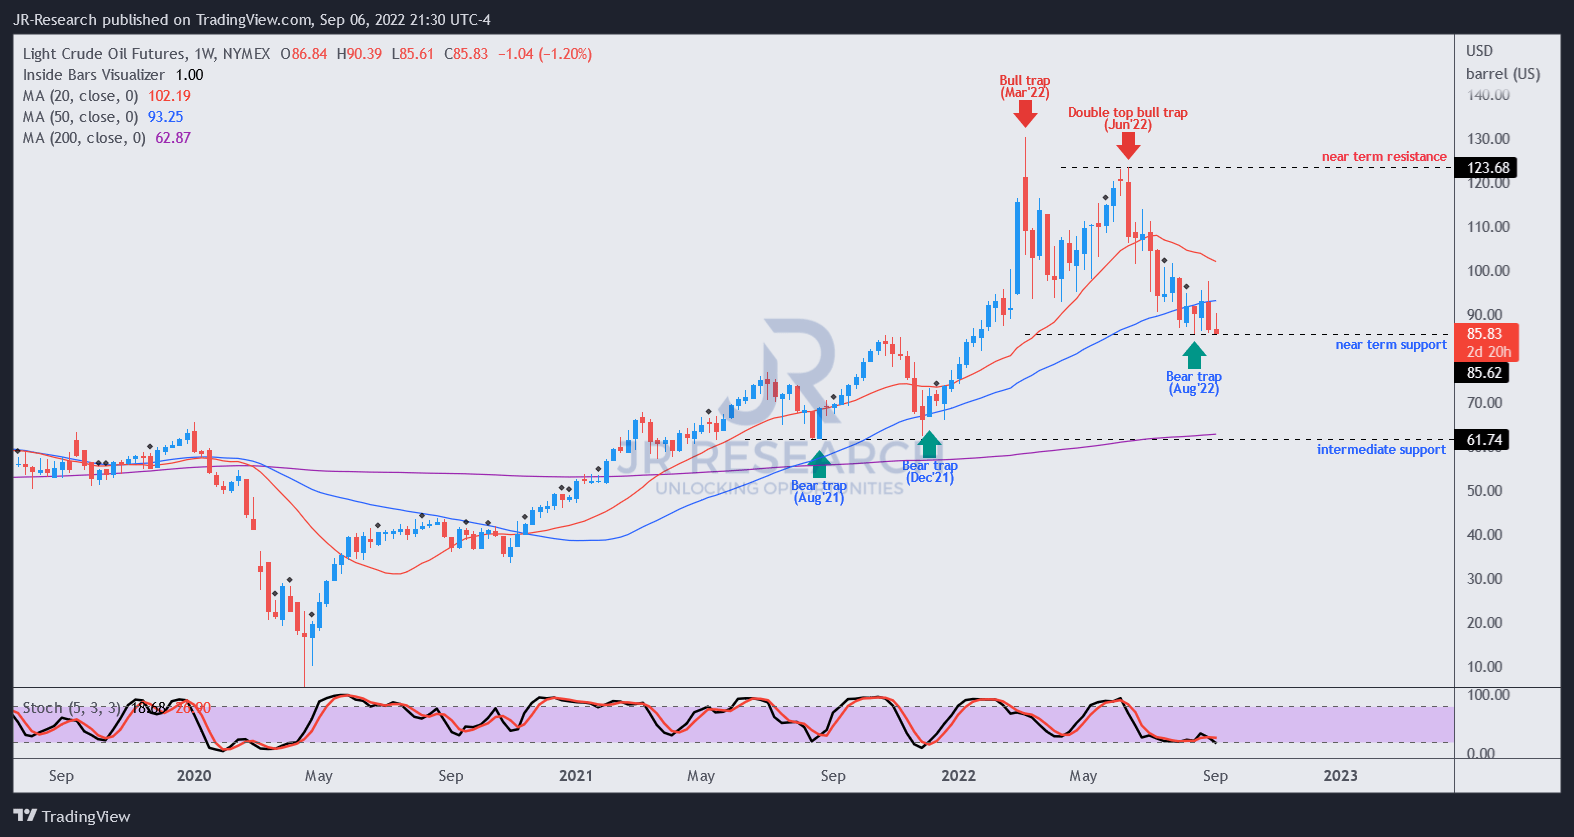
As seen above, WTI crude has attempted to form a sustained bottom predicated on the $85 support zone since it gave up all its gains from the start of the Russia-Ukraine conflict. At the same time, we observed a bear trap (indicating the market denied further selling downside decisively) in mid-August. However, buying momentum has yet to return to the market to lift WTI crude from its critical support zone. While still early, a decisive breach below its current support zone could portend a steeper fall.
Russia has also refused to resume its Nord Stream gas flows following maintenance checks. Putin is seeking the relief of western sanctions imposed on Russia as he pulls another lever, heading into winter.
Natural gas futures price chart (weekly) (TradingView)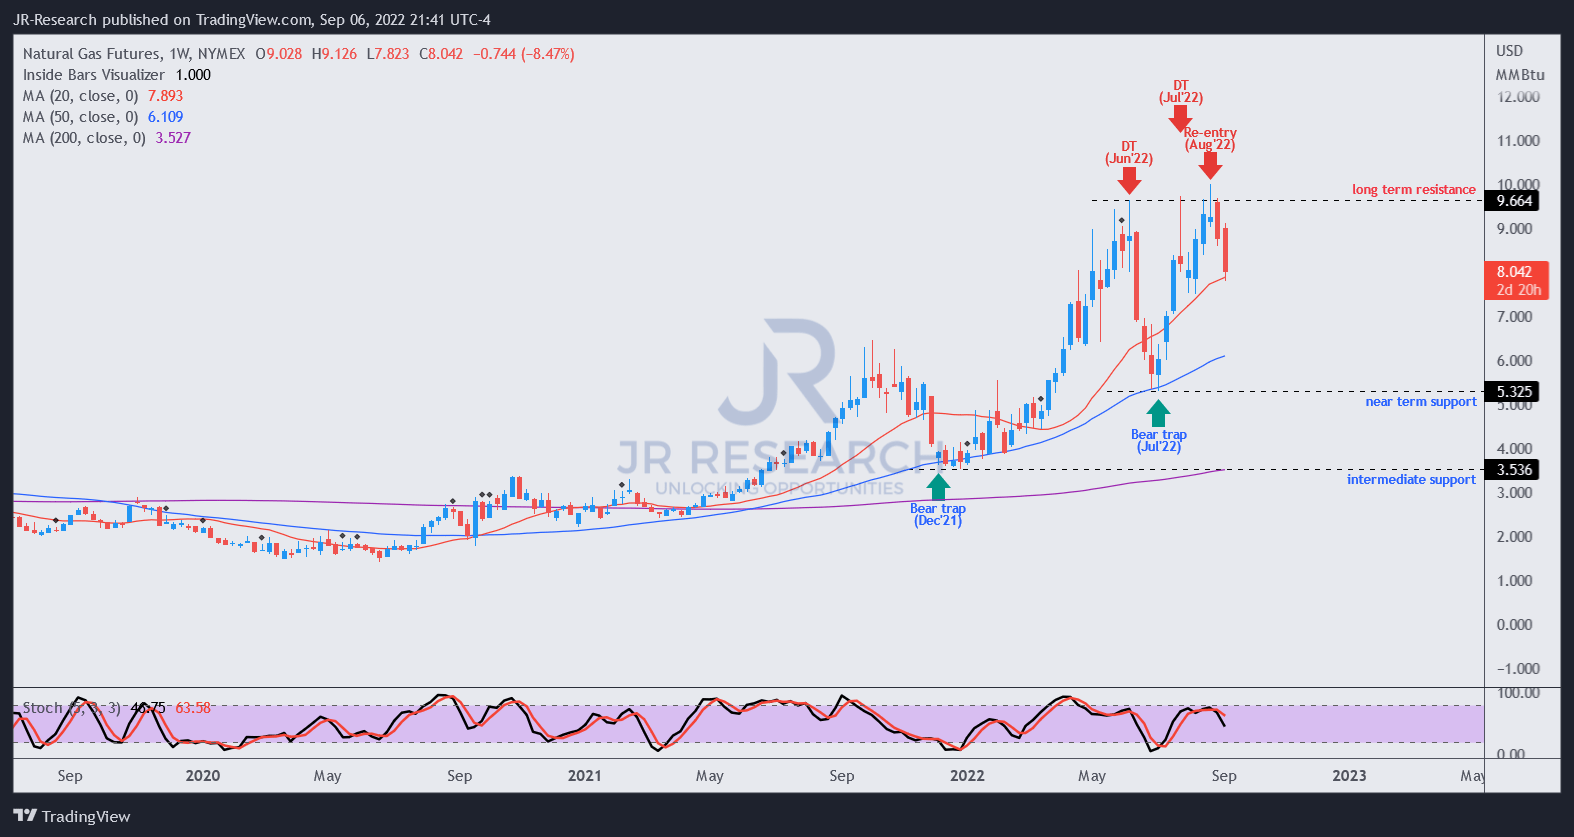
While Henry Hub futures saw an initial rally, the momentum failed to follow through. As seen above, NG1 has continued to see intense selling pressure at its long-term resistance as further buying upside continues to fail.
Therefore, we deduce that the market has been satisfied with Europe’s ability to build up its gas reserves ahead of schedule and expect the potential demand destruction from the looming recession to ease up the natural gas market. We are confident that NG1 has significant potential to fall further, given the price structure and its previous rapid run-up. The market drew overly-optimistic momentum buyers astutely into its long-term resistance.
EOG’s Growth Momentum Could Slow Further
EOG highlighted in its Q2 earnings release that it would be hedging less than its regular cadence. Therefore, it appears that management is confident of the underlying markets sustaining their bullish bias, as CEO Ezra Yacob accentuated: “Going forward, we expect to hedge significantly less than the 20% to 30% of volumes we typically hedge in prior years.”
EOG average price for crude and condensate change % (Company filings)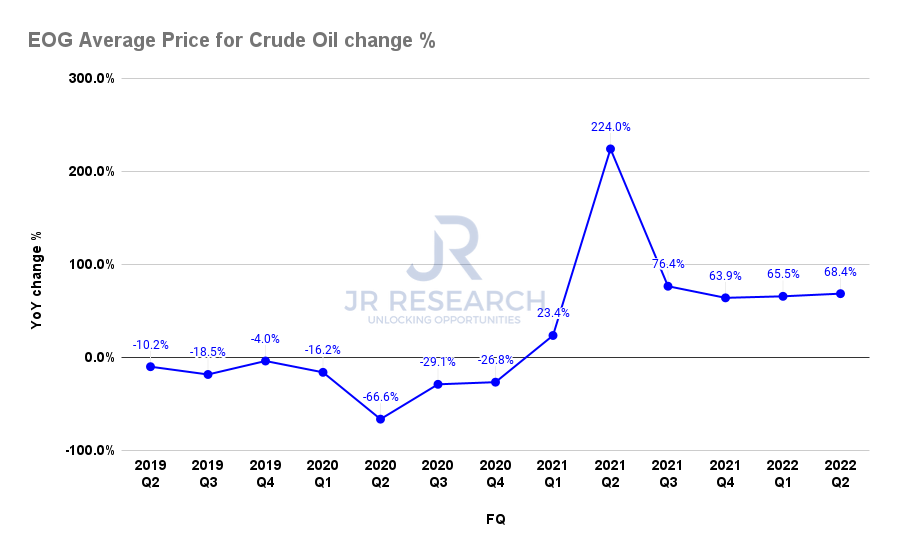
However, investors should note that the WTI crude has fallen well below the benchmark price that EOG registered in Q1’22 ($94.38) and Q2’22 ($108.42). Therefore, we believe that EOG would be unable to sustain the growth momentum for its average price, and its growth could start to trend down from Q3. As a result, we expect the headwinds in the underlying market to pressure further buying momentum in EOG’s upward bias.
EOG revenue change % and adjusted EPS change % consensus estimates (S&P Cap IQ)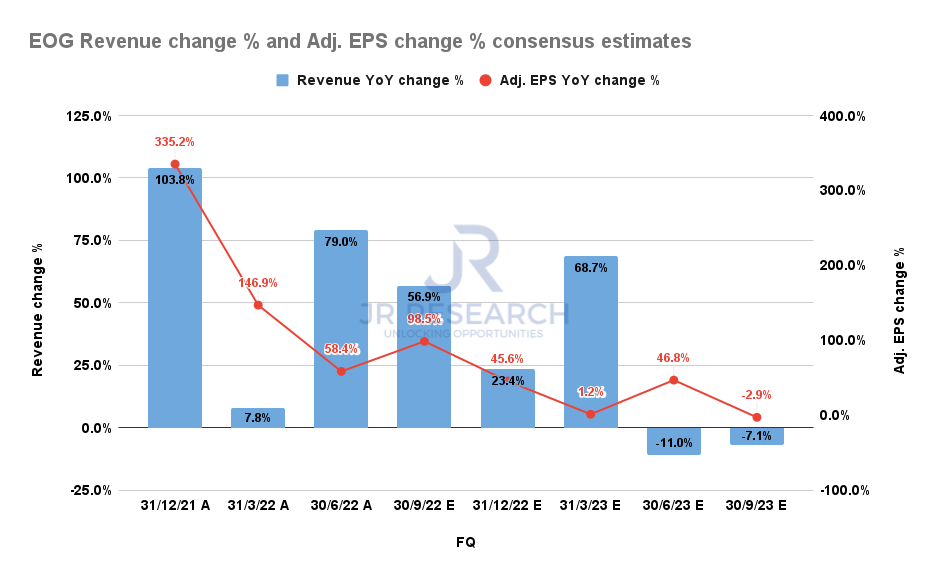
Even the consensus estimates (bullish) are not confident that EOG could sustain its revenue and adjusted EPS growth rates through FY23, seeing further moderation ahead. Hence, we urge investors to assess whether the run-up seen in EOG over the past year has reached its peak, as the market is forward-looking.
Is EOG Stock A Buy, Sell, Or Hold?
EOG price chart (weekly) (TradingView)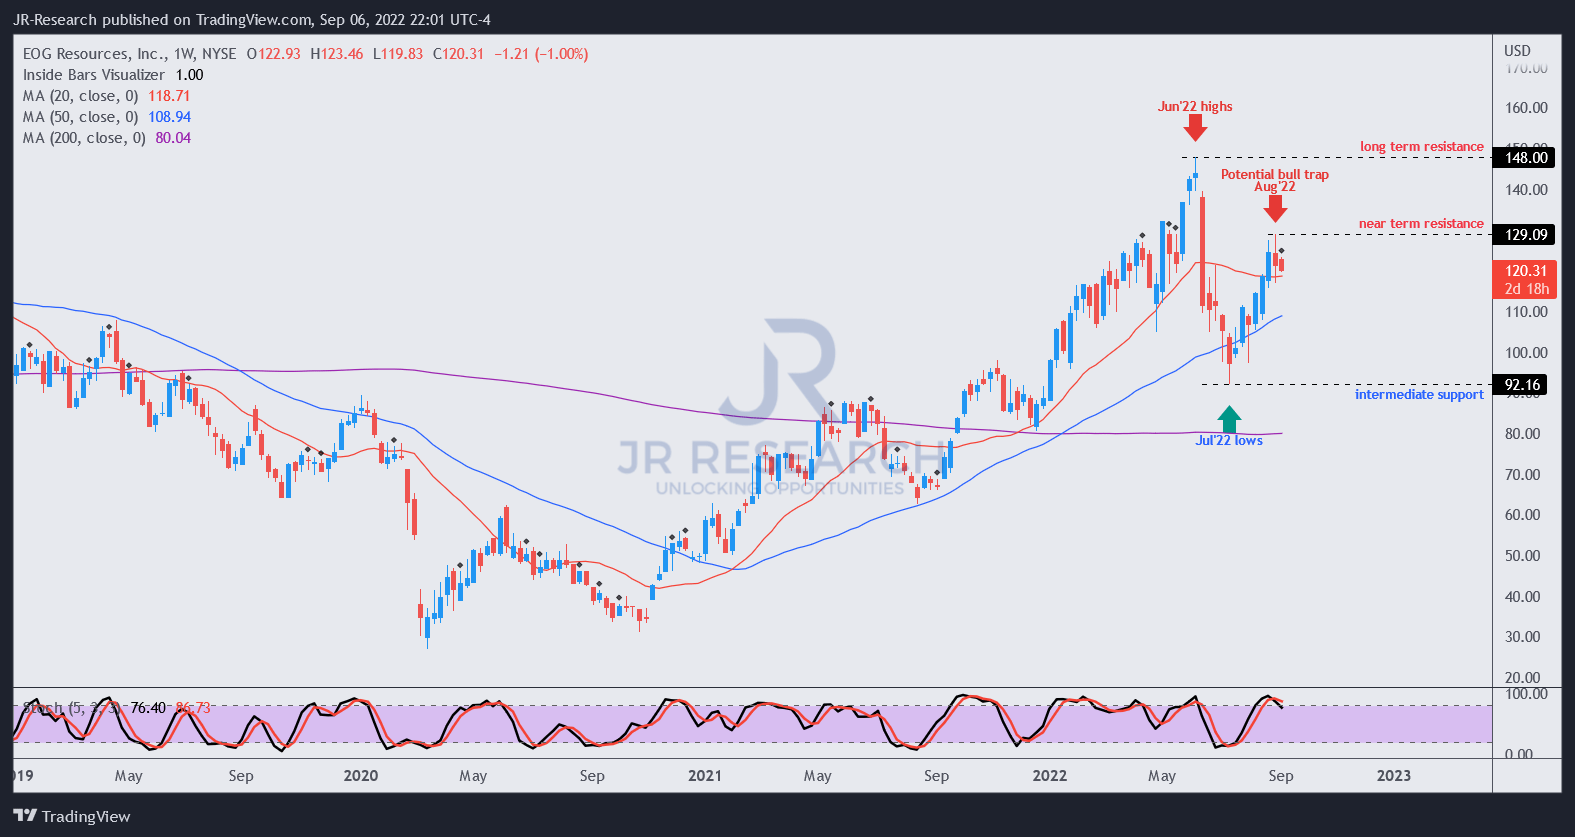
EOG has failed to sustain its buying upside above its June highs, as its upward momentum stalled in August. Therefore, it formed a lower-high price structure, which could be an early warning signal that EOG might have significant trouble breaking into a higher high than June’s levels.
The potential bull trap (indicating the market denied further buying upside decisively) in August has continued to stall EOG’s bullish bias. The market drew in buyers rapidly from July’s recovery.
Coupled with the weakness in its underlying markets, increasingly challenging comps through FY23, and the EOG’s unconstructive price action, we believe it’s appropriate for investors to leverage the recent recovery to consider cutting exposure.
Consequently, we rate EOG as a Sell.
Be the first to comment