

dszc
Part I – Introduction
Houston-based EOG Resources, Inc. (NYSE:EOG) released its third quarter 2022 results on November 3, 2022.
Important note: This article is an update of my preceding article, published on September 7, 2022. I have followed EOG on Seeking Alpha since 2016, with 26 articles published and counting.
EOG Resources produces from five Premium Basins and is a pure-play U.S. producer with a small production from Trinidad.
EOG Map Assets presentation (EOG Presentation)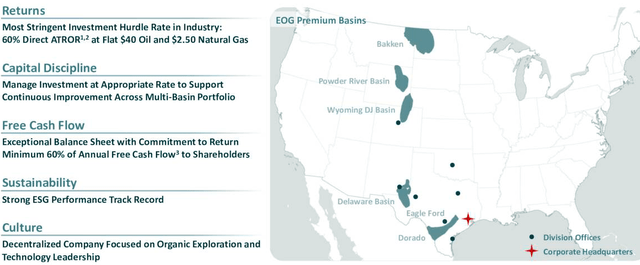
One characteristic of EOG Resources is the shift to double-premium wells, increasing profit margin, higher cash flow, and faster payback on investment.
EOG Shift to double premium well (EOG Presentation)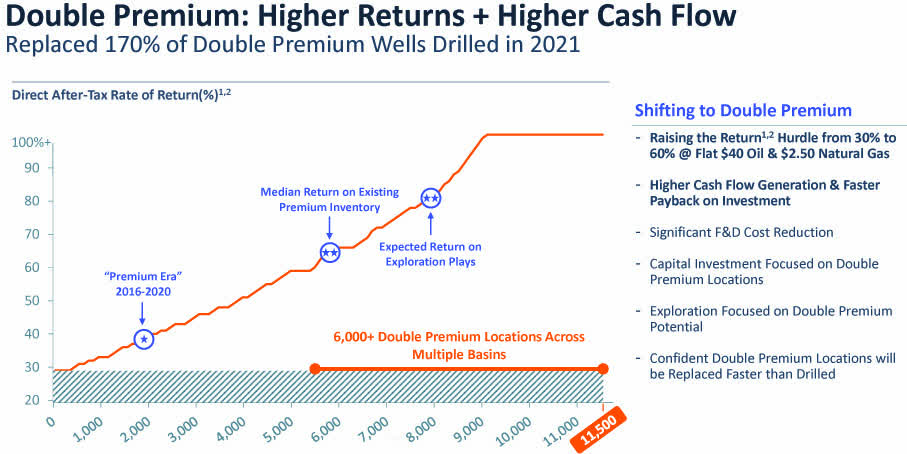
1 – 3Q22 Results Snapshot And Commentary
EOG Resources reported a third-quarter 2021 adjusted earnings per share of $3.71, missing analysts’ expectations. However, results significantly rebounded from the year-ago quarter’s earnings of $2.16 per share.
EOG 3Q22 Highlights (EOG 3Q22 Highlights)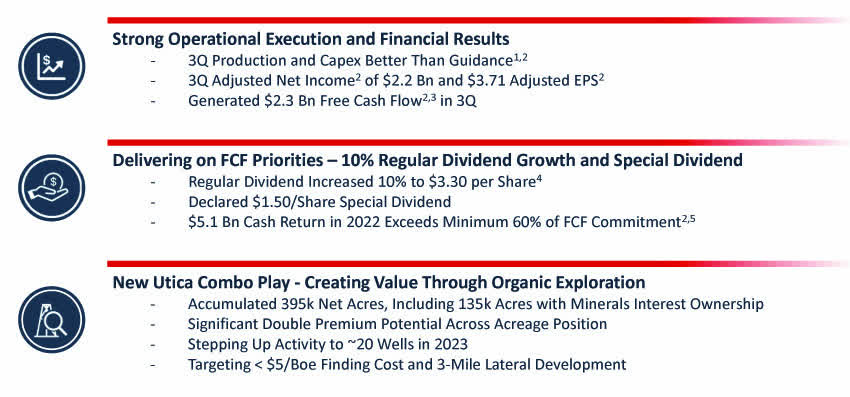
The total quarterly revenues rose to $7,593 million from the year-ago number of $4,765 million.
Lower-than-expected earnings were due to higher leases, well expenses, and transportation costs, even if the adverse effects were partially offset by higher oil equivalent production and commodity prices.
Now, the best part. EOG Resources announced a special dividend of $1.50 per share in 3Q22 and increased the regular dividend to $0.825 per share.
The total dividend for 3Q22 is $2.325 per share, or an increase of 3.3% sequentially. The forward dividend yield is 6.4%, and annualized dividend is now at $3.30 per share. The dividend payment is a strong incentive for savvy investors interested in a steady stream of dividends supported by a reliable oil company.
EOG Dividend comparison (EOG Presentation)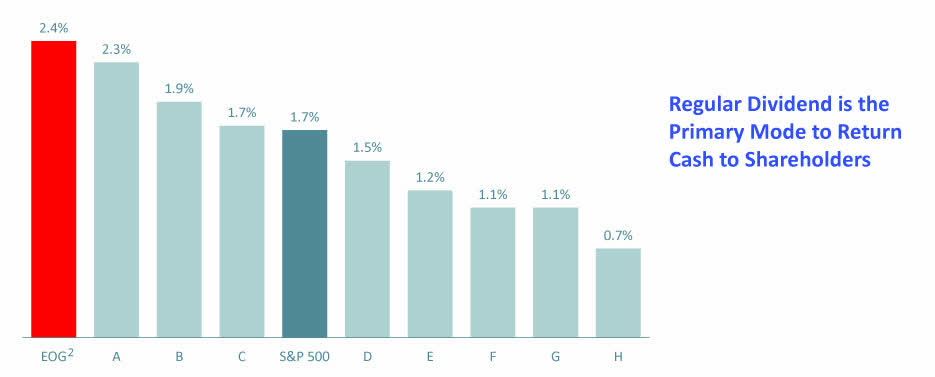
CFO Tim Diggers said in the conference call:
We are very pleased to increase the regular dividend by 10% to $3.30 per share annual rate. This increase reflects two things. First, the improvements we’ve made to the cost structure. Efficiencies and technology continue to sustainably improve EOG’s capital efficiency. Furthermore, we expect the advantages of operating in multiple basins will drive additional improvements to EOG’s cost structure and returns in the year ahead, lower the cost of supply and lower the breakeven oil price to fund the dividend.
EOG Resources’ total production volumes increased 8.9% yearly to 84.6 million barrels of oil equivalent (MMBoe) on higher U.S. output.
The quarter’s crude oil and condensate production totaled 465.1K Boep/d, up 3.5% from the year-ago level. Natural gas liquids volumes increased 32.6% yearly to 209.3K Bbls/d. Natural gas volume rose to 248K Boep/d from the year-earlier quarter’s 237.0K Boep/d.
EOG Production details Oil, NGL, and NG in 3Q22 (Fun Trading) CEO Ezra Yacob said on the conference call: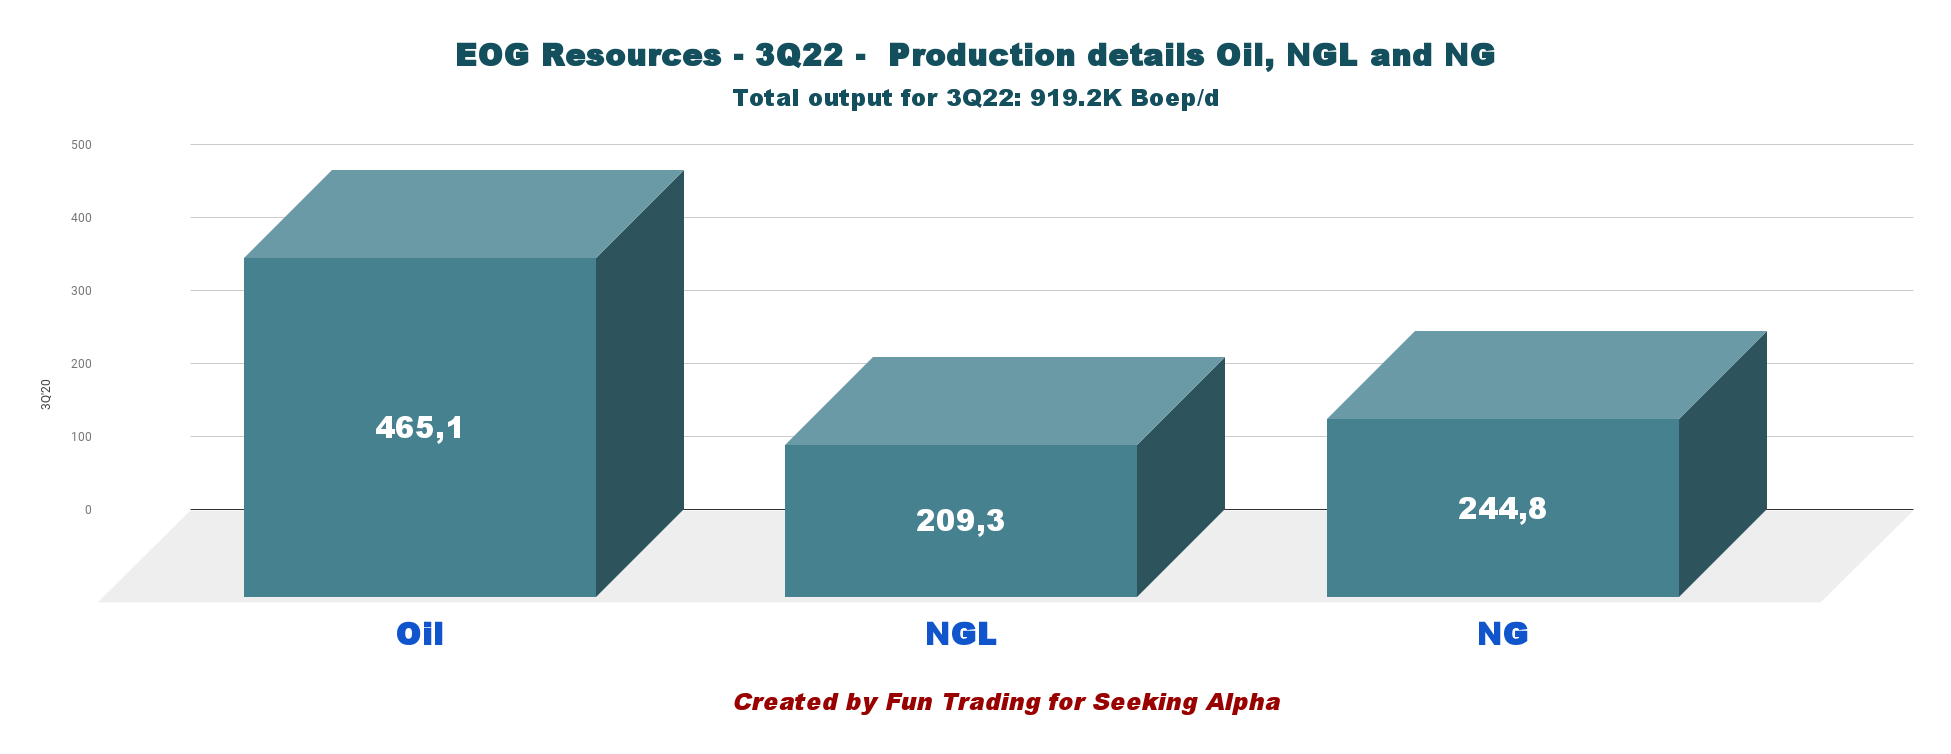
The quality of EOG’s diverse multi-basin portfolio of high-return assets continues to grow and improve. Yesterday’s announcement of the large position we captured in the Utica Combo play demonstrates yet again that EOG’s robust exploration pipeline delivers results. Over the last two years, our organic exploration efforts have brought forth Dorado, our premium dry natural gas play in South Texas, the emerging Northern Powder River Basin oil play in Wyoming and now the emerging Utica Combo play in Ohio.
2 – Investment Thesis
EOG Resources is one of the most trustworthy “shale” producers with the best friendly attitude towards its shareholders. The total dividend for 3Q22 is now $2.325, or a forward dividend yield of 6.3%. Another critical element is that the dividend has never been suspended and is among the highest in the oil industry.
Thus, I continue to recommend a long-term investment, even if the risk of a recession in 2023 may adversely affect the oil industry.
The market rallied last week with the recent CPI announcement – a little lower than expected at 7.7%. However, Jerome Powell has been very clear, and I believe the FED will hike interest by another 75-point on December 14.
Thus, trading LIFO using technical analysis is the only viable strategy that can provide a decent long-term reward while reducing the risks.
It allows you to profit from the short-term swings and increase your leverage during unfavorable or unexpected turnarounds that can last longer than expected. This dual strategy is what I am recommending and constitutes the backbone of my Gold and Oil marketplace.
3 – Stock Performance
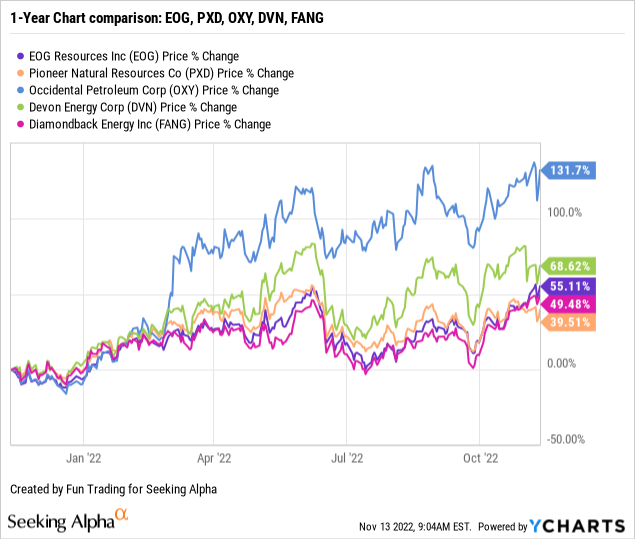
All five companies in the chart below have sharply increased year to date, with Occidental Petroleum Corporation (OXY) up 132% yearly, while EOG shows an increase more “modest” of 55%.
EOG Resources produces oil and gas from its U.S. shale assets, representing 97% of the total output in 3Q22. The production from the U.S. comes from five basins: Bakken, Powder River, Wyoming DJ, Delaware, and Eagle Ford (including the dry gas play Dorado).
EOG Production per Segment 3Q22 (Fun Trading) Production in the USA was up 10.4% from the same quarter a year ago.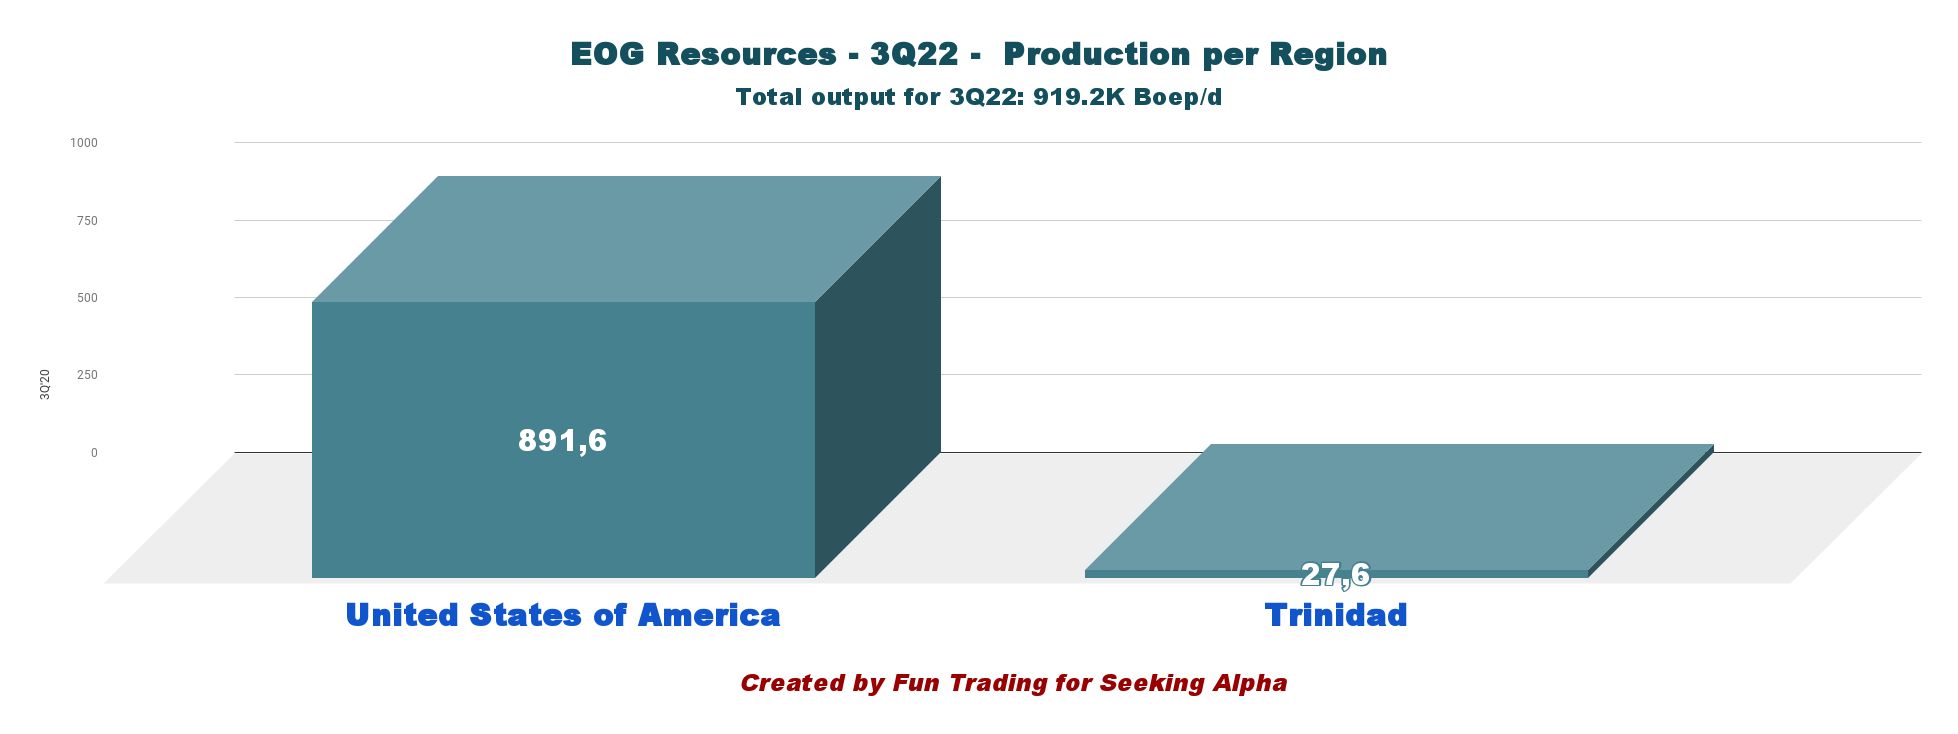
| Production per Region in K Boep/d | 3Q21 | 4Q21 | 1Q22 | 2Q22 | 3Q22 |
| United States of America | 807.9 | 827.8 | 841.5 | 886.1 | 891.6 |
| Trinidad | 36.5 | 35.3 | 41.8 | 34.6 | 27.6 |
| TOTAL | 844.4 | 863.1 | 883.3 | 920.7 | 919.2 |
Part II – EOG Resources – 3Q22 Balance Sheet: The Raw Numbers
| EOG Resources | 3Q21 | 4Q21 | 1Q22 | 2Q22 | 3Q22 |
| Total Revenues in $ million | 4,765 | 5,908 | 6,755 | 8,645 | 7,598 |
| Oil Revenues in $ Million | 5,231 | 6,044 | 3,983 | 7,407 | 7,593 |
| Net income in $ Million | 1,095 | 1,985 | 390 | 2,238 | 2,854 |
| EBITDA $ Million | 2,404 | 3,447 | 1,392 | 3,841 | 4,610 |
| EPS diluted in $/share | 1.88 | 3.39 | 0,67 | 3.81 | 4.86 |
| cash from operating activities in $ Million | 2,196 | 3,166 | 828 | 2,048 | 4,773 |
| Capital Expenditure in $ Million | 896 | 1,014 | 1,009 | 1,424 | 1,205 |
| Free Cash Flow in $ Million | 1,300 | 2,152 | -181 | 624 | 3,568 |
| Total cash $ Billion | 4.29 | 5.21 | 4.01 | 3.07 | 5.27 |
| Long-term debt in $ Billion | 5.12 | 5.11 | 5.10 | 5.09 | 5.08 |
| Dividend per share in $ (+ special dividend) | 0.75 | 0.75+1.00 | 0.75+1.80 | 0.75+1.70 | 0.825+1.50* |
| Shares outstanding (diluted) in Million | 584 | 585 | 586 | 588 | 587 |
Source: EOG Resources 10Q
Part III – Analysis: Revenues, Earnings Details, Net Debt, Free Cash Flow, And Oil Equivalent Production
1 – Total Revenues And Others Were a record of $7,593 Million in 3Q22
Note: Oil revenues were $7,598 million in 3Q22.
EOG Quarterly Revenues history (Fun Trading)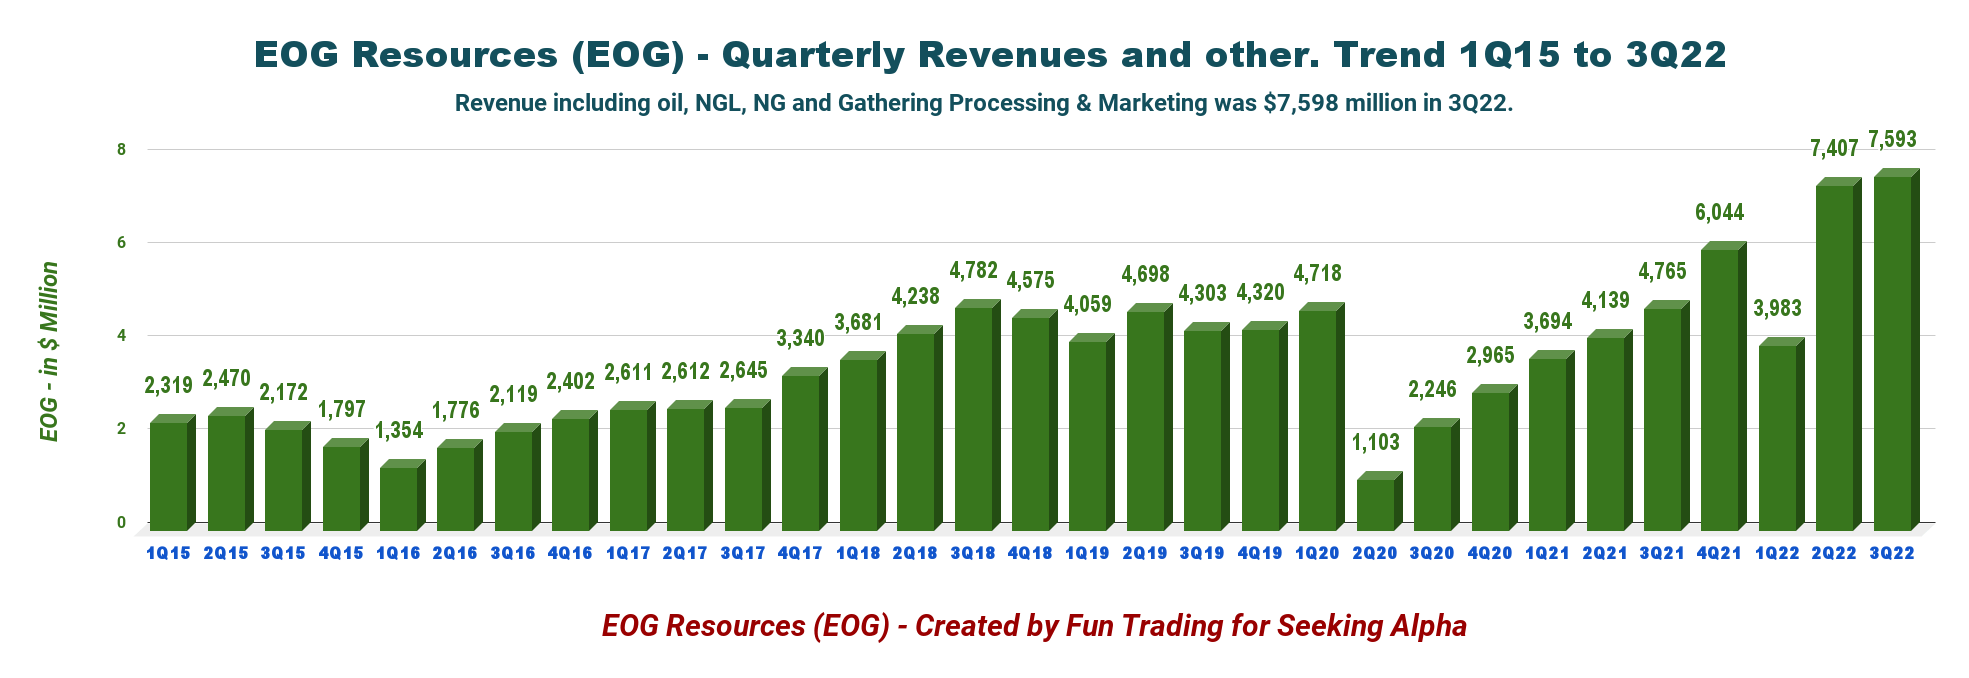
The company’s net income was $2,854 million, or earnings per share of $4.86, compared to $1,095 or $1.88 per share a year ago.
Total operating expenses for 3Q22 were $3,929 million, higher than the $3,294 million a year ago.
Transportation costs increased to $257 million from $219 million a year ago. Also, Lease and well expenses increased to $335 million from $270 million a year ago. Finally, the company reported gathering and processing costs of $167 million, higher than the year-ago quarter’s $145 million.
The earnings miss is due to higher Lease, well expenses, and transportation costs. It was partially compensated by higher oil equivalent production and commodity prices.
2 – Free Cash Flow Was $3,568 Million In 3Q22
EOG Quarterly Free cash flow history (Fun Trading)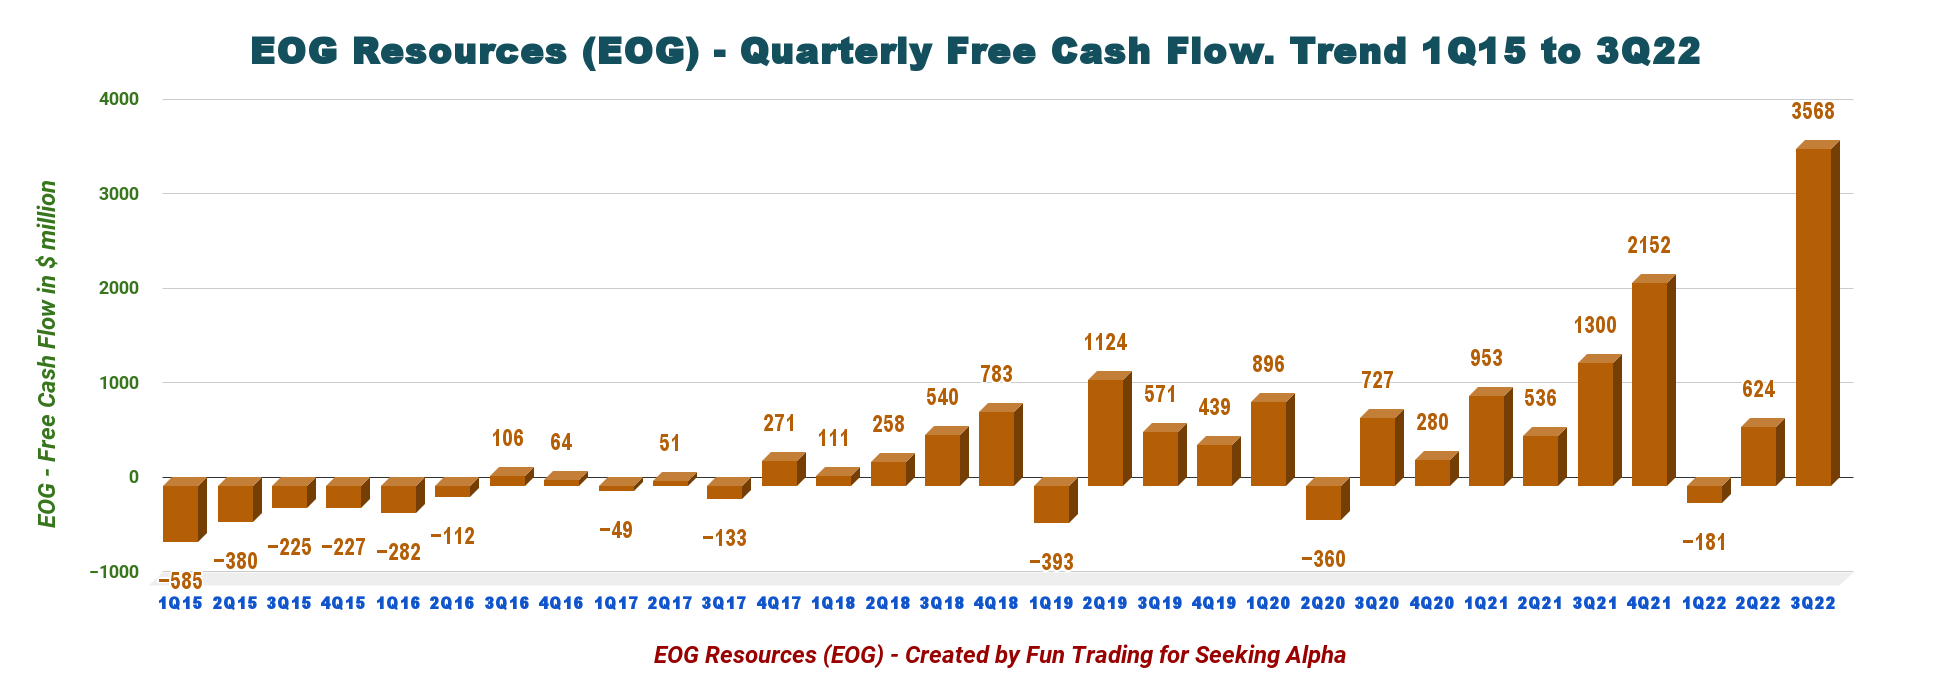
Note: The organic free cash flow is the cash from operating activities minus CapEx. EOG uses another way to calculate the generic Free cash flow, which is not comparable to other E&P companies.
The free cash flow for the third quarter of 2022 was $3.568 million, and the trailing 12-month free cash flow was $6,163 million.
The company is committed to returning a minimum of 60% of annual free cash flow, which is exceptionally generous.
EOG Dividend improvement (EOG Presentation)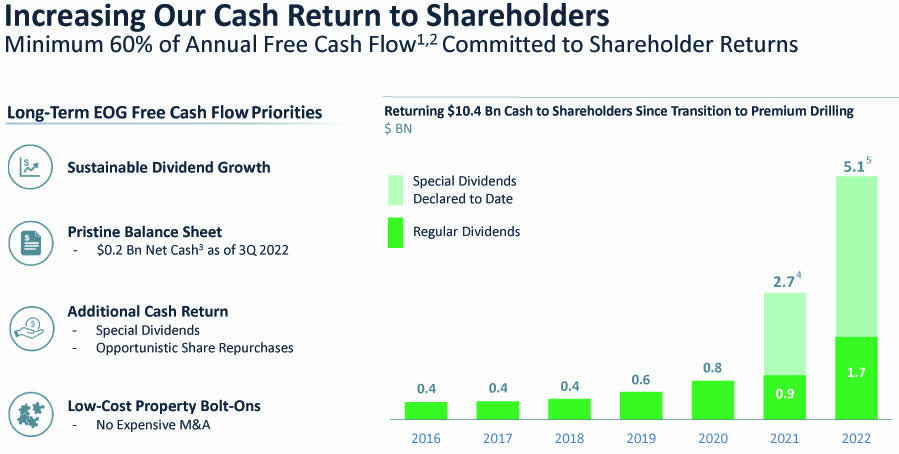
3 – Oil-Equivalent Production And Other
3.1 – Oil Equivalent Production
EOG Resources’ oil production increased sequentially in the third quarter. Total production was 919.2K Boep/d, up 8.9% from last year and down 0.2% sequentially. The chart below shows that the entire production is at near-record this quarter.
EOG Quarterly Production history (Fun Trading)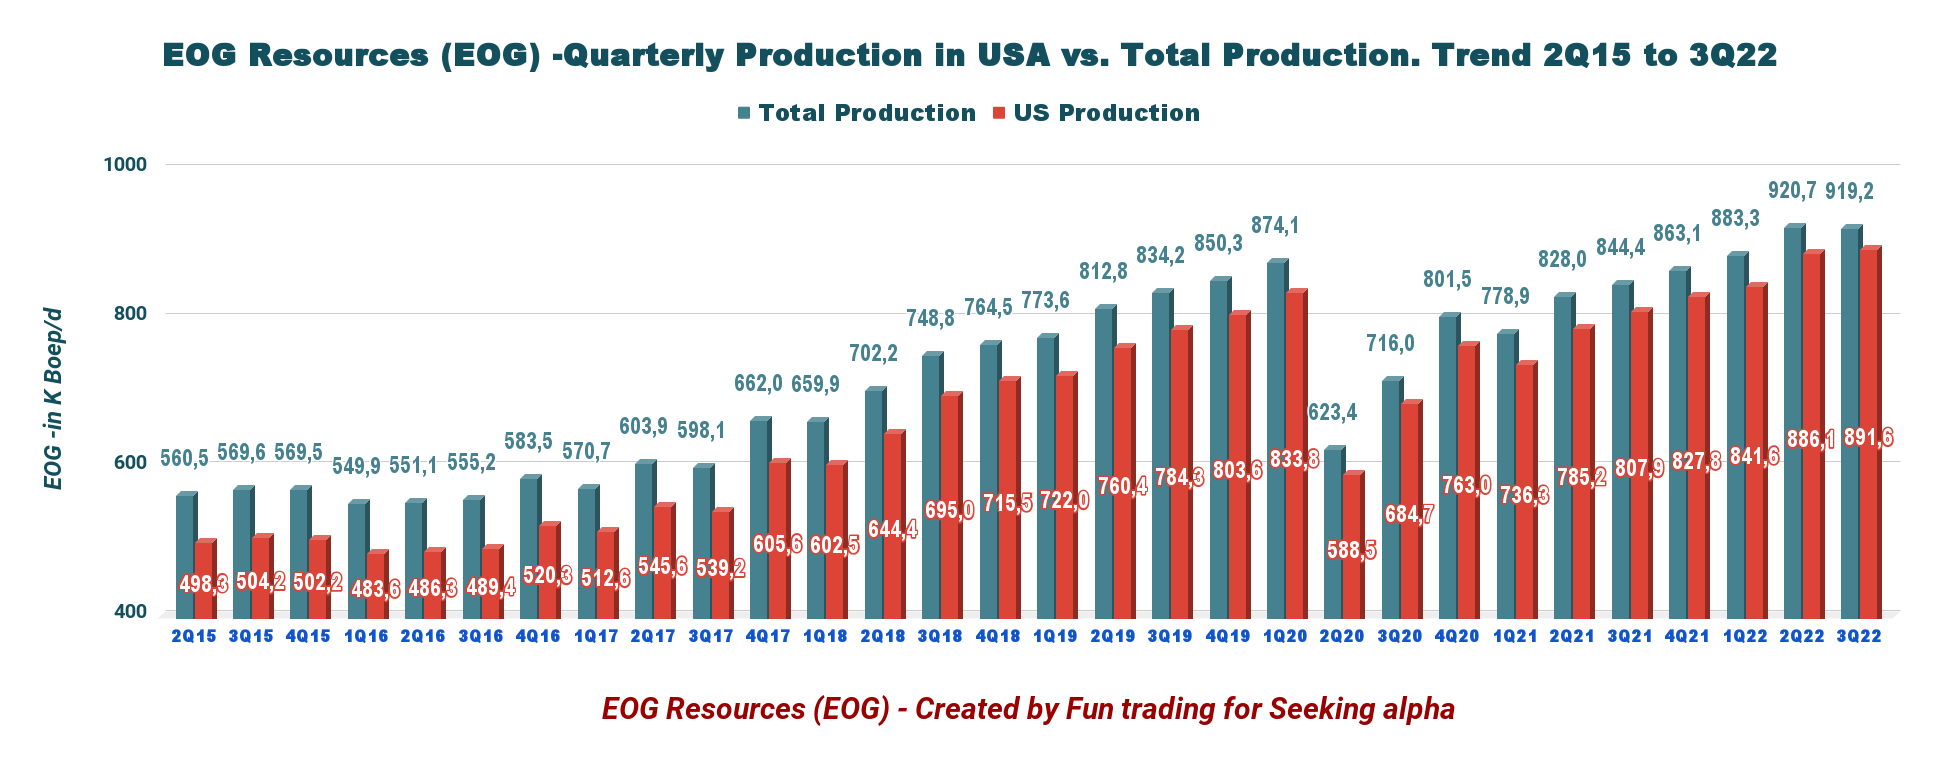
3.2 – Oil Production Detail: Oil, NGL, And NG
EOG relies significantly on crude oil, representing 50.6% of the total output in 3Q22.
EOG Quarterly production details per oil, NGL, and NG history (Fun Trading)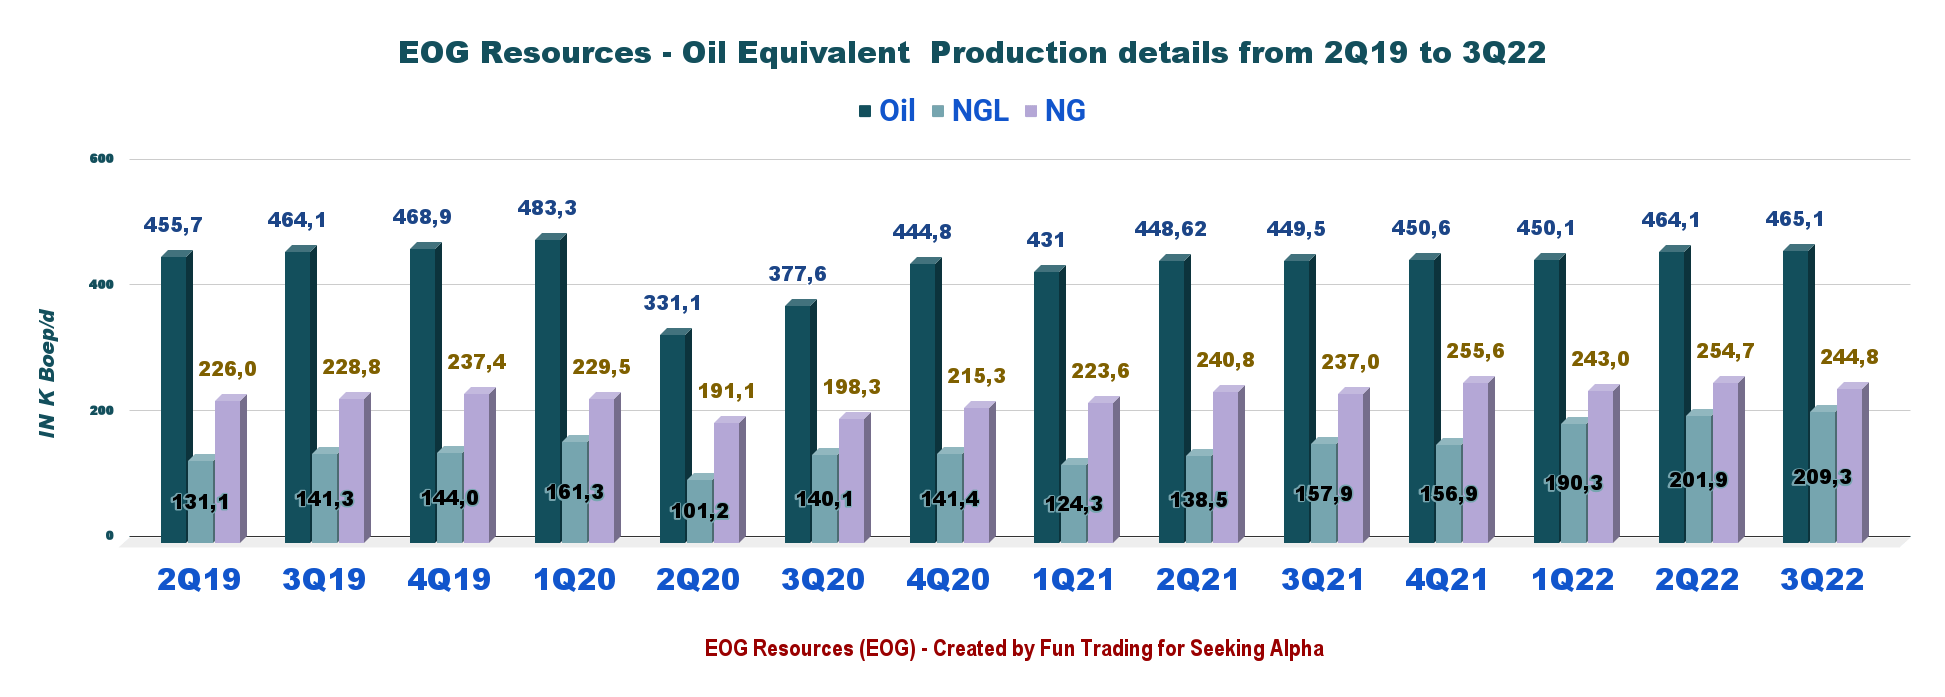
The company’s oil price (composite) realized this quarter was a whopping $96.04 a barrel, up from $70.85 a year ago.
In addition, natural gas fetched $9.14 per Mcf. Finally, NGL prices were $36.02 per barrel.
Below is the chart history of the Oil and NG price composite.
EOG Quarterly oil and gas price history (Fun Trading)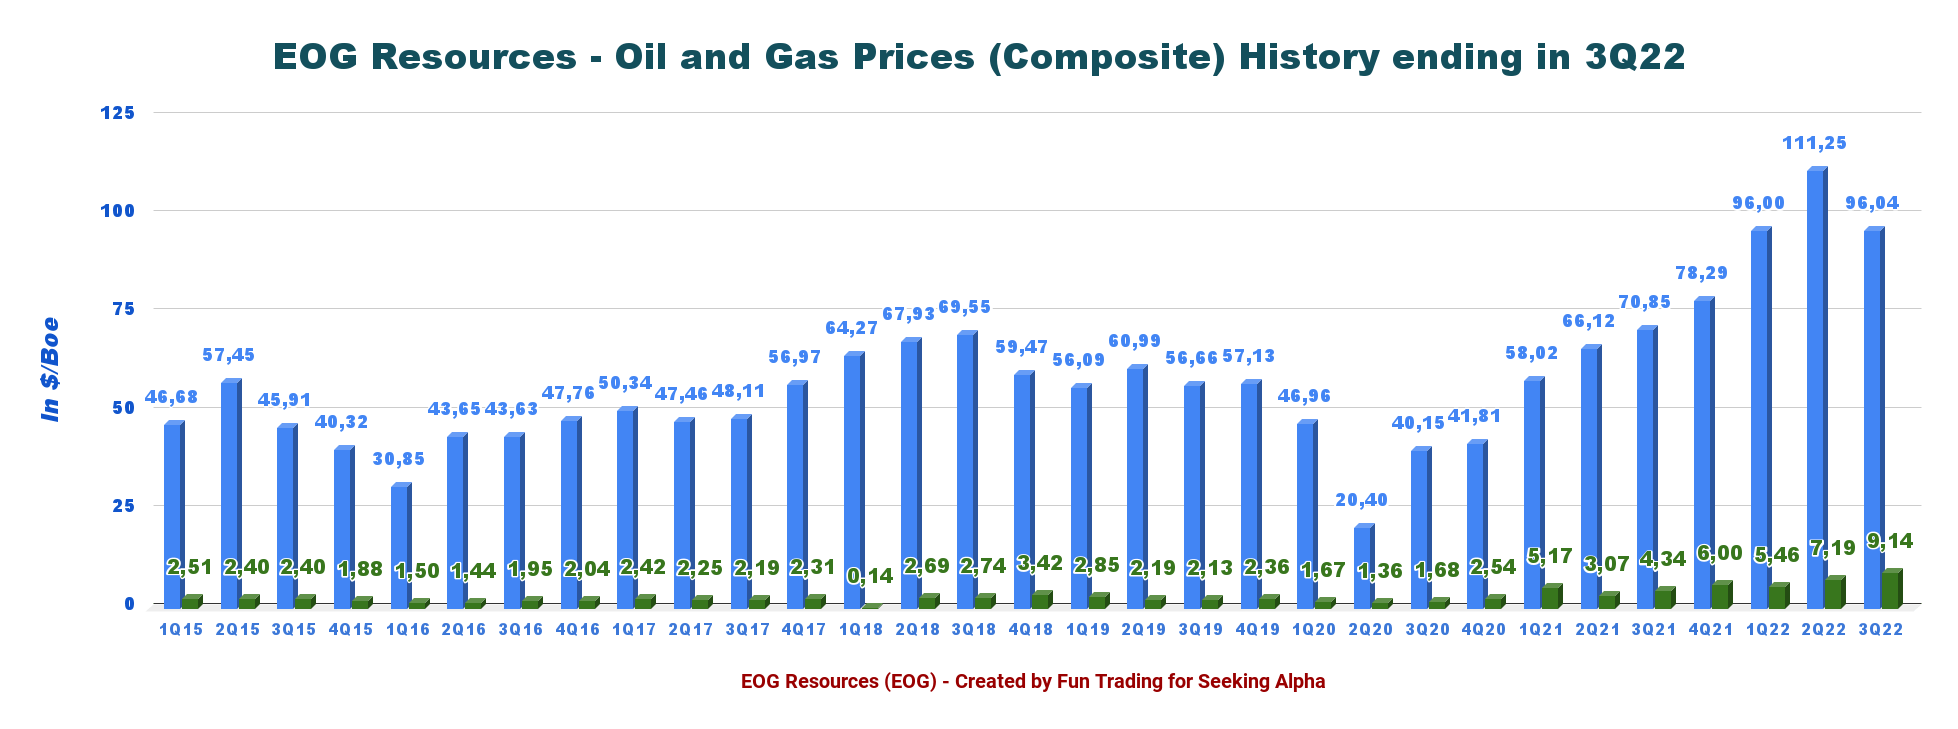
4 – No more Net Debt and good Cash position. Excellent Profile with net cash of $188 million.
EOG Quarterly Cash versus debt history (Fun Trading) As of September 30, 2022, EOG Resources had cash and cash equivalents of $5,272 million. Long-term debt was reported at $5,084 million. The current portion of the long-term debt was recorded at $1,282 million – the debt to a total capitalization of -1%, which is excellent. EOG is now net debt free, which is a huge plus.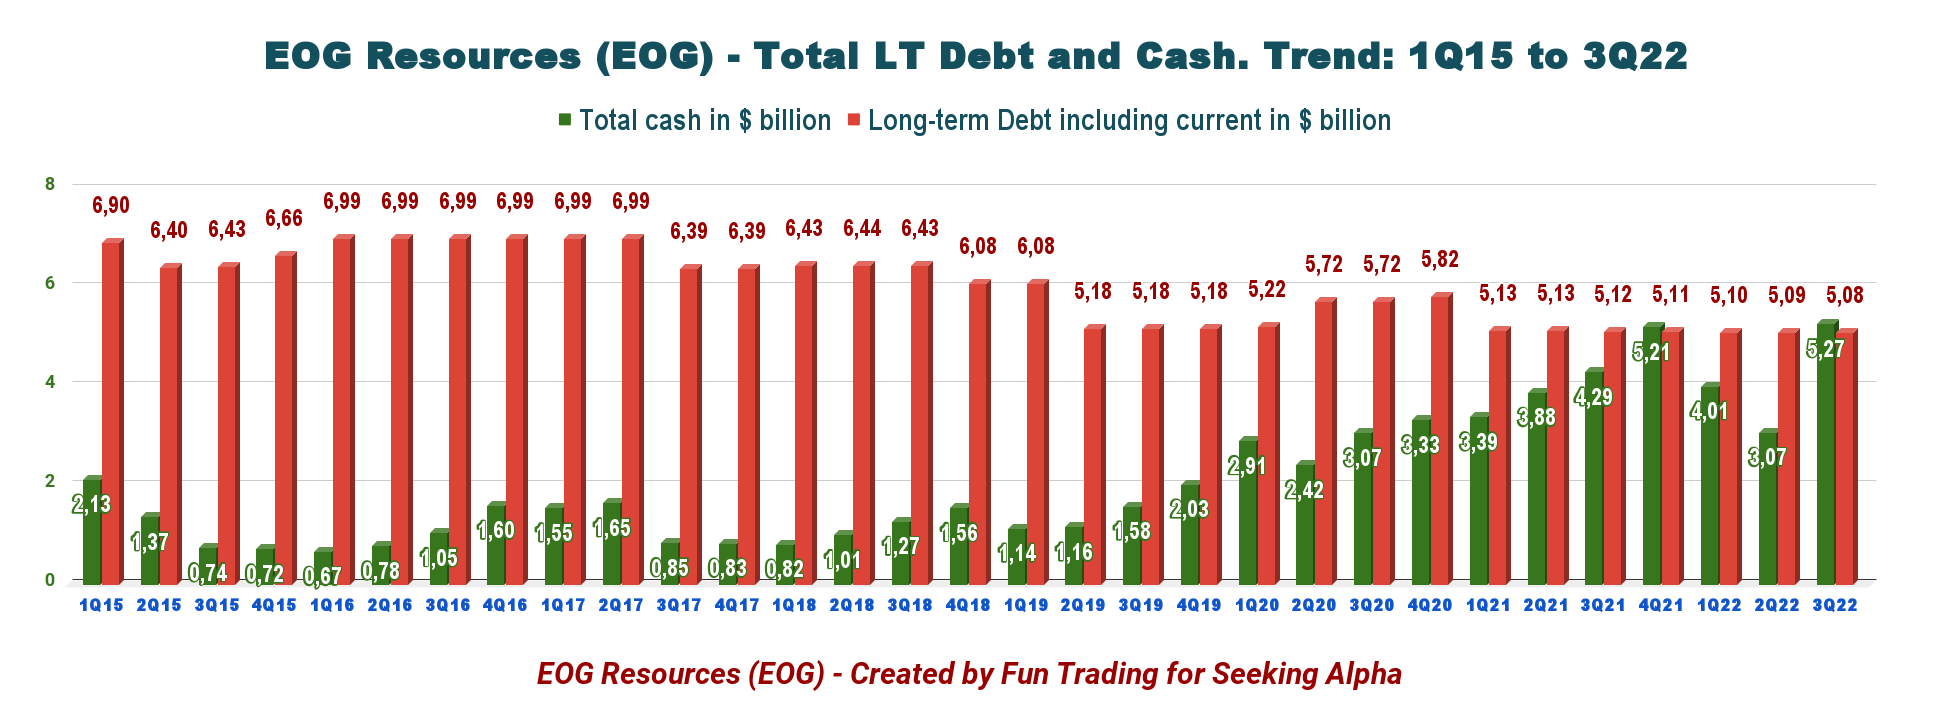
5 – 2022 Guidance is going up
For 2022, EOG Resources forecasts total production between 903.3K-915.1K Boep/d, representing an increase from what was reported last year.
The company expects production between 900K and 936.7K Boep/d for the fourth quarter.
The company gave its capital budget of $4,500-$4,700 million for the year. Of the same, $1,250-$1,450 million will likely be used in the fourth quarter.
EOG Resources expects 2022 production between 903.3K to 915.1K Boep/d, with the fourth-quarter production higher than 828.9K Boep/d reported last year.
Part IV – Technical Analysis And Commentary
EOG TA Chart short-term (Fun Trading StockCharts)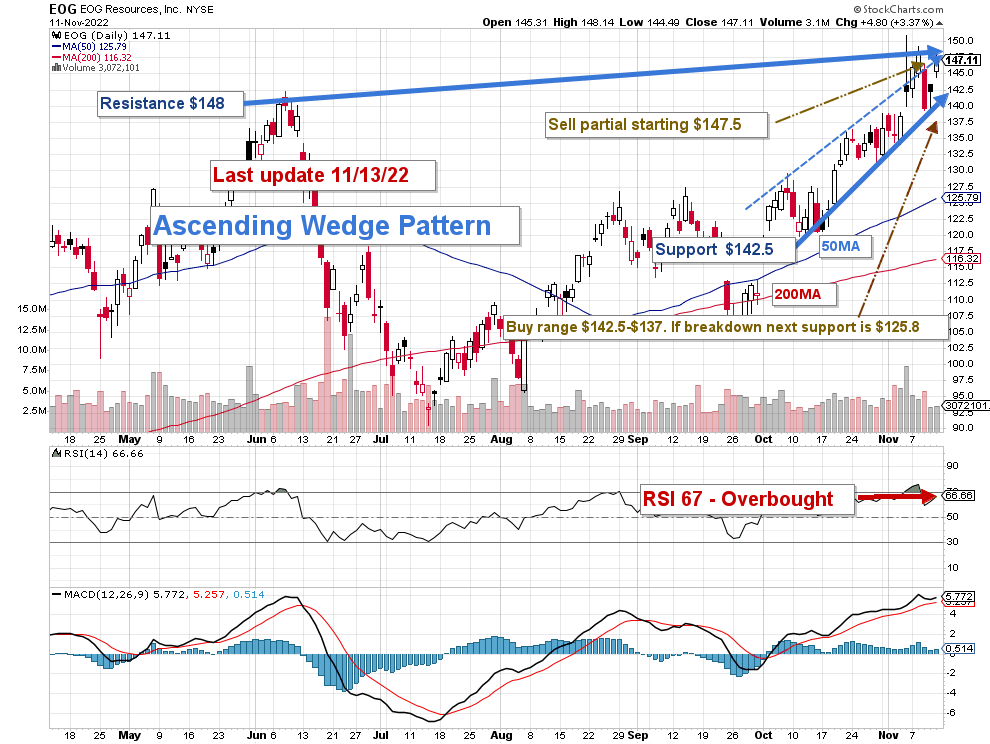
Note: The chart has been adjusted for dividends.
EOG forms an ascending channel pattern/Ascending Wedge with resistance at $148 and support at $142.5. The ascending channel is also known as a rising or up channel. This case may indicate a bearish short-term outlook after a strong push last week. Also, RSI is overbought, which tends to confirm a potential retracement soon.
The short-term trading strategy is to trade LIFO for about 30%-40% of your position. I have decreased the short-term portion because of the increasing volatility attached to the oil sector and the elevated risk of a global recession in 2023.
I suggest selling at above $147.5 and waiting for a retracement below $142 to $137. However, if oil prices turn bearish, EOG could retest the lower support at around $125.8 (50MA).
Watch oil prices like a hawk.
Note: The LIFO method is prohibited under International Financial Reporting Standards (IFRS), though it is permitted in the United States to generally accepted accounting principles (GAAP). Therefore, only US traders can apply this method. Those who cannot trade LIFO can use an alternative by setting two different accounts for the same stocks, one for the long term and one for short-term trading.
Warning: The TA chart must be updated frequently to be relevant. It is what I am doing in my stock tracker. The chart above has a possible validity of about a week. Remember, the TA chart is a tool only to help you adopt the right strategy. It is not a way to foresee the future. No one and nothing can.
Author’s note: If you find value in this article and would like to encourage such continued efforts, please click the “Like” button below as a vote of support. Thanks.
Be the first to comment