

spooh
The beautiful thing about the midstream space is that there is an opportunity for strong and steadily growing cash flows over an extended timeframe. One company that has recently performed exceptionally well on this front is Enterprise Products Partners (NYSE:EPD). The enterprise, which operates as a fully integrated mid-stream energy asset network that links producers of natural gas, natural gas liquids, and crude oil with domestic consumers and international markets, recently reported financial results covering the second quarter of its 2022 fiscal year. In that quarter, the company exhibited tremendous upside from a revenue perspective. But more importantly, it showed continued improvement in its cash flow figures. If current estimates for the 2022 fiscal year hold true, then shares of the company, while not the cheapest in the space, could offer some additional upside for investors moving forward. Because of this, I have decided to retain my ‘strong buy’ rating on the company, reflecting my belief that it should continue to outperform the market materially for the foreseeable future.
EPD’s recent performance has been strong
The last time I wrote an article dedicated to Enterprise Products Partners was back in June of 2020. At that time, I had acknowledged that shares of the company had been volatile for a few months. However, the overall fundamental condition of the business remained robust and I felt that the company’s stock was significantly undervalued. This led me to ultimately rate the business a ‘strong buy’. And since then, things have gone pretty well. While the S&P 500 has generated a return of 29.3%, shares of Enterprise Products Partners have generated a return of 46.2%.
Author – SEC EDGAR Data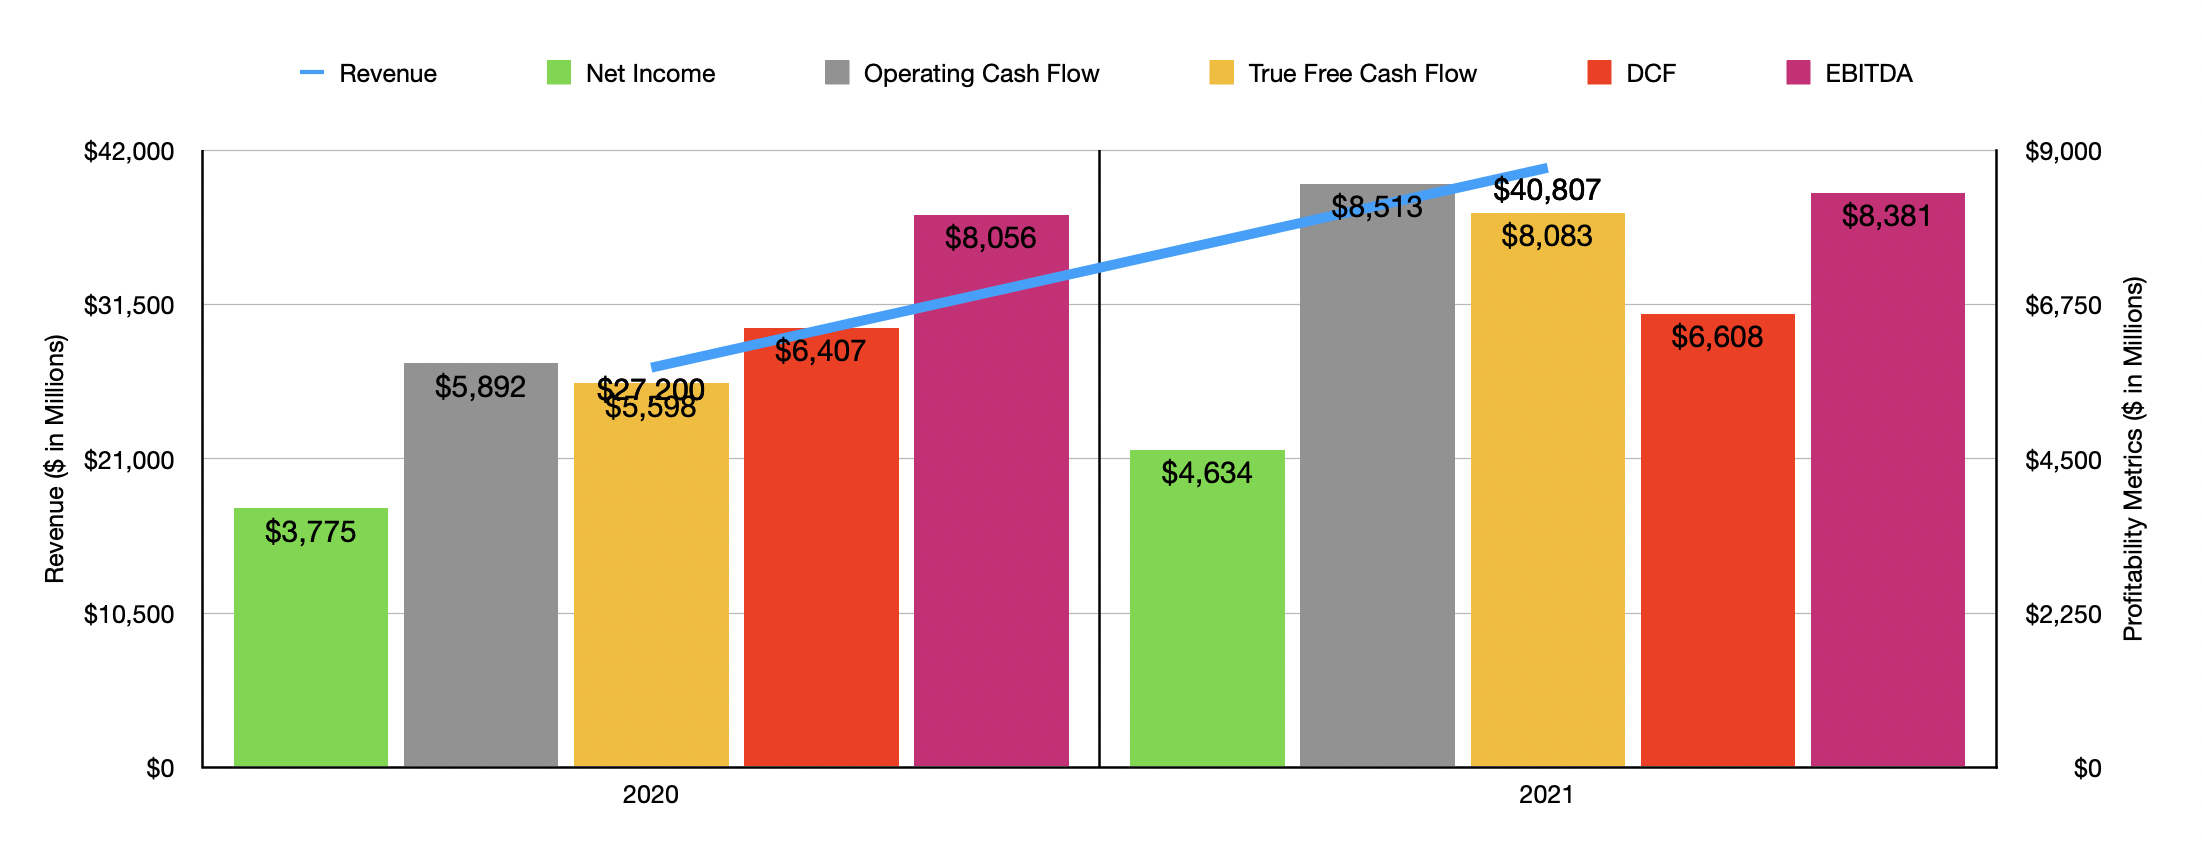
This increase was not without cause. In fact, it has been driven by consistent and improving cash flow figures for the company. Consider how the business performed from 2020 to 2021. Net income, for starters, rose from $3.78 billion to $4.63 billion. Operating cash flow jumped from $5.89 billion to $8.51 billion. True free cash flow, which strips out sustaining capital expenditures from operating cash flow, rose from $5.60 billion to $8.08 billion. DCF, or distributable cash flow, jumped from $6.41 billion to $6.61 billion. And EBITDA for the company increased from $8.06 billion to $8.38 billion.
Author – SEC EDGAR Data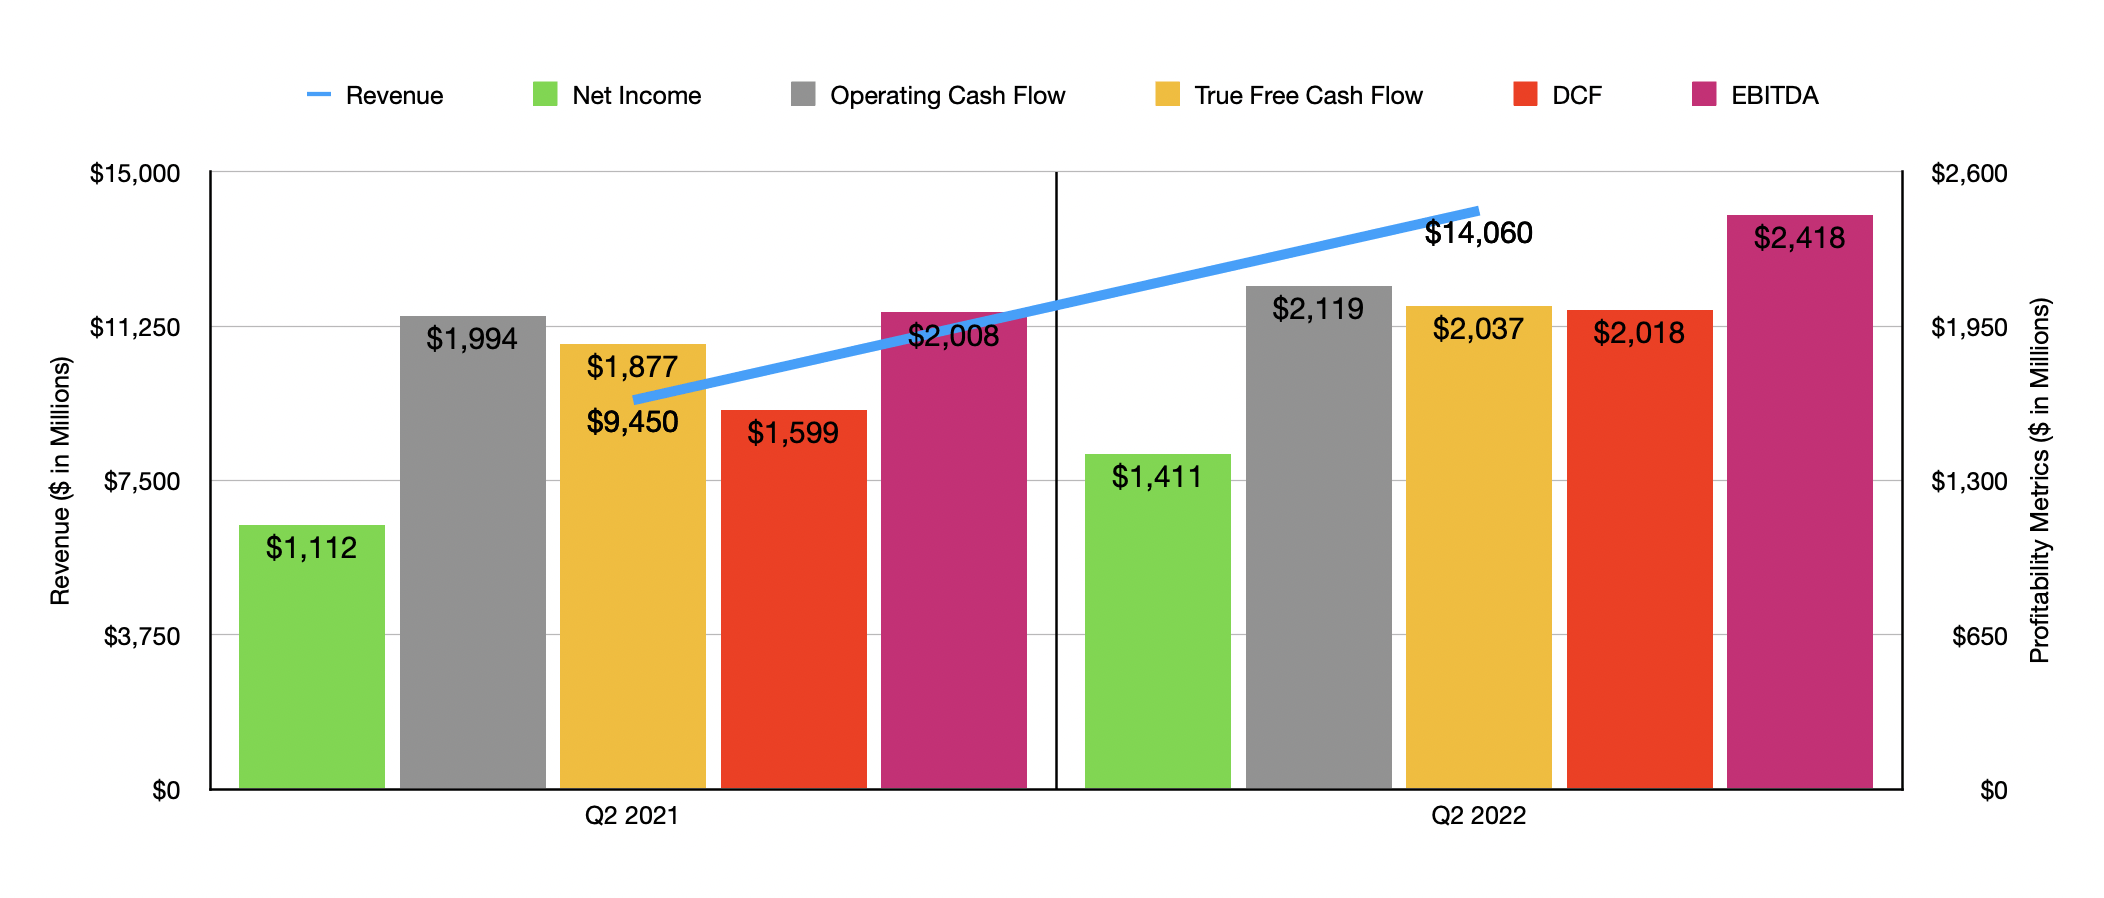
Growth for the company has continued into the current fiscal year even. In the latest quarter, for instance, which management just reported on August 3rd, the business reported net income of $1.41 billion. That’s 26.9% higher than the $1.11 billion generated one year earlier. Operating cash flow rose a more modest 6.3%, climbing from $1.99 billion to $2.12 billion. True free cash flow rose from $1.88 billion to $2.04 billion. DCF increased from $1.60 billion to $2.02 billion. And EBITDA for the company increased from $2.01 billion to $2.42 billion. All of this data can be seen in the graph above. And in the graph below, you can see the same metrics but covering for the first half of the 2022 fiscal year relative to the first half of the 2021 fiscal year. This timeframe showed a similar year-over-year increase for the business.
Author – SEC EDGAR Data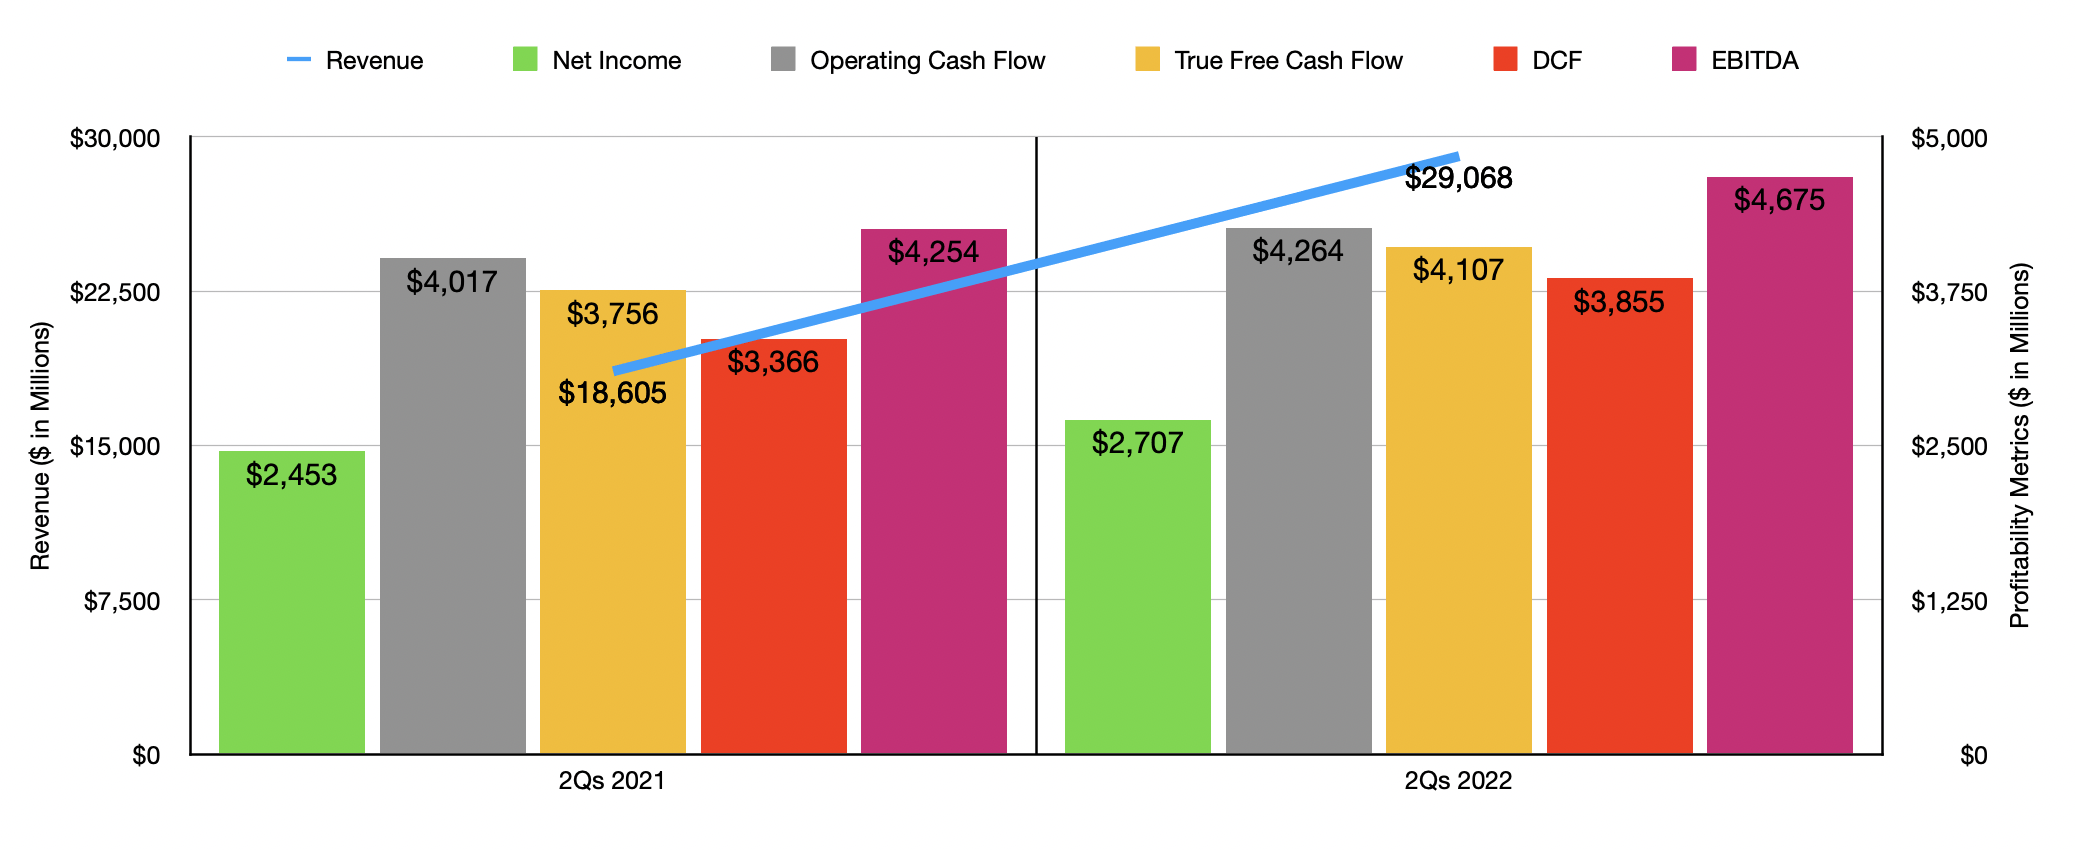
As a large and complicated company with many moving parts, it’s really difficult to distill in a few words precisely what contributed to these improvements. So instead, I will focus on a few key areas. First and foremost, the business benefited from an increase in volume processed through its network. Under the NGL Pipelines & Services segment, for instance, the company saw volumes rise almost across the board. NGL pipeline transportation volumes, for instance, rose by 7.2% year over year in the latest quarter. NGL marine terminal volumes grew by 12.3%. NGL fractionation volumes jumped by 7.3%. And fee-based natural gas processing volumes grew by an impressive 22.6%. Only equity NGL-equivalent production volumes dropped, ticking down by 1.5% year over year. The company also saw improvements across other categories. Crude oil pipeline transportation volumes, for instance, rose by 7.6%, while natural gas pipeline transportation volumes jumped by 18.7%. Other aspects of the company also added to the picture. Pricing also certainly contributed to the company’s improved results. Related to some of these changes is the fact that the company is also engaged in some purchases over the years. In February of this year, for instance, the company purchased Navitas Midstream for $3.2 billion. Plus the company continues to invest in growth. In the latest quarter alone, it allocated $576 million to organic growth capital projects, on top of the $157 million dedicated to sustaining capital expenditures. And for the year as a whole, the company expects to allocate around $1.6 billion to growth projects.
Author – SEC EDGAR Data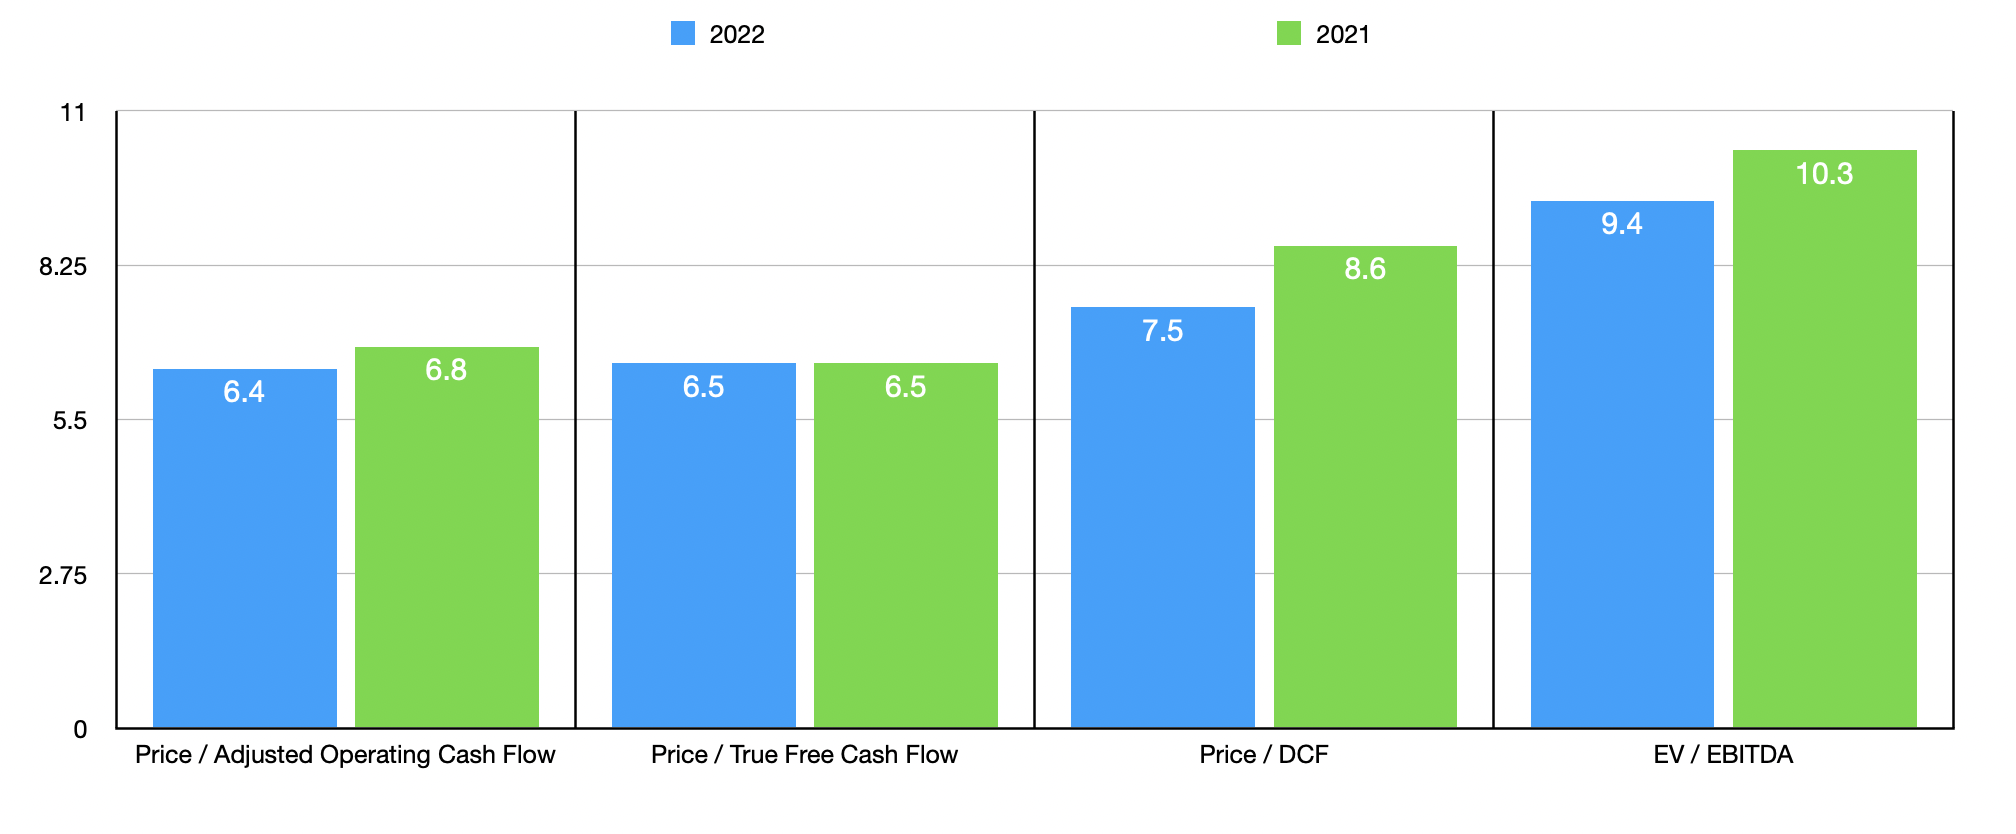
It’s difficult to know what to expect for the rest of the year. But if the first part of the year is any indication, we should anticipate operating cash flow of roughly $9.04 billion and true free cash flow of $8.84 billion. DCF should be around $7.57 billion, while EBITDA should come in somewhere around $9.21 billion. This makes valuing the company fairly easy. On a price to adjusted operating cash flow basis, which strips out non-controlling interests and preferred distributions, the company is trading at a multiple of 6.4. This compares to the 6.8 multiple that we get if we use 2021 results. In both years, the price to true free cash flow multiple is 6.5, while the price to DCF multiple should drop from 8.6 using last year’s results to 7.5 using this year’s results. Meanwhile, the EV to EBITDA multiples should drop from 10.3 to 9.4. To put this in perspective, I also compared the company to five similar firms. On a price to operating cash flow basis, these companies ranged from a low of 4.2 to a high of 10.5. Only one of the five companies is cheaper than our prospect. Using the EV to EBITDA approach, meanwhile, we get a range of between 7.6 and 14.9. In this case, two of the five companies were cheaper than Enterprise Products Partners.
| Company | Price / Operating Cash Flow | EV / EBITDA |
| Enterprise Products Partners | 6.8 | 10.3 |
| TC Energy (TRP) | 10.5 | 14.0 |
| Kinder Morgan (KMI) | 8.0 | 12.3 |
| The Williams Companies (WMB) | 9.6 | 14.9 |
| Cheniere Energy (LNG) | 9.1 | 7.6 |
| Energy Transfer (ET) | 4.2 | 9.8 |
To put the upside of the company into context, I averaged out the trading multiples of the five comparable firms, including the severely underpriced Energy Transfer. Using the price to operating cash flow approach, if we were to assume that Enterprise Products Partners warrants trading at the average of these five companies, upside potential from today would be 31.9%. And if we do this using the EV to EBITDA approach, upside would increase to 37.8%.
Takeaway
Based on all the data provided, it seems to me as though Enterprise Products Partners continues to be a fascinating prospect with a nice amount of upside potential. To be clear, it still takes a back seat in my book to Energy Transfer. But all the same, it does still seem to provide investors with some interesting opportunities. So much so that I would feel comfortable keeping my ‘strong buy’ rating on the company for now.
Be the first to comment