

RgStudio
This bear market has been both the best of times and the worst of times for investors.
It began with the worst 2-week start to the year in history.
And we’ve seen single-day rallies of 4%.
The 4th bear market rally was an 18% 2-month epic run that saw the average Nasdaq stocks soar 42% off the June 14th lows.
Just how volatile has this bear market been?
Charlie Bilello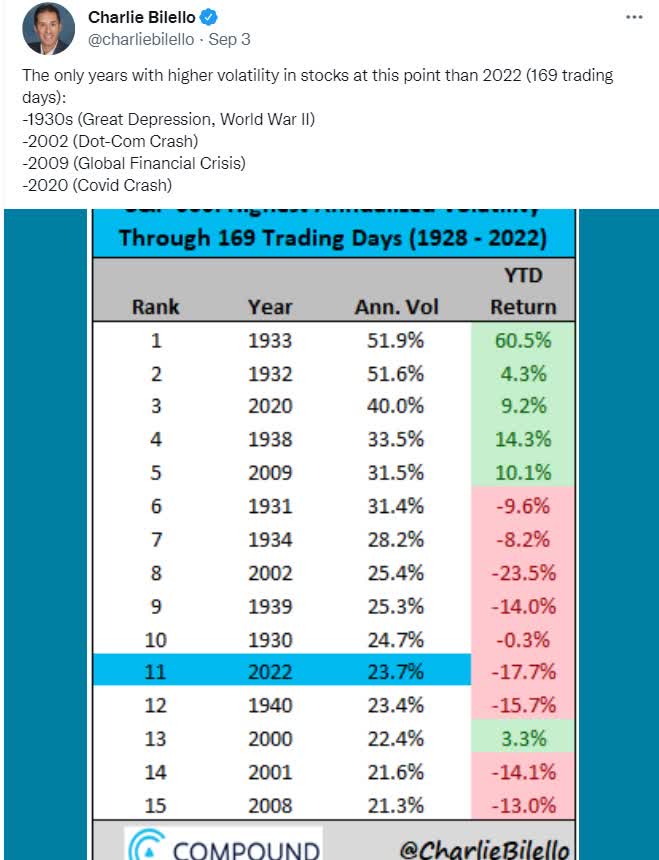
Through early September, it’s the 11th most volatile market in US history, on par with the Tech crash, Great Recession, Great Depression, and Pandemic crash.
You’re not alone if you’re feeling a bit queasy at all this volatility.
Daily Shot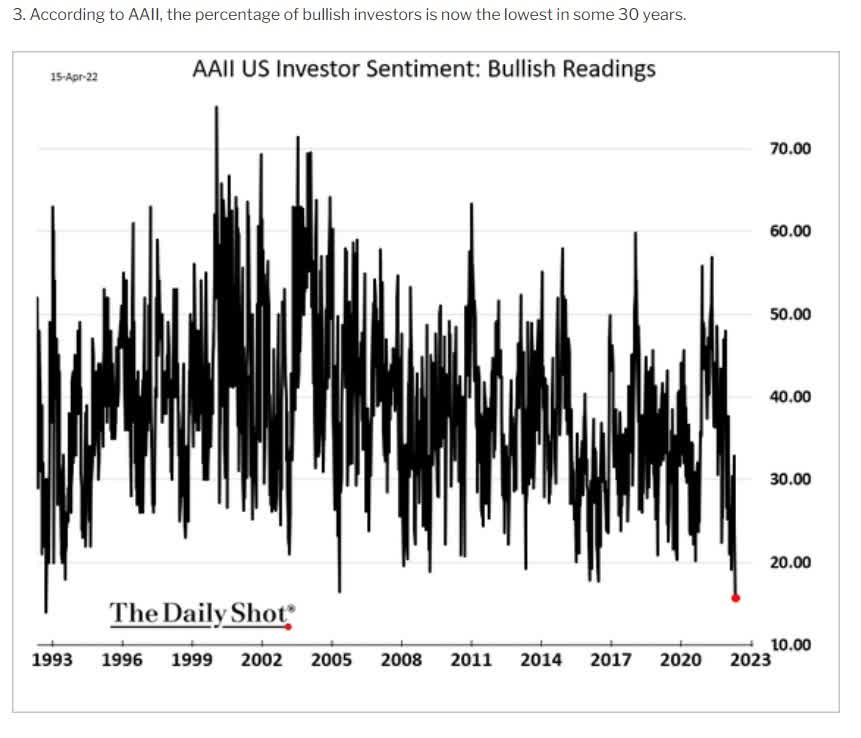
Retail investors have lost hope and are on the verge of despair, which is the best time to buy world-beater blue-chips like Enterprise Products Partners (NYSE:EPD).
But couldn’t the stock market fall further?
Bloomberg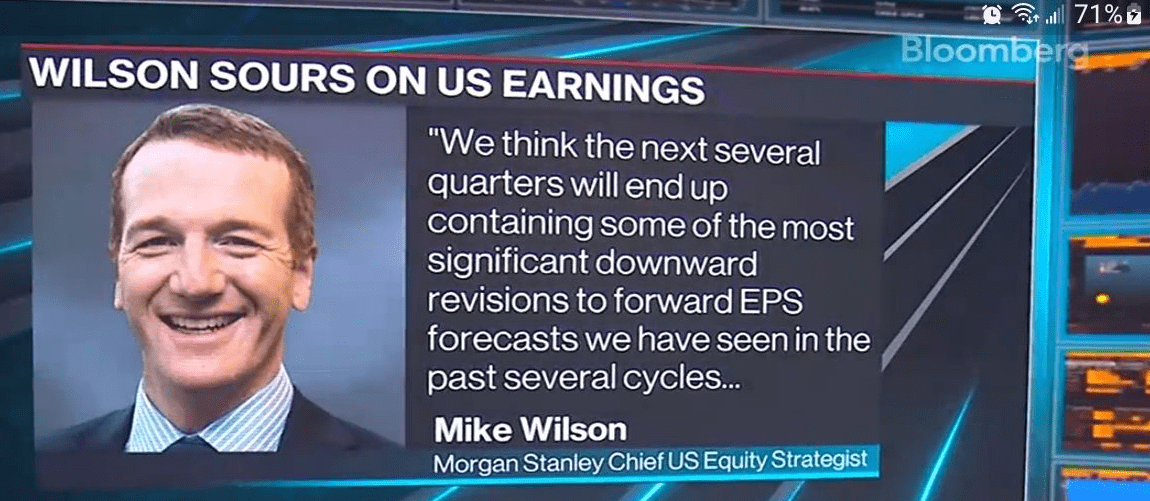
That’s exactly what Morgan Stanley’s Chief US Equity Strategist Mike Wilson thinks will happen.
Morgan thinks that major downside earnings revisions will take the S&P down to at least 3,400, approximately 12% lower than it is now.
If we get a recession, then Morgan Stanley thinks the market likely bottoms sometime in Q4 at around 3000, a 38% peak decline.
But guess what? Mike Wilson doesn’t have a crystal ball. For every Morgan Stanley with a base case of falling stocks, there’s an equally reasonable bullish blue-chip firm like JPMorgan, with reasons why stocks could rip higher by 30% within a few months.
How can you navigate these turbulent market waters while staying safe, sane, and rational? How can you put money to work to generate rich retirement income without losing your lunch if the market rolls over again?
By focusing on what matters in the long-term, safety and quality first, and prudent valuation and sound risk management always.
Ycharts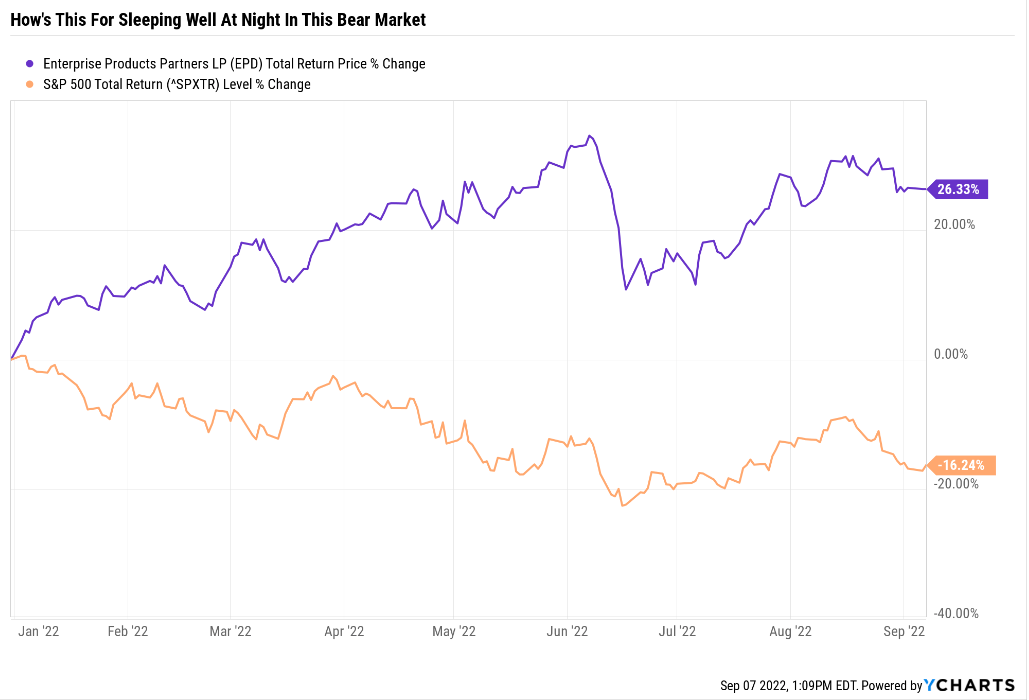
And also, by buying anti-bubble, high-yield blue-chips like Enterprise Products Partners (K1 tax form), which, despite soaring 26% in 2022, is still a good buy.
I last covered EPD in June, and it’s up 11% since then, beating the S&P 500 by 5X.
Ycharts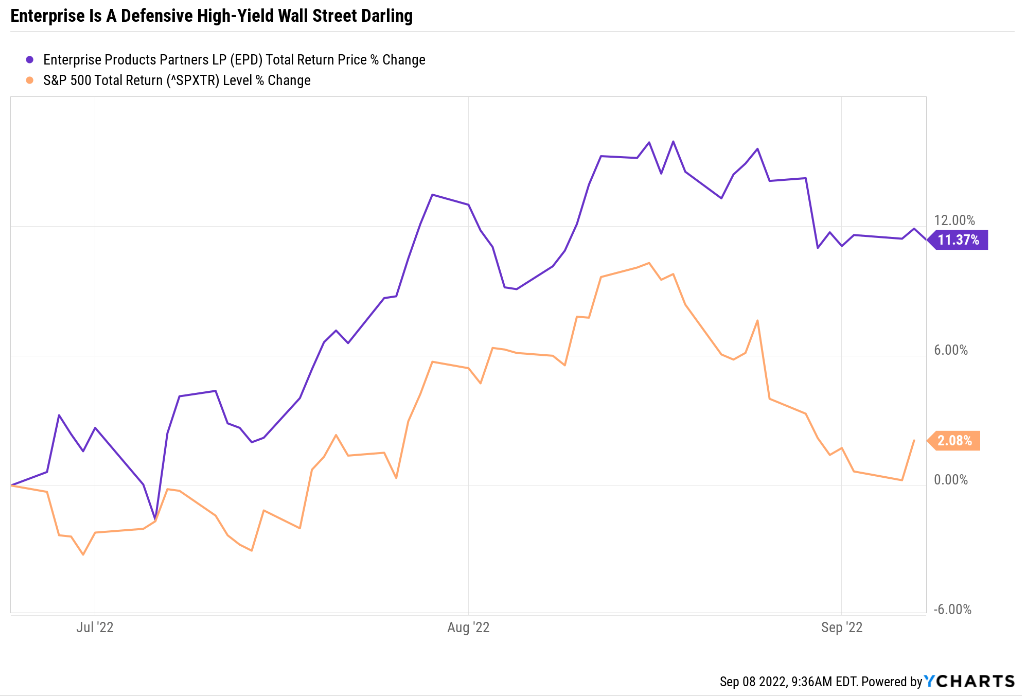
Here are four reasons Enterprise is still an ultra-high-yielding dream blue-chip. One that is perfect for those who need to enjoy generous and potentially safe yields today and could help you retire in safety and splendor in the years and decades to come.
Reason One: Enterprise Is The Complete Safe High-Yield Package
Here is the bottom line up front about EPD.
A deep dive into the tax complexity of MLPs.
- some tax proposals call for taxing LPs as corporations
- analysts think these have a small chance of actually passing
- and if they did high depreciation for MLPs would likely result in very modest tax bills that would not threaten the safety of very well-covered blue-chip distributions
- Foreign withholding tax rate of 37% and whether or not you can recoup it via tax credits depends on your country’s tax treaty with the US
Reasons To Potentially Buy Enterprise Solutions Today
| Metric | Enterprise Products Partners |
| Quality | 82% 12/13 Super SWAN (Sleep Well At Night) Midstream |
| Risk Rating | Low |
| DK Master List Quality Ranking (Out Of 500 Companies) | 200 |
| Quality Percentile | 60% |
| Dividend Growth Streak (Years) | 24 |
| Dividend Yield | 7.2% |
| Dividend Safety Score | 87% Very Safe |
| Average Recession Dividend Cut Risk | 0.5% |
| Severe Recession Dividend Cut Risk | 1.7% |
| S&P Credit Rating |
BBB+ Stable (Investment Grade) |
| 30-Year Bankruptcy Risk | 5.00% |
| Consensus LT Risk-Management Industry Percentile |
66% Above-Average |
| Fair Value | $31.35 |
| Current Price | $26.25 |
| Discount To Fair Value | 16% |
| DK Rating |
Potentially Good Buy |
| P/Cash Flow | 7.1 (Anti-Bubble Blue-Chip) |
| Growth Priced In | -2.80% |
| Historical PE Range | 10 to 12 |
| LT Growth Consensus/Management Guidance | 4.4% |
| 5-year consensus total return potential |
14% to 19% CAGR |
| Base Case 5-year consensus return potential |
16% CAGR (2X S&P 500) |
| Consensus 12-month total return forecast | 28% |
| Fundamentally Justified 12-Month Return Potential | 27% |
| LT Consensus Total Return Potential | 11.6% CAGR Vs. 11% aristocrats and 10.2% S&P 500 |
| Inflation-Adjusted Consensus LT Return Potential | 9.4% |
| Consensus 10-Year Inflation-Adjusted Total Return Potential (Ignoring Valuation) | 2.45 |
| LT Risk-Adjusted Expected Return | 7.71% |
| LT Risk-And Inflation-Adjusted Return Potential | 5.49% |
| Conservative Years To Double | 13.11 |
(Source: DK Zen Research Terminal)
EPD is an anti-bubble blue-chip.
Anti-bubble blue-chips are quality companies priced for negative growth (-2.8% in this case) that are actually expected to grow at positive rates.
- the margin of safety is so high it’s impossible to lose money over the long-term if a company grows at 0% or faster
- and you avoid becoming a forced seller for emotional or financial reasons
Enterprise Products 2024 Consensus Total Return Potential
(Source: FAST Graphs, FactSet Research) (Source: FAST Graphs, FactSet Research)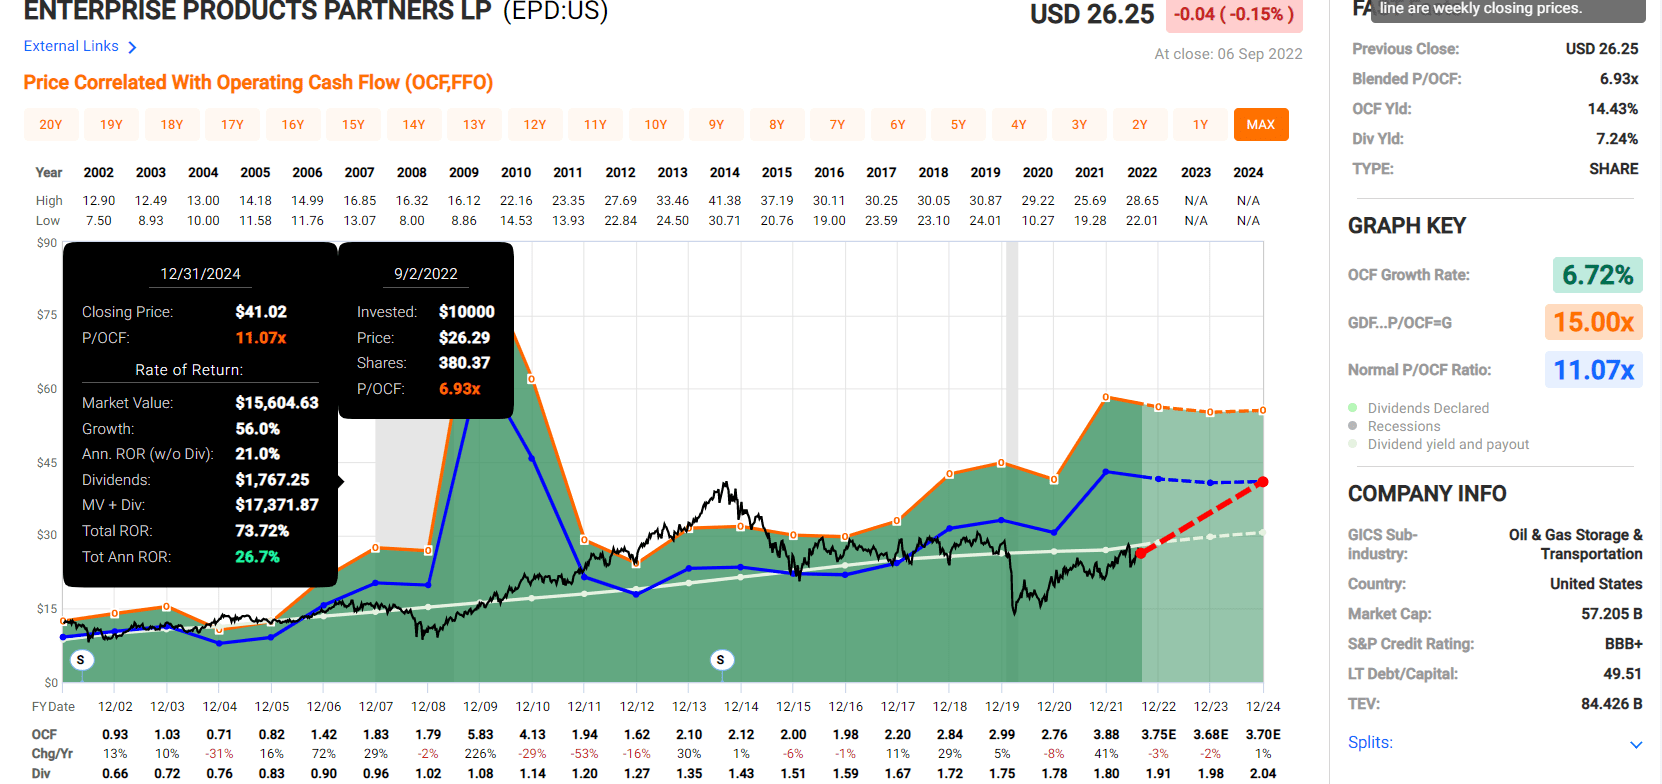
Enterprise 2027 Consensus Total Return Potential
(Source: FAST Graphs, FactSet Research) (Source: FAST Graphs, FactSet Research)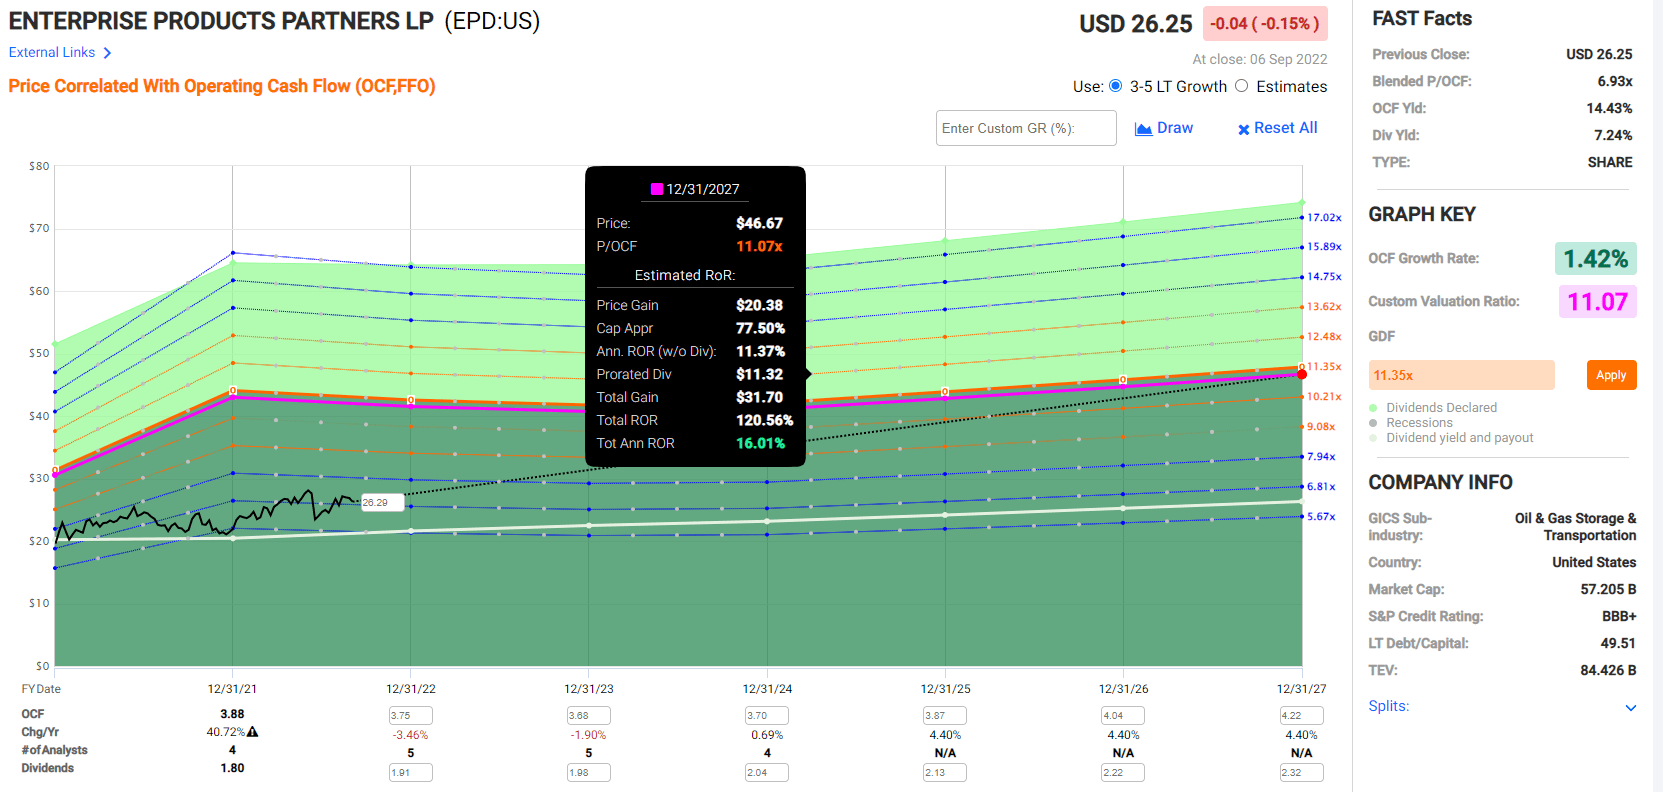
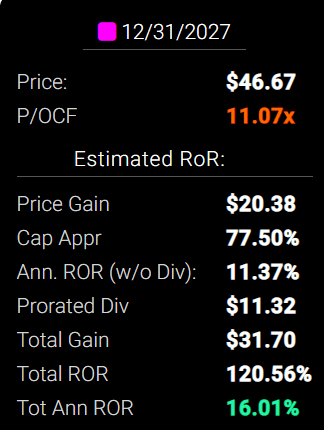
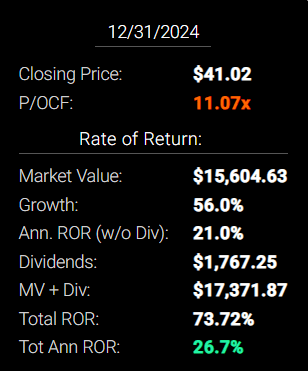
If EPD grows as expected and returns to historical market-determined fair value, it could deliver 27% CAGR returns through 2024 and 16% through 2027.
- Buffett-like return potential from an anti-bubble blue-chip bargain hiding in plain sight
Now compare that to the S&P 500.
S&P 500 2024 Consensus Total Return Potential
(Source: FAST Graphs, FactSet Research) (Source: FAST Graphs, FactSet Research)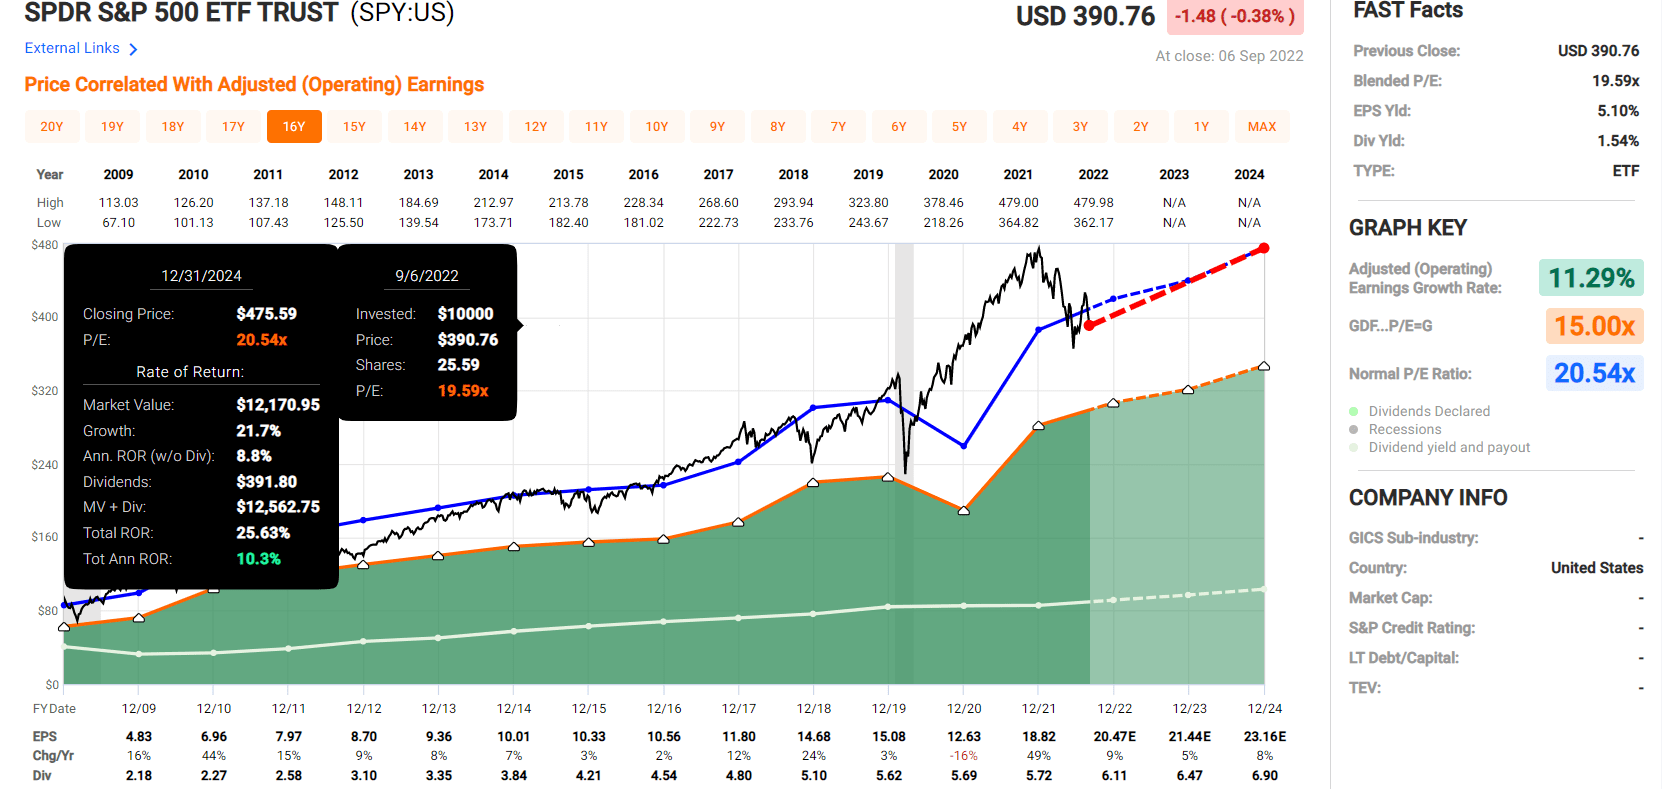
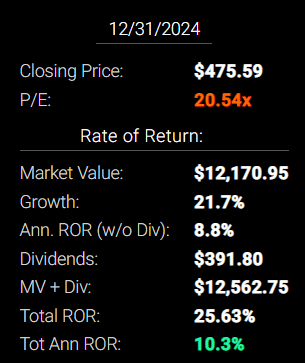
The market has fallen for three straight weeks, but earnings estimates are also falling, so the market is basically at fair value and offering historically normal medium-term return potential.
S&P 500 2027 Consensus Total Return Potential
| Year | Upside Potential By End of That Year | Consensus CAGR Return Potential By End of That Year | Probability-Weighted Return (Annualized) |
Inflation And Risk-Adjusted Expected Returns |
| 2027 | 54.24% | 9.05% | 6.79% | 4.34% |
(Source: DK S&P 500 Valuation & Total Return Tool)
Over the next five years, analysts expect 9% annual returns from the S&P 500, about 2.0X less than they expect from EPD.
EPD Investment Decision Score
DK (Source: Dividend Kings Automated Investment Decision Tool)
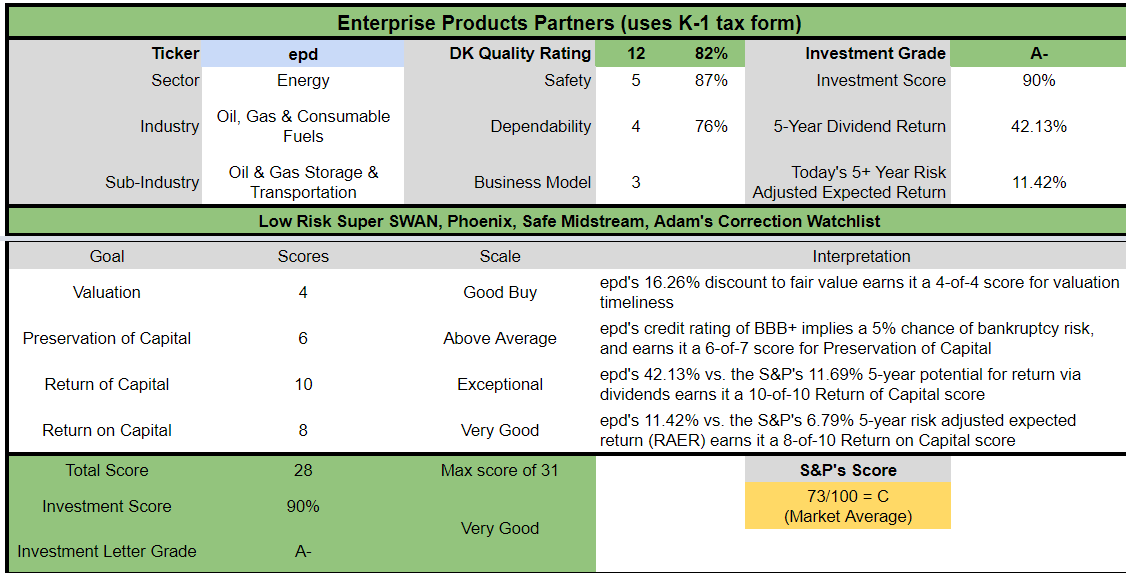
EPD is a very reasonable ultra-yield anti-bubble blue-chip option for anyone comfortable with its risk profile.
- 16% discount vs. 1% market discount = 17% better valuation
- 7.2% yield vs. 1.7% yield (4.4X the yield and a much safer yield at that)
- 15% better consensus long-term return potential
- 2X better risk-adjusted expected return over the next five years
- 4X more income over the next five years
Reason Two: One Of The Highest Quality Ultra-Yields On Earth
There are many ways to measure safety and quality, and I factor in pretty much all of them.
The Dividend Kings’ overall quality scores are based on a 269-point model that includes:
-
Dividend safety
-
Balance sheet strength
-
Credit ratings
-
Credit default swap medium-term bankruptcy risk data
-
Short and long-term bankruptcy risk
-
Accounting and corporate fraud risk
-
Profitability and business model
-
Growth consensus estimates
-
Management growth guidance
-
Historical earnings growth rates
-
Historical cash flow growth rates
-
Historical dividend growth rates
-
Historical sales growth rates
-
Cost of capital
-
GF Scores
-
Morningstar business model uncertainty score
-
Long-term risk-management scores from Moody’s, MSCI, Morningstar, FactSet, S&P, Reuters’/Refinitiv, and Just Capital
-
Management quality
-
Dividend-friendly corporate culture/income dependability
-
Long-term total returns (a Ben Graham sign of quality)
-
Analyst consensus long-term return potential
It includes over 1,000 fundamental metrics, including the 12 rating agencies we use to assess fundamental risk.
-
credit and risk management ratings make up 41% of the DK safety, and quality model
-
dividend/balance sheet/risk ratings make up 82% of the DK safety and quality model
How do we know that our safety and quality model works well?
During the two worst recessions in 75 years, our safety model 87% of blue-chip dividend cuts, the ultimate baptism by fire for any dividend safety model.
How does EPD score on our comprehensive safety and quality models?
EPD Distribution Safety
| Rating | Dividend Kings Safety Score (192 Point Safety Model) | Approximate Dividend Cut Risk (Average Recession) | Approximate Dividend Cut Risk In Pandemic Level Recession |
| 1 – unsafe | 0% to 20% | over 4% | 16+% |
| 2- below average | 21% to 40% | over 2% | 8% to 16% |
| 3 – average | 41% to 60% | 2% | 4% to 8% |
| 4 – safe | 61% to 80% | 1% | 2% to 4% |
| 5- very safe | 81% to 100% | 0.5% | 1% to 2% |
| EPD | 87% | 0.5% | 1.65% |
| Risk Rating | Low-Risk (65th industry percentile risk-management consensus) | BBB+ rating = 5% 30-year bankruptcy risk | 20% OR LESS Max Risk Cap Recommendation |
Long-Term Dependability
| Company | DK Long-Term Dependability Score | Interpretation | Points |
| Non-Dependable Companies | 20% or below | Poor Dependability | 1 |
| Low Dependability Companies | 21% to 59% | Below-Average Dependability | 2 |
| S&P 500/Industry Average | 60% (60% to 69% range) | Average Dependability | 3 |
| Above-Average | 70% to 79% | Very Dependable | 4 |
| Very Good | 80% or higher | Exceptional Dependability | 5 |
| EPD | 76% | Very Dependable | 4 |
Overall Quality
| EPD | Final Score | Rating |
| Safety | 87% | 5/5 Very Safe |
| Business Model | 80% | 3/3 Wide And Stable Moat |
| Dependability | 76% | 4/5 Very Dependable |
| Total | 82% | 12/13 Super SWAN |
| Risk Rating | 4/5 Low-Risk | |
| 15% OR LESS Max Risk Cap Rec |
10% Margin of Safety For A Potentially Good Buy |
EPD is the 200th highest quality company on the DK 500 Masterlist.
How significant is this? The DK 500 Master List is one of the world’s best watchlists, including:
- every dividend aristocrat (S&P companies with 25+ year dividend growth streaks)
- every dividend champion (every company, including foreign, with 25+ year dividend growth streaks)
- every dividend king (every company with 50+ year dividend growth streaks)
- every foreign aristocrat (every company with 20+ year dividend growth streaks)
- every Ultra SWAN (wide moat aristocrats, as close to perfect quality companies as exist)
- 40 of the world’s best growth stocks
In other words, even among the world’s best companies, EPD is higher quality than 60% of them, similar in quality to such aristocrats and Ultra SWANs as:
- Magellan Midstream Partners (MMP): Ultra SWAN
- National Retail Properties (NNN): dividend champion
- Pentair (PNR): dividend aristocrat
- Consolidated Edison (ED): dividend aristocrat
- Honeywell (HON): Ultra SWAN
- Canadian Pacific Railway (CP): Ultra SWAN
EPD Credit Ratings
| Rating Agency | Credit Rating | 30-Year Default/Bankruptcy Risk | Chance of Losing 100% Of Your Investment 1 In |
| S&P | BBB+ stable outlook | 5.00% | 20.0 |
| Fitch | BBB+ stable outlook | 5.00% | 20.0 |
| Moody’s | BBB+ stable outlook | 5.00% | 20.0 |
| Consensus | BBB+ stable outlook | 5.00% | 20.0 |
(Source: S&P, Fitch, Moody’s)
EPD is tied for the highest credit rating in midstream, and if its leverage keeps trending lower as analysts expect, it could be one of the first to obtain an A-credit rating.
(Source: FactSet Research Terminal)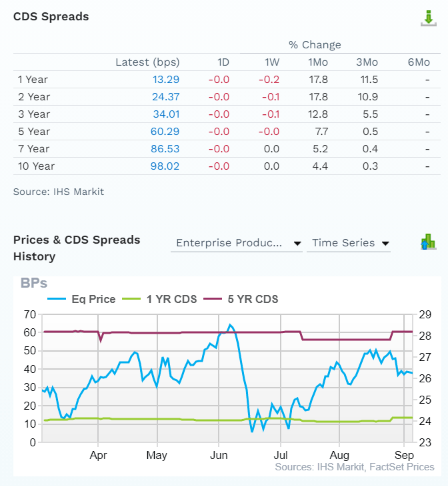
Credit default swaps are insurance policies bond investors take out against default and trade daily on the open market.
- they represent the real-time fundamental risk assessment of the most risk-averse investors in the world
- the “smart money” on Wall Street
Notice how the stock price is highly volatile, but EPD’s fundamental risk (default risk) is very stable.
The bond market estimates a 30-year default risk of approximately 2.94%, consistent with A-credit-rated companies.
EPD Leverage Consensus Forecast
| Year | Debt/EBITDA | Net Debt/EBITDA (5.0 Or Less Safe According To Credit Rating Agencies) |
Interest Coverage (2+ Safe) |
| 2021 | 3.42 | 3.17 | 4.92 |
| 2022 | 3.07 | 3.09 | 5.36 |
| 2023 | 3.02 | 2.96 | 5.57 |
| 2024 | 2.83 | 2.78 | 5.82 |
| 2025 | NA | NA | 6.36 |
| Annualized Change | -6.07% | -4.29% | 5.75% |
(Source: FactSet Research Terminal)
EPD has one of the lowest leverage ratios in the industry and one of the highest interest coverage ratios. And its balance sheet is expected to keep getting safer over time.
EPD Leverage Consensus Forecast
| Year | Total Debt (Millions) | Cash | Net Debt (Millions) | Interest Cost (Millions) | EBITDA (Millions) | Operating Income (Millions) |
| 2021 | $28,626 | $2,819 | $26,608 | $1,283 | $8,381 | $6,315 |
| 2022 | $28,263 | $1,294 | $28,494 | $1,272 | $9,218 | $6,821 |
| 2023 | $28,098 | $1,499 | $27,606 | $1,256 | $9,317 | $6,993 |
| 2024 | $26,885 | $1,173 | $26,437 | $1,218 | $9,497 | $7,089 |
| 2025 | NA | NA | NA | $1,182 | $9,587 | $7,516 |
| 2026 | NA | NA | NA | $1,131 | $9,970 | NA |
| 2027 | NA | NA | NA | NA | $10,583 | NA |
| Annualized Growth | -2.07% | -25.34% | -0.21% | -2.49% | 3.96% | 3.93% |
(Source: FactSet Research Terminal)
Debt is expected to decline slowly while cash flows grow around 4%.
(Source: Investor presentation)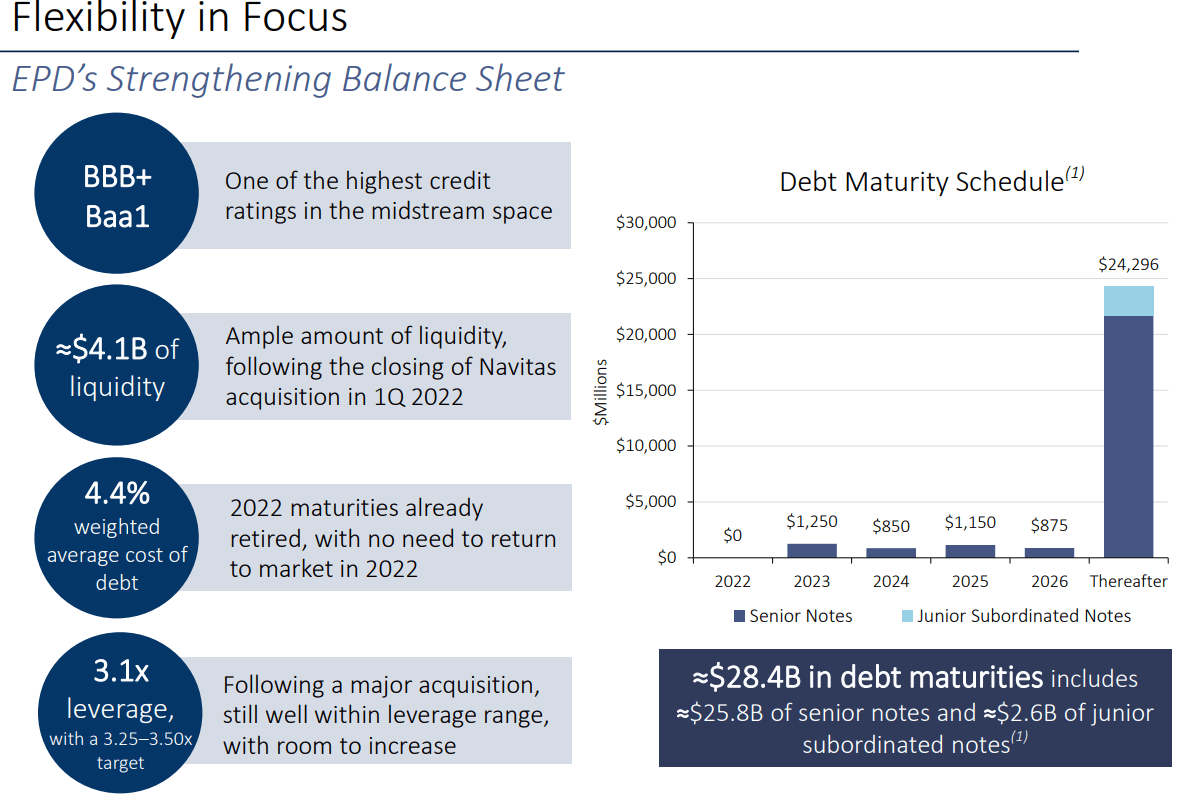
EPD’s average cost of debt is 4.4% (2.2% adjusted for inflation).
- cash return on invested capital is 23.5%
It has very well-staggered bond maturities and no problem refinancing debt in a rising rate environment.
Management is starting a 3.33X long-term leverage ratio, the lowest leverage target in blue-chip midstream.
(Source: Investor presentation)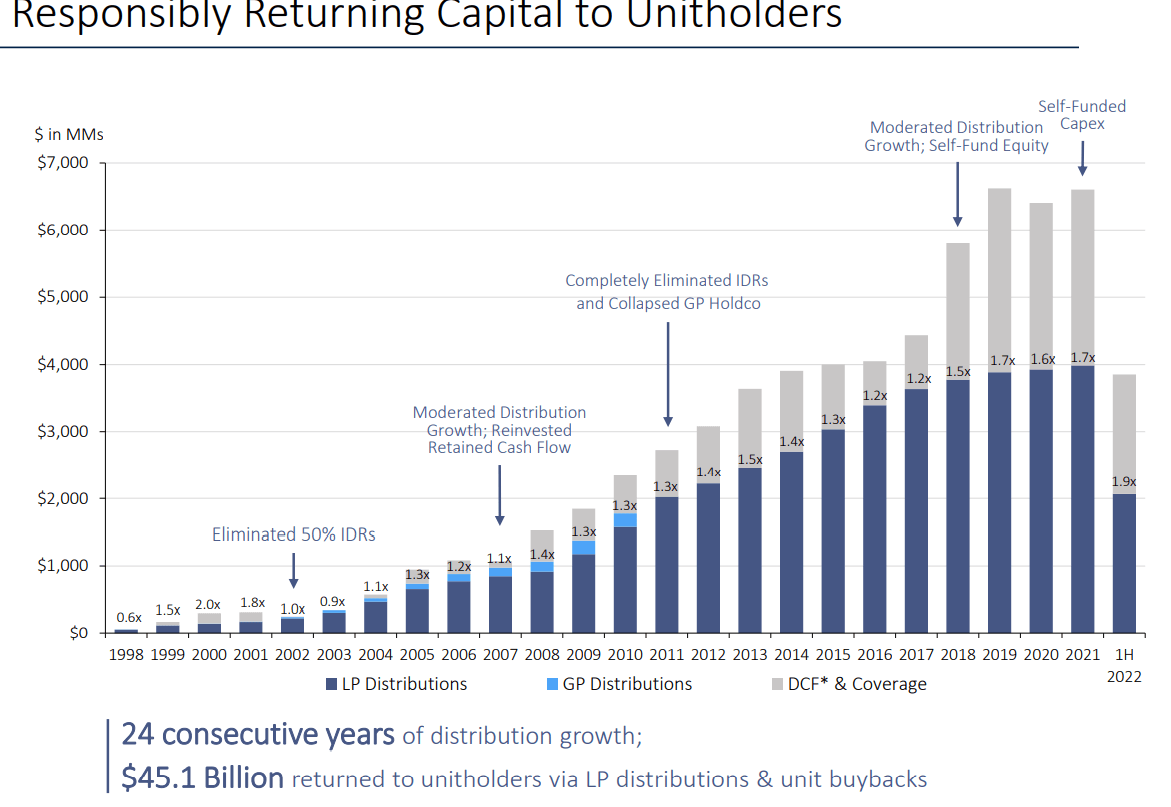
This conservatism is why EPD is one year away from becoming a dividend champion.
(Source: Investor presentation)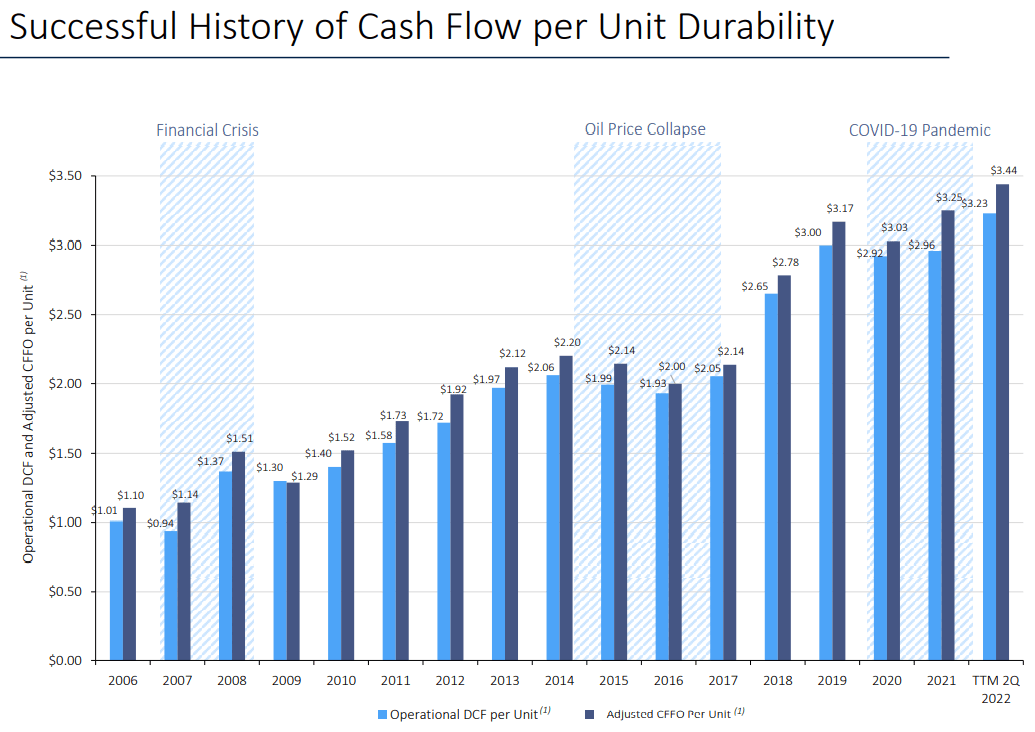
So is the stable nature of its cash flows.
- 15% sensitivity to commodity prices
A Fully FCF Self-Funding Business Model: The Platinum Standard Of Midstream Safety
| Year | Distributable Cash Flow | Free Cash Flow | Distributions | DCF Payout Ratio | FCF Payout Ratio |
| 2022 | $7,424.0 | $5,817.93 | $4,140.10 | 55.8% | 71.2% |
| 2023 | $7,176.0 | $5,752.56 | $4,314.42 | 60.1% | 75.0% |
| 2024 | $7,323.0 | $6,515.21 | $4,488.74 | 61.3% | 68.9% |
| 2025 | $7,632.0 | $6,493.42 | $4,532.32 | 59.4% | 69.8% |
| 2026 | $8,238.0 | $7,168.91 | $4,706.64 | 57.1% | 65.7% |
| 2027 | $8,733.0 | $6,863.85 | $4,837.38 | 55.4% | 70.5% |
| Annual Growth | 3.30% | 3.36% | 3.16% | -0.13% | -0.19% |
(Source: FactSet Research Terminal)
EPD isn’t just equity self-funding; it’s fully FCF self-funding.
- distributions are covered by free cash flow
- with plenty of cash left over to invest in growth, de-leveraging or buybacks
83% of DCF payout ratios are the safety guideline from rating agencies. EPD’s DCF payout ratio is 56%, and its FCF payout ratio is expected to remain stable at around 70% over time.
Reason Three: Solid Growth Prospects For Decades To Come
Pipelines are a terrible long-term investment, right? They must be; the age of oil is at an end, or so plenty of politicians tell us.
Here’s a brief summary of why EPD will likely be around in 50 years.
Energy Market/Transition Update
(Source: EPD investor presentation)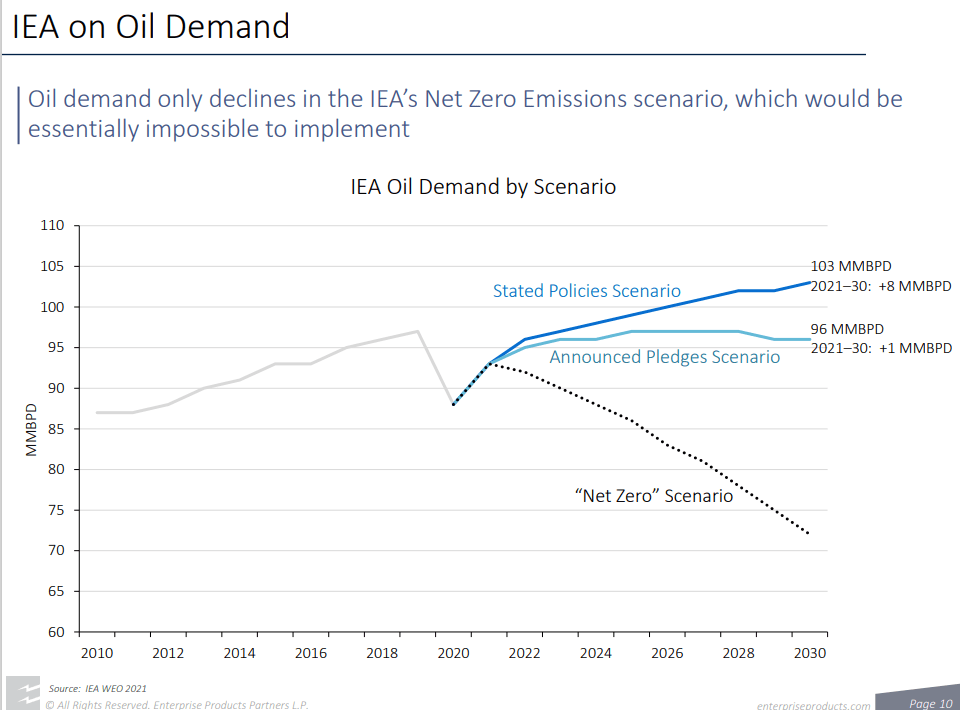
The difference between what politicians say they want have pledged to do and what countries are actually doing is massive.
(Source: EPD investor presentation)
You can’t heat your home or power your economy with good intentions or dreams.
(Source: EPD investor presentation)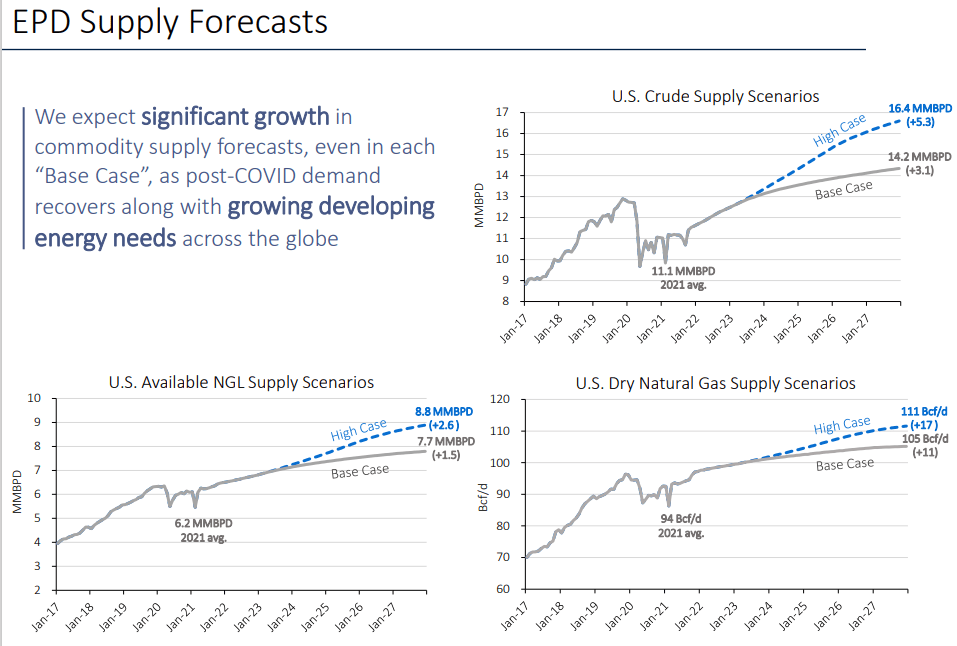
The US is the energy arsenal of democracy, sitting on top of some of the largest and lowest cost (and cleanest to produce) oil & gas reserves on earth.
- The US is now energy independent
- and capable of exporting oil and gas to our struggling allies in Europe
Blue-chip midstreams like EPD are well positioned to profit from America saving Europe from Russian energy blackmail.
(Source: EPD investor presentation)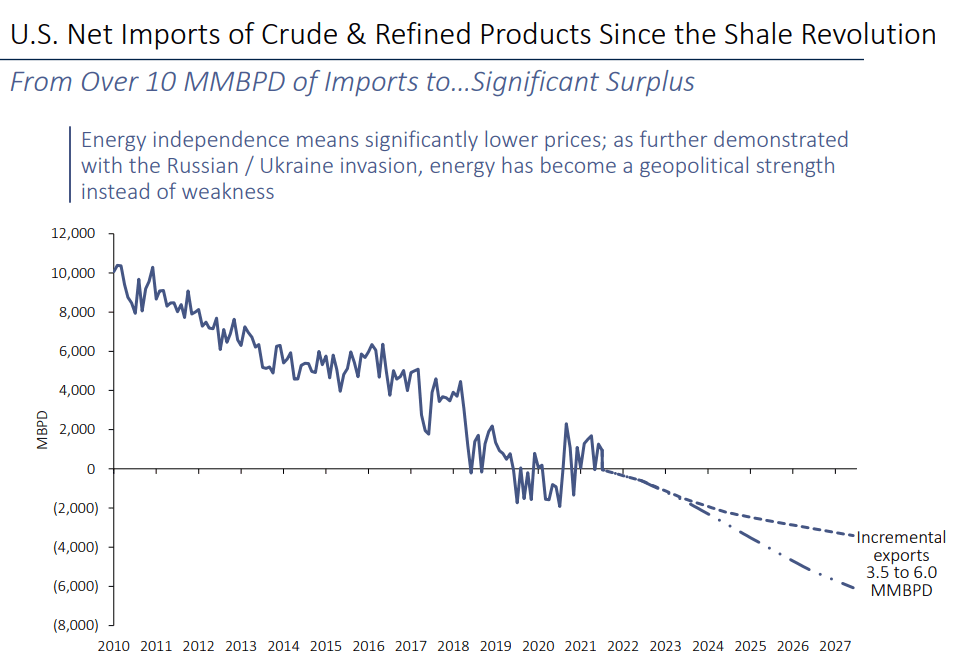
The US is expected to achieve up to 6 million per day in net exports by 2027.
- #2 behind Saudi Arabia at 7.3 million bpd
- ahead of Russia’s 4.8 million
(Source: EPD investor presentation)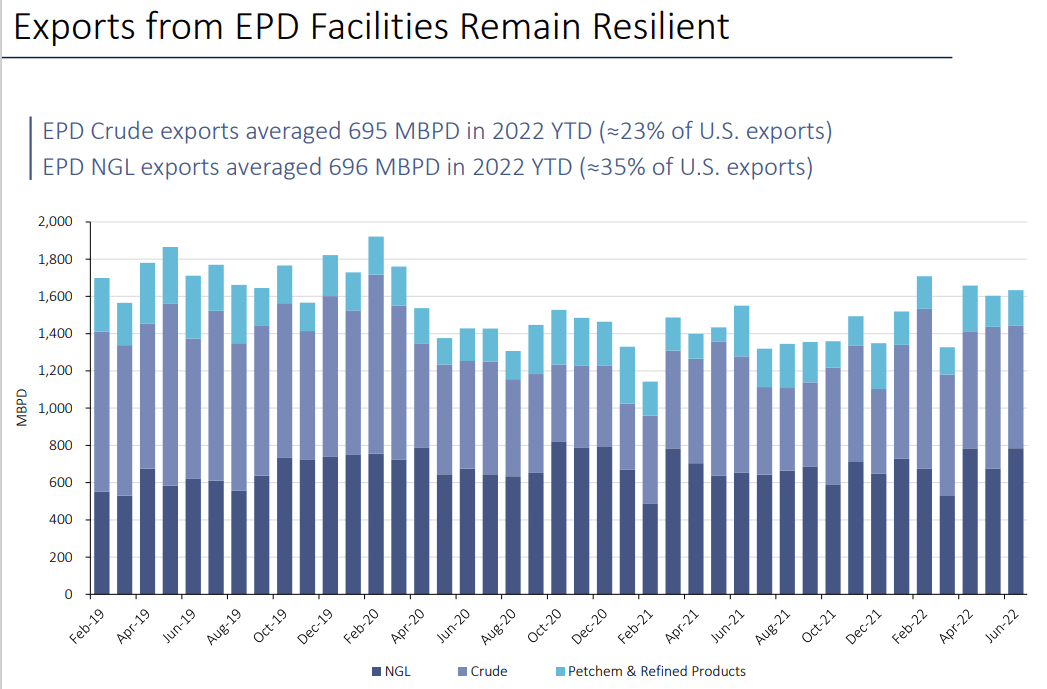
EPD has 23% of the US oil export capacity and 35% of natural gas liquid or NGL capacity.
- EPD is critical to saving our European allies and winning the war in Ukraine
- which is the West’s attempt to stop Hitler in Poland in 1930
(Source: EPD investor presentation)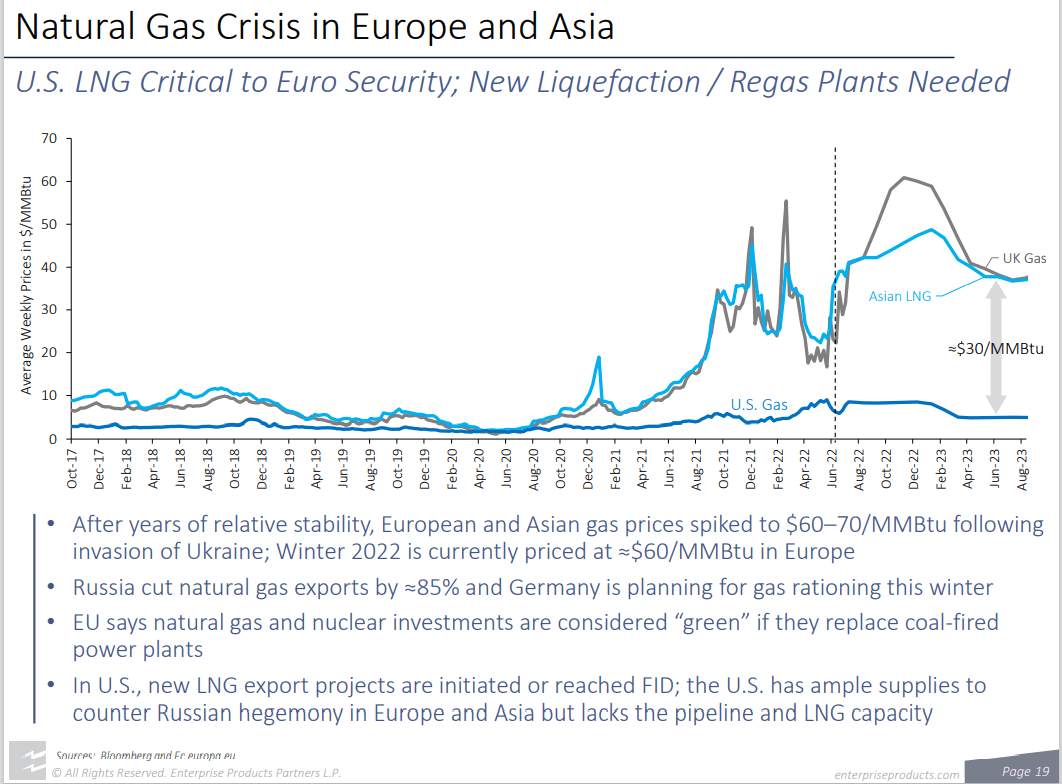
Russia just cut off Nordstream 1 indefinitely until sanctions are lifted.
It’s cutting back gas to a trickle in the Yamal pipeline.
Europe needs to replace Russian gas ASAP.
(Source: EPD investor presentation)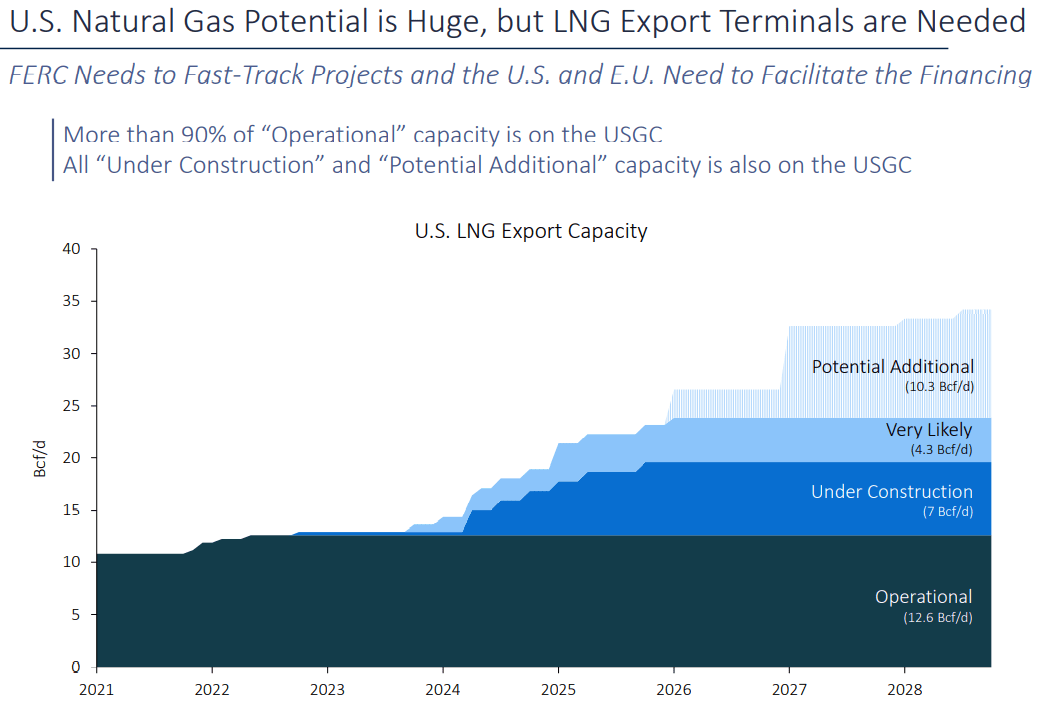
By 2029 the US could triple its LNG export capacity.
- the US = the energy arsenal of democracy
- WWII was won on a sea of US oil
- this war will be won thanks to a fleet of US LNG tankers
What about ESG?
- CalPERS (California’s giant state pension fund) is one of the most ESG-focused fund managers on earth
- and they say it’s a 30 to 40-year transition
- ignore politicians blowing hot air who have no idea how the world really works
(Source: EPD investor presentation)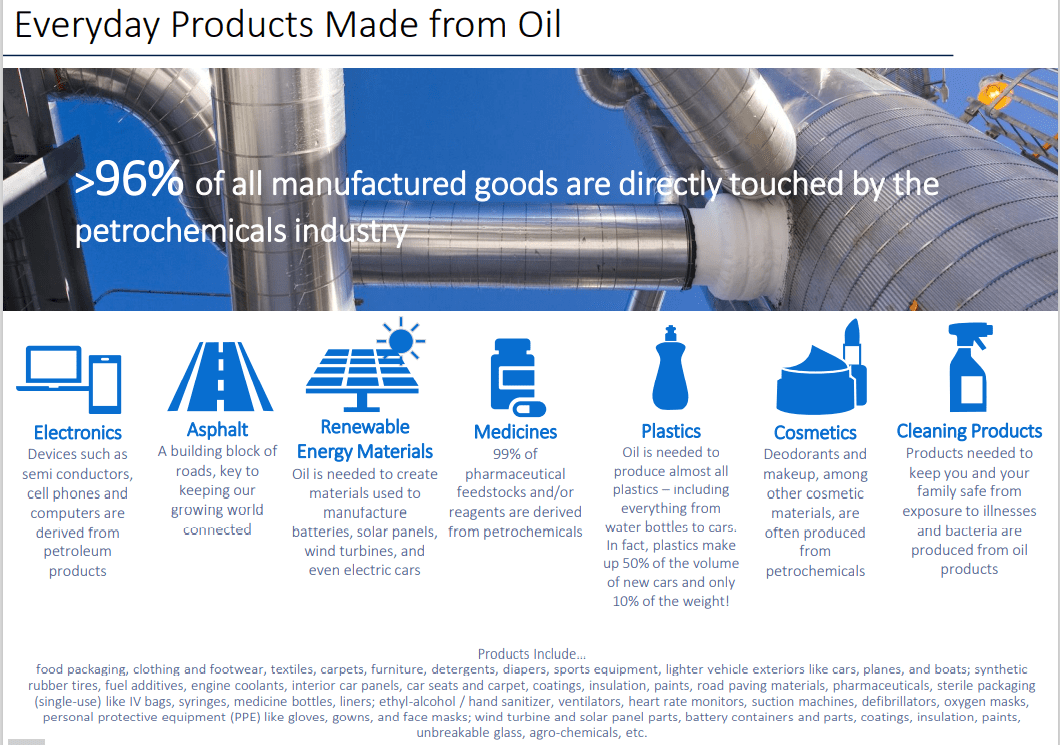
Without petrochemicals, solar and wind shut down, EVs can’t be produced, and modern life ends.
What about CA wanting to ban gas cars by 2035 and 17 states following them on that plan?
CA doesn’t have the energy infrastructure to charge its existing EVs, which make up a fraction of the vehicles in the state.
(Source: EPD investor presentation)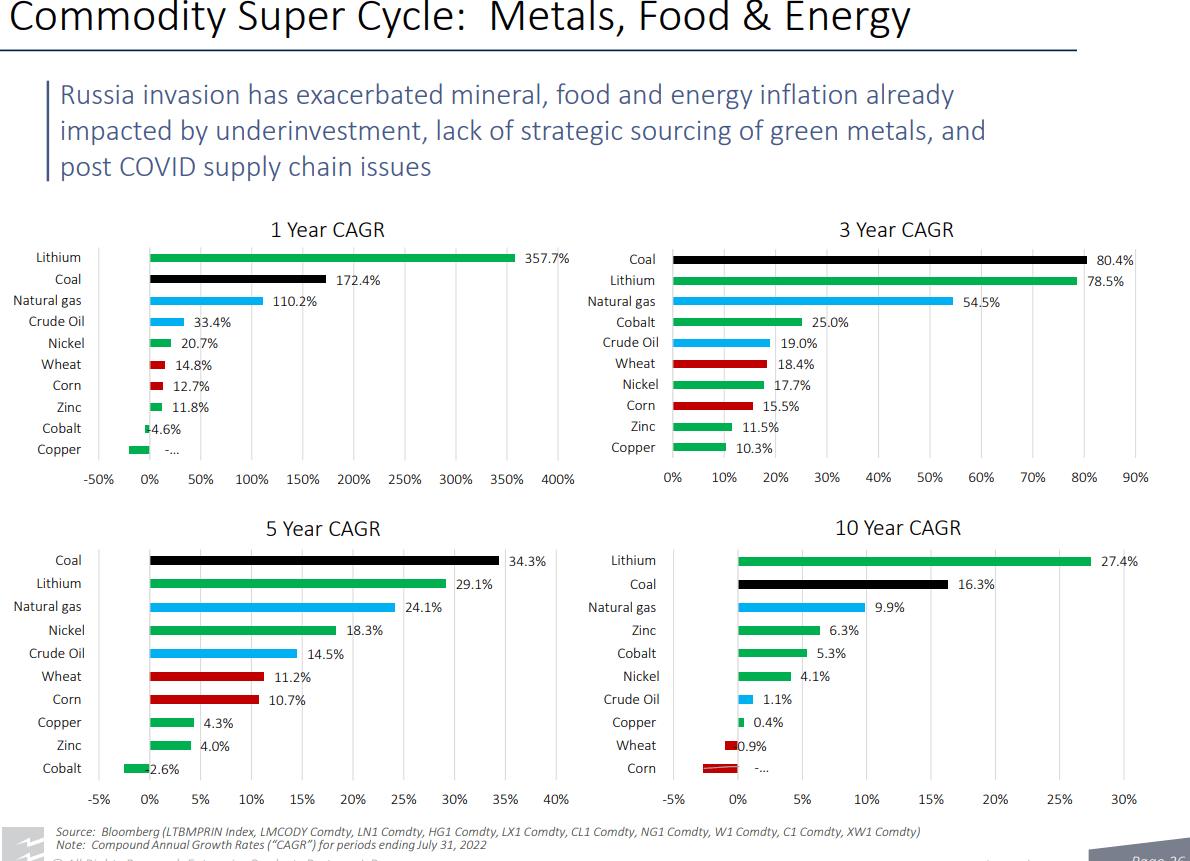
The auto industry doesn’t have the supply chains or capacity to build 100% EVs, not for many years.
- the average new US car is $47K
- the average new US EV is $60K
(Source: EPD investor presentation)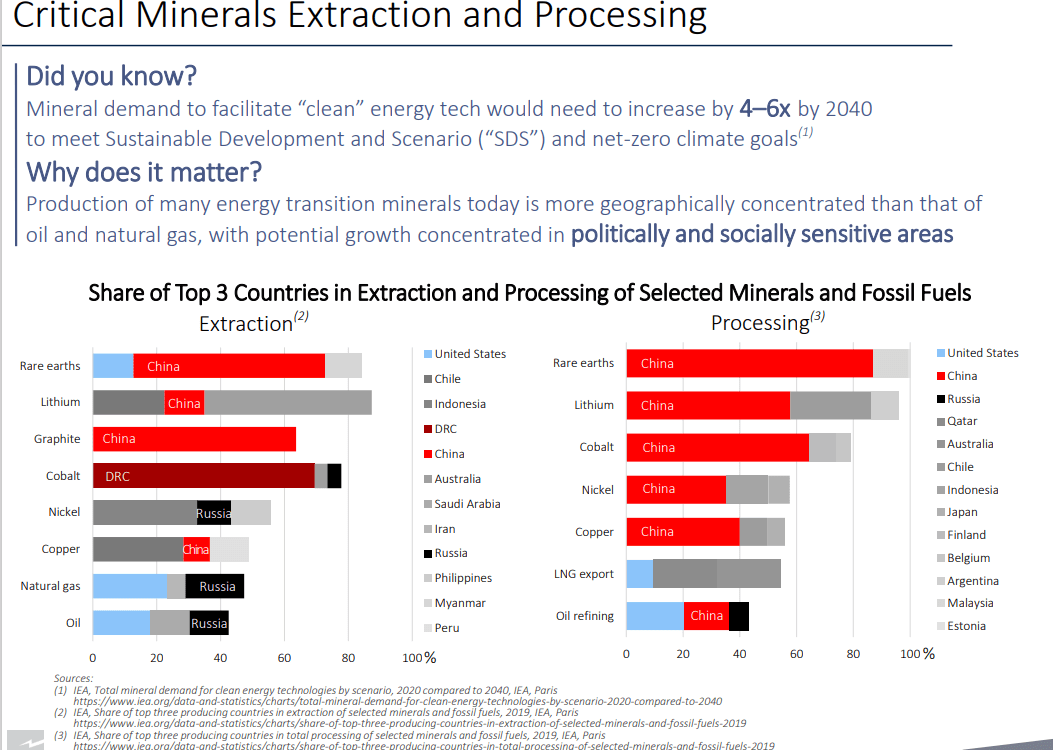
The world needs 5X more mineral extraction per year to achieve Carbon neutrality, including rare earth minerals that China dominates.
- the US has lots of rare earth
- but environmental regulations keep us from processing it
Do the energy transition too quickly, and China becomes Russia to the world and blackmails us all like Putin is doing with the EU today.
- without energy security, there can be no energy transition
- voters won’t freeze just because some politician tells them it’s their moral duty
The average new lithium mine takes 16 years to bring online.
- because of environmental regulations and lawsuits from misguided environmentalists
- the NIMBY effect
- don’t build anything, anywhere, for any reason, ever
(Source: EPD investor presentation)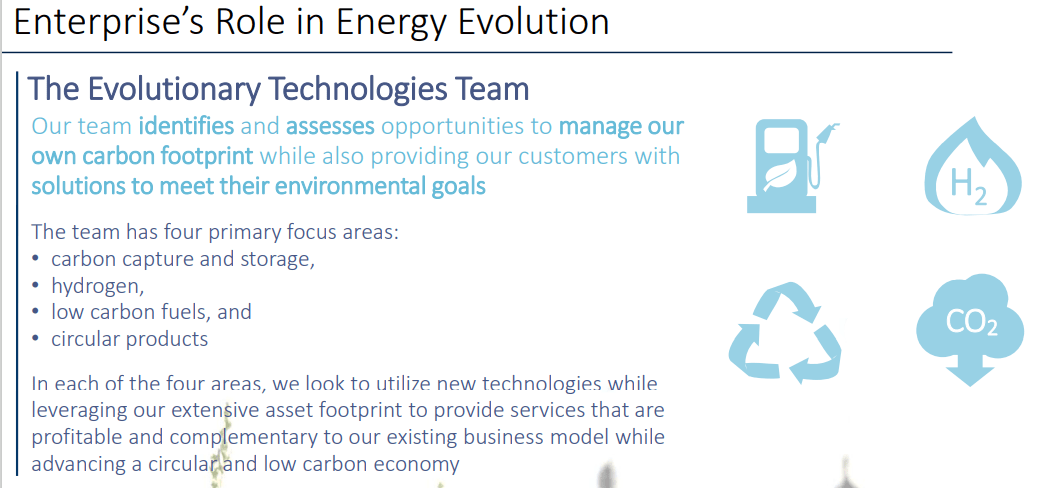
Over time EPD’s energy transition team will help make EPD part of the solution.
In the short-term, they will help the west win the war in Europe and secure the future of democracy.
That’s not how the world works, and misguided eco-dreams have screwed Europe for the next 5 to 10 years.
- according to the Belgian energy minister
- and CEO of Shell
The world can fix itself only through rational and well-reasoned policies
How Enterprise Can Help You Retire In Safety And Splendor
EPD is priced for -2.8% growth, but here’s what analysts actually expect in the short to medium term.
| Metric | 2021 Growth Consensus | 2022 Growth Consensus | 2023 Growth Consensus | 2024 Growth Consensus | 2025 Growth Consensus | 2026 Growth Consensus |
2027 Growth Consensus |
| Sales | 56% | 30% | -1% | -2% | NA | NA | NA |
| Distribution | 2% | 6% (Official) | 4% (25-year streak) | 4% | 1% | 4% | 3% |
| Operating Cash Flow | 41% | -3% | -2% | 1% | NA | NA | NA |
| Distributable Cash Flow | 3% | 15% | 2% | 3% | 1% | 6% | 6% |
| EBITDA | 19% | 10% | 1% | 2% | NA | NA | NA |
| EBIT (operating income) | 31% | 8% | 0% | 3% | NA | NA | NA |
(Source: FactSet Research Terminal)
EPD is 15% sensitive to commodity prices, and it’s been a boom time for oil & gas. Yet even with energy prices expected to come down in the next few years (to $70 by 2027), EPD’s sales and cash flows are expected to grow steadily.
- 85% of cash flow is under long-term contracts
- new projects don’t get built without long-term contracts
- NGL projects with 100% volume capacity locked in for 15 years
(Source: EPD investor presentation)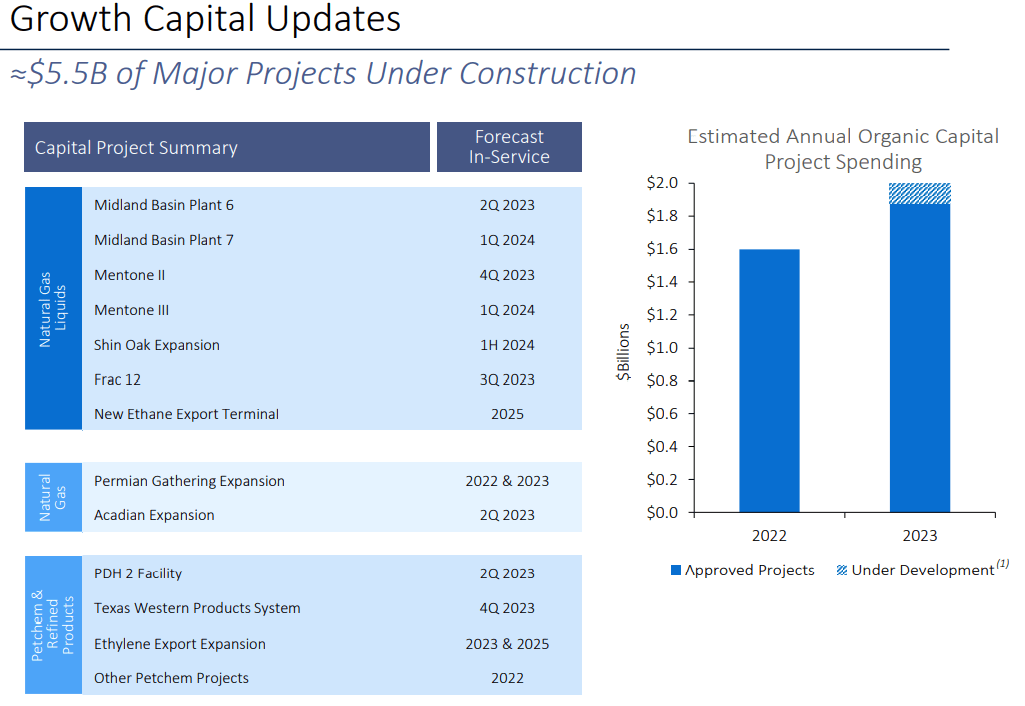
85% of EPD’s growth spending is on Natural Gas Liquids, for which demand is expected to grow steadily past 2050.
(Source: EPD investor presentation)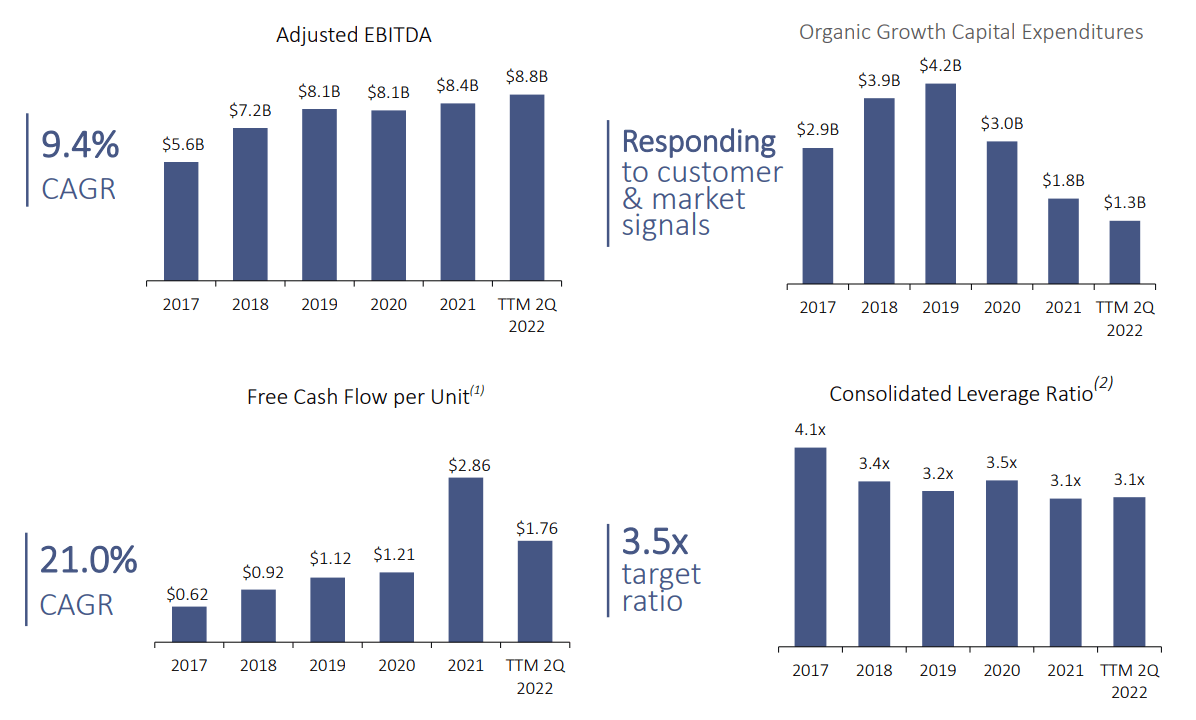
EPD has cut back on growth spending, sending FCF/units soaring to new record highs.
EPD Medium-Term Growth Consensus Forecast
| Year | Sales | Free Cash Flow | EBITDA | EBIT (Operating Income) | Net Income |
| 2021 | $40,807 | $6,297 | $8,381 | $6,315 | $4,634 |
| 2022 | $54,112 | $5,146 | $9,218 | $6,821 | $5,451 |
| 2023 | $56,409 | $5,310 | $9,317 | $6,993 | $5,638 |
| 2024 | $56,006 | $6,693 | $9,497 | $7,089 | $5,793 |
| 2025 | NA | $6,398 | $9,587 | $7,516 | $5,918 |
| 2026 | NA | $7,030 | $9,970 | NA | $6,149 |
| 2027 | NA | $6,733 | $10,583 | NA | $6,683 |
| Annualized Growth 2022-2027 | 11.13% | 1.12% | 3.96% | 3.93% | 6.29% |
| Cumulative 2022-2024 | $166,527 | $17,149 | $28,032 | $20,903 | $16,882 |
(Source: FactSet Research Terminal)
EPD is a steadily growing energy utility, with the bottom line growing at about 4% to 6%.
Analysts expect $17 billion in free cash flow over the next three years.
EPD Margin Consensus Forecast
| Year | FCF Margin | EBITDA Margin | EBIT (Operating) Margin | Net Margin |
| 2021 | 15.4% | 20.5% | 15.5% | 11.4% |
| 2022 | 9.5% | 17.0% | 12.6% | 10.1% |
| 2023 | 9.4% | 16.5% | 12.4% | 10.0% |
| 2024 | 12.0% | 17.0% | 12.7% | 10.3% |
| Annualized Growth 2022-2024 | 12.1% | -0.23% | 0.21% | 1.23% |
(Source: FactSet Research Terminal)
They expect steadily improving margins (not counting 2021’s boom time).
(Source: Gurufocus Premium)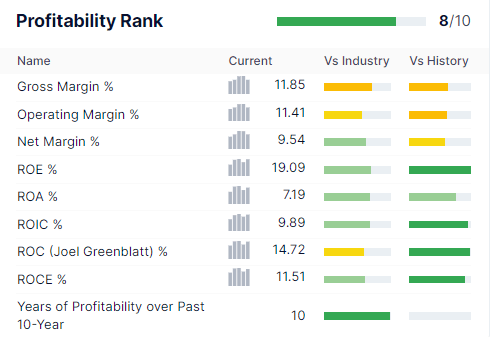
EPD’s historical profitability is in the top 20% of peers and stable for the last quarter century.
Ycharts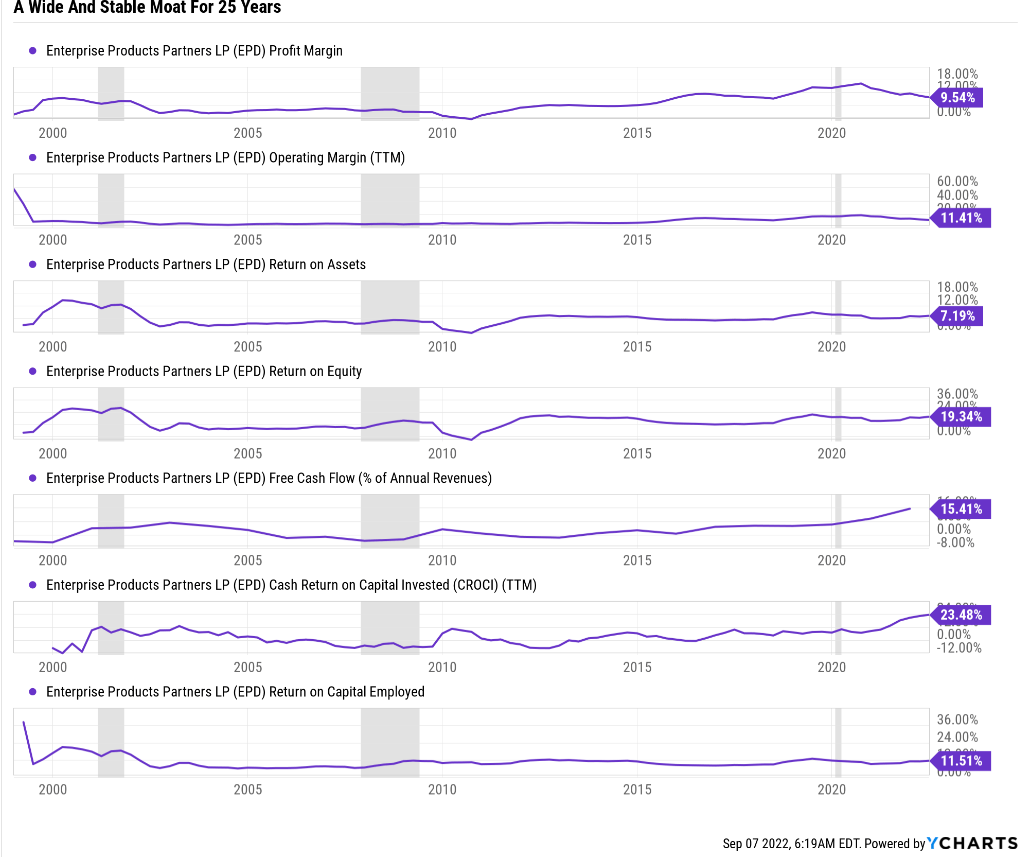
EPD is a wide and stable moat midstream.
EPD Distribution Consensus Forecast
| Year | Dividend Consensus | FCF/Unit Consensus | FCF Payout Ratio | Retained (Post-Distribution) Free Cash Flow | Buyback Potential | Debt Repayment Potential |
| 2022 | $1.90 | $2.67 | 71.2% | $1,678 | 2.93% | 5.9% |
| 2023 | $1.98 | $2.64 | 75.0% | $1,438 | 2.51% | 5.1% |
| 2024 | $2.06 | $2.99 | 68.9% | $2,026 | 3.54% | 7.2% |
| 2025 | $2.08 | $2.98 | 69.8% | $1,961 | 3.43% | 7.0% |
| 2026 | $2.16 | $3.29 | 65.7% | $2,462 | 4.30% | 9.2% |
| 2027 | $2.22 | $3.15 | 70.5% | $2,026 | 3.54% | NA |
| Total 2022 Through 2027 | $12.40 | $17.72 | 70.0% | $11,592.28 | 20.26% | 41.02% |
| Annualized Rate | 3.2% | 3.4% | -0.2% | 3.8% | 3.8% | NA |
(Source: FactSet Research Terminal)
According to rating agencies:
- An 83% DCF payout ratio is safe for midstream
- A 75% payout ratio is safe for utilities
EPD is expected to average 70% FCF payout ratios, giving it $11.6 billion in post-distribution retained free cash flow through 2027.
Enough to pay off 41% of its total debt or buyback up to 20% of its stock at current valuations.
EPD Buyback Consensus Forecast
| Year | Consensus Buybacks ($ Millions) | % Of Shares (At Current Valuations) | Market Cap |
| 2022 | $385 | 0.7% | $57,205 |
| 2023 | $300 | 0.5% | $57,205 |
| 2024 | $300 | 0.5% | $57,205 |
| 2025 | $300 | 0.5% | $57,205 |
| 2026 | $300 | 0.5% | $57,205 |
| 2027 | $300 | 0.5% | $57,205 |
| Total 2022 through 2027 | $1,885 | 3.3% | $57,205 |
| Annualized Rate | 0.56% | Average Annual Buybacks | $314 |
| 1% Buyback Tax | $19 | Average Annual Buyback Tax | $3 |
(Source: FactSet Research Terminal)
Analysts expect modest buybacks averaging $300 million per year through 2027.
EPD Long-Term Growth Outlook
(Source: FactSet Research)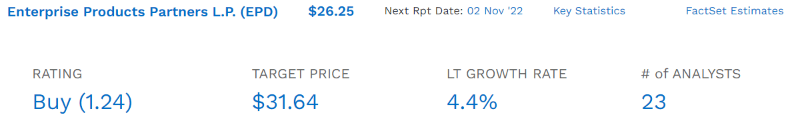
- 3% to 4.4% is the actual growth consensus range (five sources)
- 4.4% median consensus from all 23 analysts
How accurate are analysts at forecasting EPD’s growth in the short-term?
(Source: FAST Graphs, FactSet Research)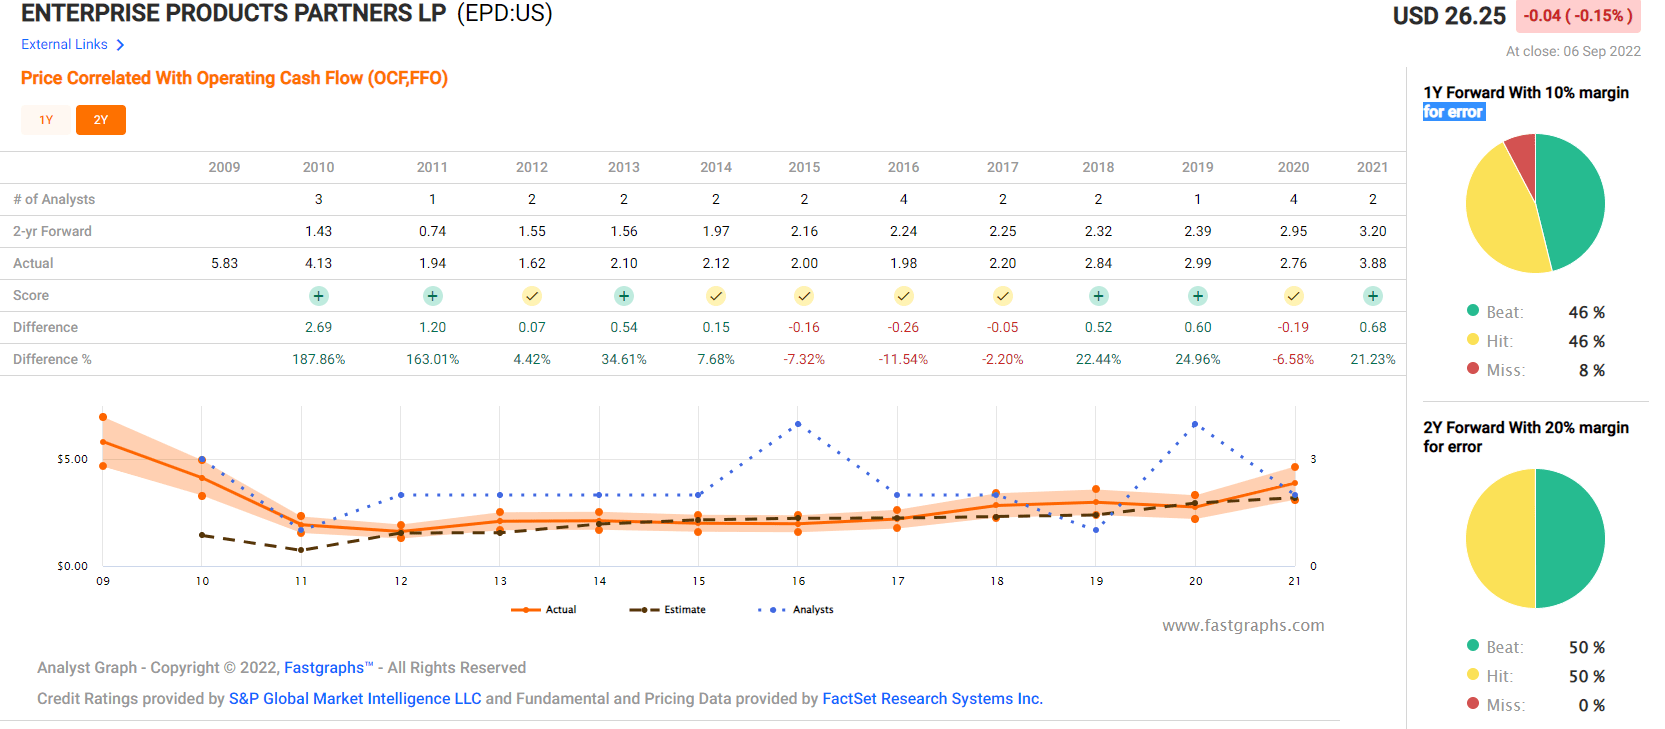
Smoothing for outliers, analyst margins of error on EPD are 5% to the downside and 20% to the upside.
- 4% to 6% CAGR margin-of-error adjusted growth consensus range
(Source: FAST Graphs, FactSet Research) (Source: FAST Graphs, FactSet Research) (Source: FAST Graphs, FactSet Research) (Source: FAST Graphs, FactSet Research)
Analysts expect growth similar to the last 14 years.
What does this potentially mean for long-term EPD investors?
| Investment Strategy | Yield | LT Consensus Growth | LT Consensus Total Return Potential | Long-Term Risk-Adjusted Expected Return | Long-Term Inflation And Risk-Adjusted Expected Returns | Years To Double Your Inflation & Risk-Adjusted Wealth |
10-Year Inflation And Risk-Adjusted Expected Return |
| Enterprise Products Partners | 7.2% | 4.4% | 11.6% | 8.1% | 5.9% | 12.2 | 1.77 |
| High-Yield (SCHD) | 3.4% | 8.7% | 12.1% | 8.5% | 6.3% | 11.5 | 1.83 |
| Dividend Aristocrats | 2.4% | 8.6% | 11.0% | 7.7% | 5.5% | 13.2 | 1.70 |
| S&P 500 | 1.7% | 8.5% | 10.2% | 7.1% | 4.9% | 14.6 | 1.62 |
| Nasdaq | 0.9% | 12.6% | 13.4% | 9.4% | 7.2% | 10.0 | 2.00 |
(Source: DK Research Terminal, Morningstar, Factset, Ycharts)
Analysts expect about 11.6% long-term returns from EPD, better than the aristocrats and S&P 500 and almost as good as lower-yielding SCHD.
Total Returns Since 1999
(Source: Portfolio Visualizer Premium) (Source: Portfolio Visualizer Premium)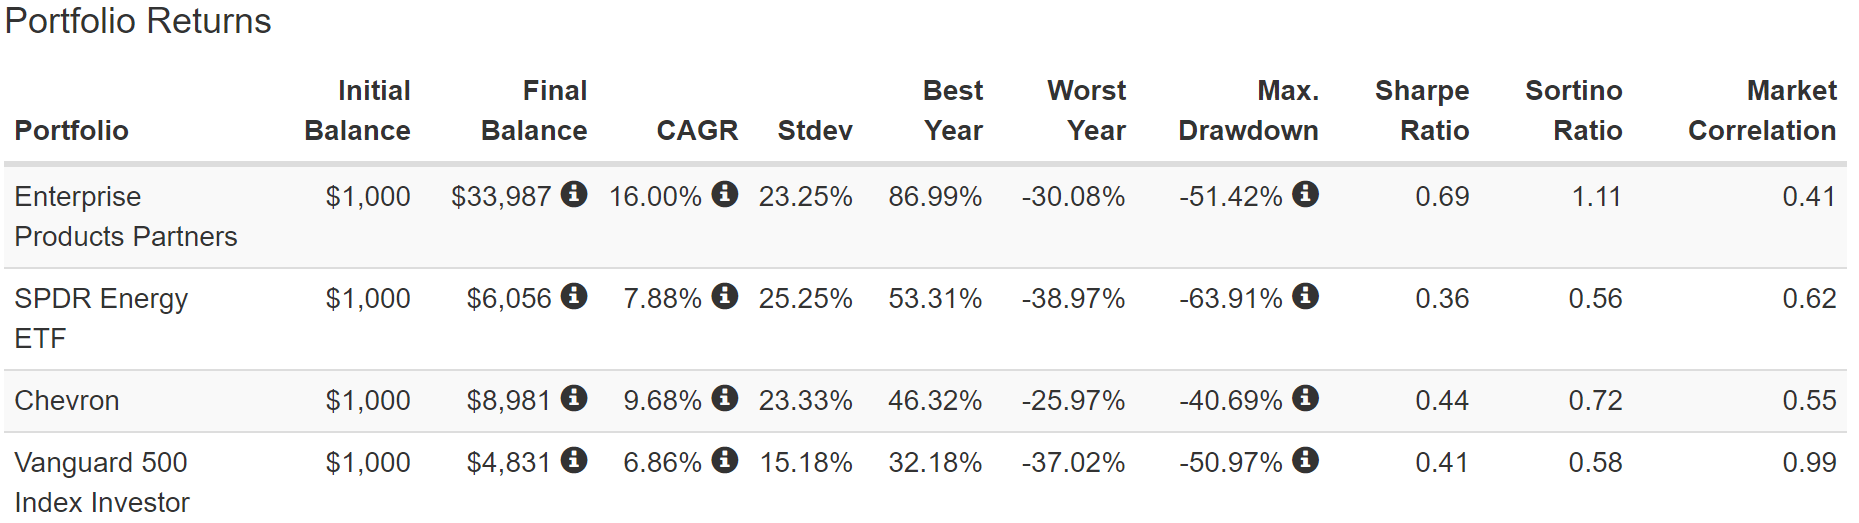
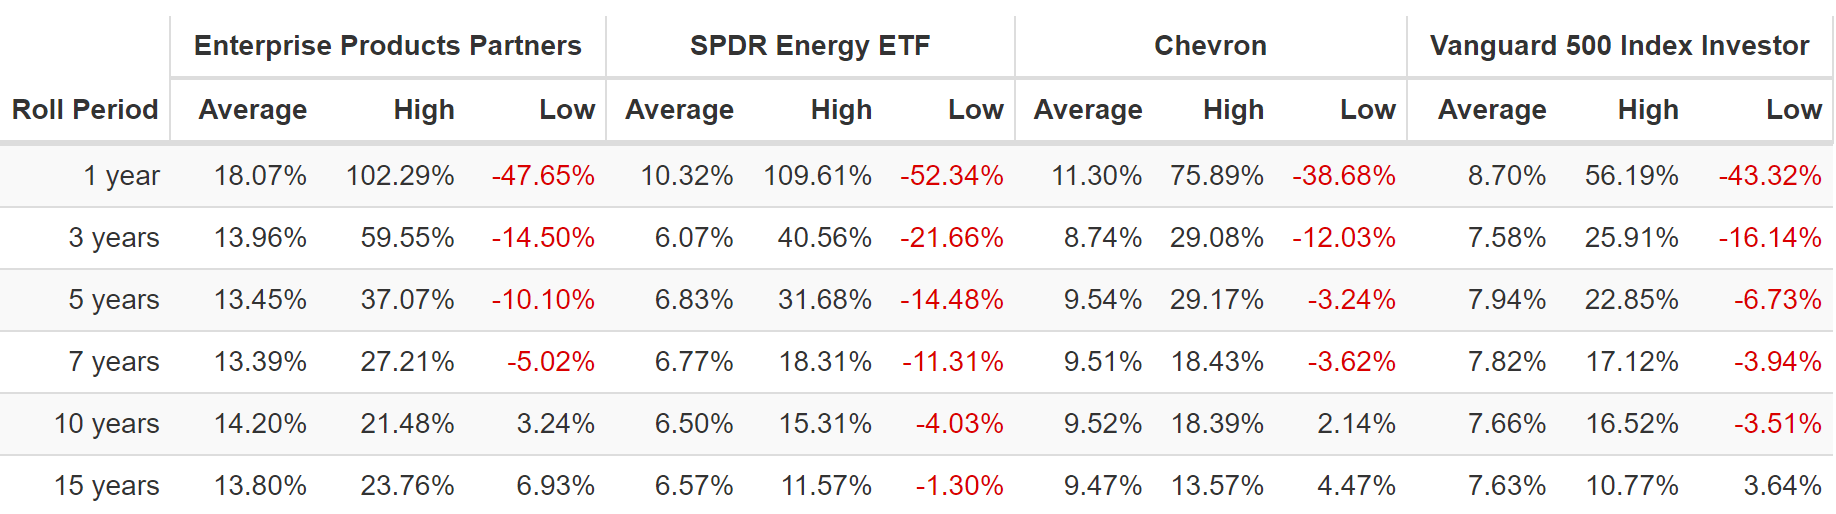
EPD is a proven market and sector beater, a far better long-term high-yield investment than Chevron, the gold standard oil company aristocrat.
What could this mean for your portfolio over time?
Inflation-Adjusted Consensus Total Return Potential: $1,000 Initial Investment
| Time Frame (Years) | 8.0% CAGR Inflation-Adjusted S&P 500 Consensus | 8.8% Inflation-Adjusted Dividend Aristocrats Consensus | 9.4% CAGR Inflation-Adjusted EPD Consensus | Difference Between Inflation And Risk-Adjusted EPD Consensus And S&P Consensus |
| 5 | $1,467.97 | $1,523.16 | $1,565.63 | $97.66 |
| 10 | $2,154.93 | $2,320.01 | $2,451.20 | $296.27 |
| 15 | $3,163.37 | $3,533.75 | $3,837.68 | $674.31 |
| 20 | $4,643.72 | $5,382.46 | $6,008.39 | $1,364.67 |
| 25 | $6,816.84 | $8,198.35 | $9,406.93 | $2,590.09 |
| 30 (retirement time frame) | $10,006.90 | $12,487.39 | $14,727.79 | $4,720.89 |
| 35 | $14,689.81 | $19,020.28 | $23,058.29 | $8,368.48 |
| 40 | $21,564.18 | $28,970.91 | $36,100.79 | $14,536.62 |
| 45 | $31,655.53 | $44,127.31 | $56,520.55 | $24,865.02 |
| 50 | $46,469.30 | $67,212.91 | $88,490.36 | $42,021.06 |
| 55 | $68,215.45 | $102,375.96 | $138,543.31 | $70,327.85 |
| 60 (investing lifetime) | $100,138.11 | $155,934.88 | $216,907.79 | $116,769.68 |
| 100 (Institutional time frame) | $2,159,396.10 | $4,517,575.80 | $7,830,543.45 | $5,671,147.35 |
(Source: DK Research Terminal, FactSet)
EPD’s far superior yield and modestly higher long-term return potential mean a modest investment today could grow into a life-changing fortune in several decades.
| Time Frame (Years) | Ratio Dividend Aristocrats/S&P Consensus | Ratio Inflation And EPD Consensus vs. S&P consensus |
| 5 | 1.04 | 1.07 |
| 10 | 1.08 | 1.14 |
| 15 | 1.12 | 1.21 |
| 20 | 1.16 | 1.29 |
| 25 | 1.20 | 1.38 |
| 30 | 1.25 | 1.47 |
| 35 | 1.29 | 1.57 |
| 40 | 1.34 | 1.67 |
| 45 | 1.39 | 1.79 |
| 50 | 1.45 | 1.90 |
| 55 | 1.50 | 2.03 |
| 60 | 1.56 | 2.17 |
| 100 | 2.09 | 3.63 |
(Source: DK Research Terminal, FactSet)
Over a retirement period, EPD could potentially deliver 50% better inflation-adjusted turns over the S&P 500 and 20% more than the dividend aristocrats over the next 30 years.
Reason Four: A Wonderful Company At An Anti-Bubble Price
(Source: FAST Graphs, FactSet) (Source: FAST Graphs, FactSet) (Source: FAST Graphs, FactSet)
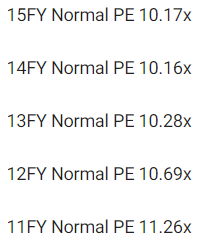
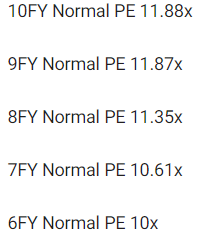
For 20 years, outside of bear markets and bubbles, millions of income investors have consistently paid between 10 and 12X cash flow for EPD.
- 91% statistical probability that this approximates intrinsic value
| Metric | Historical Fair Value Multiples (all years) | 2021 | 2022 | 2023 | 2024 |
12-Month Forward Fair Value |
| 5-Year Average Yield | 6.99% | $26.04 | $27.18 | $27.18 | $29.47 | |
| 13-Year Median Yield | 5.91% | $30.80 | $32.15 | $32.15 | $34.86 | |
| 24-Year Average Yield | 6.68% | $27.25 | $28.44 | $28.44 | $30.84 | |
| Operating Cash Flow | 11.07 | $42.95 | $40.74 | $40.74 | $40.96 | |
| Average | $30.57 | $31.35 | $31.35 | $33.48 | $31.35 | |
| Current Price | $26.25 | |||||
|
Discount To Fair Value |
14.12% | 16.26% | 16.26% | 21.60% | 16.26% | |
|
Upside To Fair Value (NOT Including Dividends) |
16.44% | 19.42% | 19.42% | 27.55% | 19.42% (26% including distribution) | |
| 2022 OCF | 20223 OCF | 2022 Weighted OCF | 2023 Weighted OCF | 12-Month Forward OCF | 12-Month Average Fair Value Forward P/OCF |
Current Forward P/OCF |
| $3.68 | $3.68 | $1.13 | $2.55 | $3.68 | 8.52 | 7.13 |
I conservatively estimate EPD’s historical fair value at 8.5X cash flow, and today it trades at 7.1, an anti-bubble valuation.
| Rating | Margin Of Safety For Low-Risk 12/13 Quality Super SWANs | 2022 Fair Value Price | 2023 Fair Value Price |
12-Month Forward Fair Value |
| Potentially Reasonable Buy | 0% | $31.35 | $31.35 | $31.35 |
| Potentially Good Buy | 10% | $28.21 | $28.21 | $28.21 |
| Potentially Strong Buy | 20% | $25.08 | $25.08 | $25.08 |
| Potentially Very Strong Buy | 30% | $19.75 | $21.94 | $21.94 |
| Potentially Ultra-Value Buy | 40% | $18.81 | $18.81 | $18.81 |
| Currently | $26.25 | 16.26% | 16.26% | 16.26% |
| Upside To Fair Value (Not Including Dividends) | 19.42% | 19.42% | 19.42% |
For anyone comfortable with its risk profile, EPD is a potentially good buy.
Risk Profile: Why Enterprise Isn’t Right For Everyone
There are no risk-free companies, and no company is right for everyone. You have to be comfortable with the fundamental risk profile.
EPD’s Risk Profile Includes
- heavy bet on NGLs (nearly 85% of growth budget)
- regulatory/political risk (pertaining to interstate projects)
- litigation risk (pertaining to interstate projects and industrial accidents)
- industrial accident risk (can cost over $1 billion each to clean up)
- green energy transition execution risk
- M&A execution risk
- talent retention risk
- supply chain disruption risk (causing havoc globally right now)
- cyber security risk: hackers and ransomware (pipelines are now targets)
- virtually no say in how the LP is run
How do we quantify, monitor, and track such a complex risk profile? By doing what big institutions do.
Long-Term Risk Analysis: How Large Institutions Measure Total Risk
- see the risk section of this video to get an in-depth view (and link to two reports) of how DK and big institutions measure long-term risk management by companies
EPD Long-Term Risk-Management Consensus
| Rating Agency | Industry Percentile |
Rating Agency Classification |
| Morningstar/Sustainalytics 20 Metric Model | 94.3% |
28.2/100 Medium-Risk |
| Reuters’/Refinitiv 500+ Metric Model | 49.2% | Good |
| FactSet | 50.0% |
Average, Stable Trend |
| Morningstar Global Percentile (All 15,000 Rated Companies) | 70.1% | Good |
| Consensus | 66% |
Low Risk, Above-Average Risk-Management, Stable Trend |
(Sources: Morningstar, FactSet, Reuters)
EPD’s Long-Term Risk Management Is The 229th Best In The Master List (54th Percentile)
| Classification | Average Consensus LT Risk-Management Industry Percentile |
Risk-Management Rating |
| S&P Global (SPGI) #1 Risk Management In The Master List | 94 | Exceptional |
| Strong ESG Stocks | 78 |
Good – Bordering On Very Good |
| Foreign Dividend Stocks | 75 | Good |
| Ultra SWANs | 71 | Good |
| Low Volatility Stocks | 68 | Above-Average |
| Dividend Aristocrats | 67 | Above-Average |
| Enterprise Products Partners | 66 | Above-Average |
| Dividend Kings | 63 | Above-Average |
| Master List average | 62 | Above-Average |
| Hyper-Growth stocks | 61 | Above-Average |
| Monthly Dividend Stocks | 60 | Above-Average |
| Dividend Champions | 57 | Average bordering on above-average |
(Source: DK Research Terminal)
EPD’s risk-management consensus is in the top 46% of the world’s highest quality companies and similar to that of such other blue-chips as
- Emerson Electric (EMR): Ultra SWAN dividend king
- Illinois Tool Works (ITW): Ultra SWAN dividend king
- Coca-Cola (KO): Ultra SWAN dividend king
- Medtronic (MDT): Ultra SWAN dividend aristocrat
- Nike (NKE): Ultra SWAN
The bottom line is that all companies have risks, and EPD is above-average, at managing theirs.
How We Monitor EPD’s Risk Profile
- 23 analysts
- 3 credit rating agencies
- 6 total risk rating agencies
- 29 experts who collectively know this business better than anyone other than management
- and the bond market for real-time fundamental risk updates
When the facts change, I change my mind. What do you do, sir?” – John Maynard Keynes
There are no sacred cows at iREIT or Dividend Kings. Wherever the fundamentals lead, we always follow. That’s the essence of disciplined financial science, the math behind retiring rich and staying rich in retirement.
Bottom Line: Buy Enterprise Today And Potentially Retire Rich Tomorrow
Let me be clear: I’m NOT calling the bottom in EPD (I’m not a market-timer).
Super SWAN doesn’t mean “can’t fall hard in a bear market.”
Fundamentals are all that determine safety and quality, and my recommendations.
- over 30+ years, 97% of stock returns are a function of pure fundamentals, not luck
- in the short-term, luck is 33X as powerful as fundamentals
- in the long-term, fundamentals are 33X as powerful as luck
While I can’t predict the market in the short term, here’s what I can tell you about EPD
- one of the highest quality ultra-high-yielding stocks on earth
- 7.2% very safe yield with 4.4% long-term growth potential
- 11.6% CAGR long-term total return potential, better than dividend aristocrats or the S&P 500
- 16% historically undervalued, a potentially good buy
- 7.1X cash flow (priced for -2.8% growth)
- 120% consensus return potential over the next five years, 16% CAGR, 2X more than the S&P 500
- 2X better risk-adjusted expected returns of the S&P 500 over the next five years.
- 4X more income potential over the next five years
Here’s what else I can tell you. If you buy anti-bubble blue-chips in this bear market, you’re likely to feel smart in 3 years and like a stock market genius in 10.
Charlie Bilello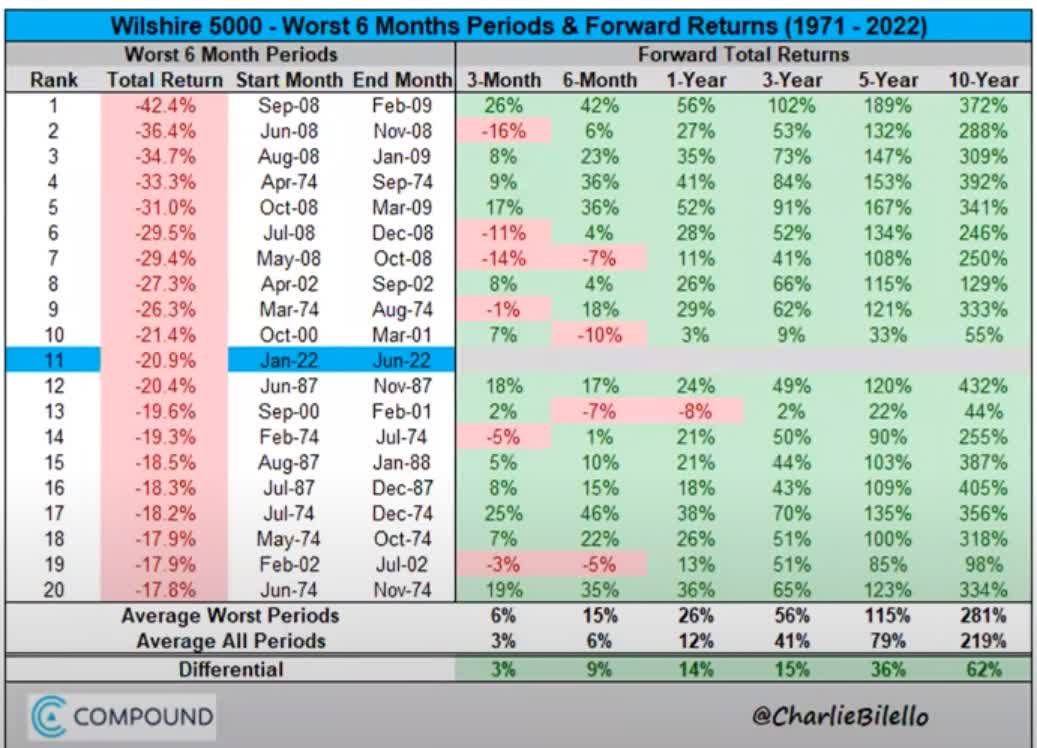
Never in history have stocks fallen 18+% in six months and not delivered positive returns within 3 years. And the average 10-year gain following such bear markets is 281%, or almost 4X in a decade.
And guess what? Anti-bubble blue-chip bargains like EPD? They can do even better than that.
Total Returns March 2000 To October 2014 (The Nasdaq’s Lost 15 Years)
Source: Portfolio Visualizer Premium)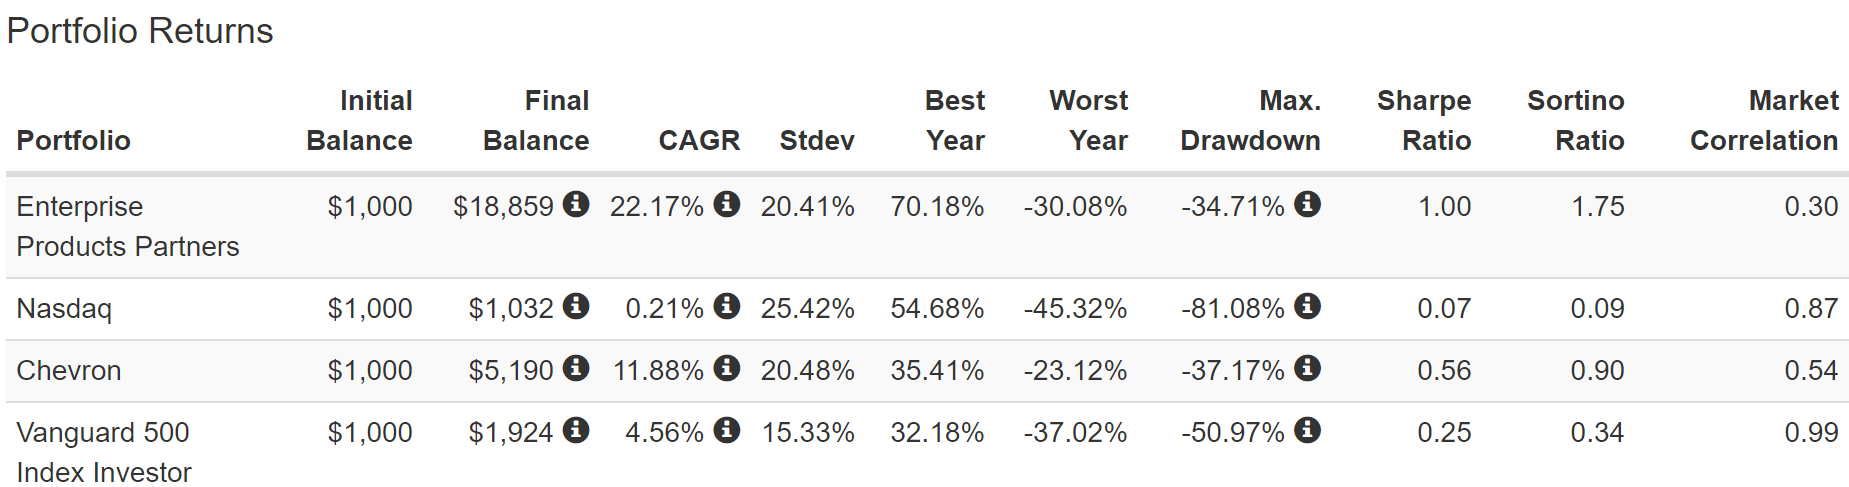
After five years in which value was dead, and all anyone cared about was growth at any cost (sound familiar), the worst US bubble in history ended in spectacular fashion.
It took the Nasdaq almost 15 years to break even (not counting inflation), while value titans like EPD delivered 19X returns.
I’m not predicting that growth stocks will languish for a decade; today’s Nasdaq looks nothing like the overvalued one of 2000.
But the point is that even in the worst times for stocks, there are always winners you can count on to deliver both generous, safe, and growing yields as well as solid or even extraordinary returns
So if you are tired of this market volatility, get over it; we probably have a lot more coming this year.
But if you’re tired of worrying about your portfolio, world-beater blue-chips like Enterprise can help.
Because if you focus on what counts in the long-term, what determines if you retire in comfort, splendor, or not at all, then you don’t need luck to make your retirement dreams come true.
You can make your own luck by buying the world’s best high-yield blue-chips in this bear market and retire in safety and splendor.
Be the first to comment