

Pgiam/iStock via Getty Images
Investment Strategy
Market prices are being forecast every day by self-protective, disruptive actions taken by MMs negotiating big-volume block trades for institutional investors managing their $Billion equity investment portfolios.
Records of market outcomes following such daily forecasts make their trends visually follow-able and their rewards and risk exposures explicit in graphic form. The pictures seen below are the negotiated forecast outcomes, not some hoped-for tools to guess at what may happen later. While there are no guarantees of the future, examples in hand are far better than hypotheses of assertion without evidence.
Moreover, the outcomes follow identical strategy disciplines for all stocks, making expectations of forecasts directly comparable. In that way personal preferences can be carefully followed.
The primary stock of interest in this article is Enphase Energy, Inc (NASDAQ:ENPH).
Company description
“Enphase Energy, Inc., together with its subsidiaries, designs, develops, manufactures, and sells home energy solutions for the solar photovoltaic industry in the United States and internationally. The company offers semiconductor-based microinverter, which converts energy at the individual solar module level, and combines with its proprietary networking and software technologies to provide energy monitoring and control services. It also offers AC battery storage systems; Envoy communications gateway; and Enlighten cloud-based monitoring service, as well as other accessories. The company sells its solutions to solar distributors; and directly to large installers, original equipment manufacturers, strategic partners, and homeowners, as well as through its legacy product upgrade program or online store. Enphase Energy, Inc. was incorporated in 2006 and is headquartered in Fremont, California.” – Source: Yahoo Finance
Yahoo Finance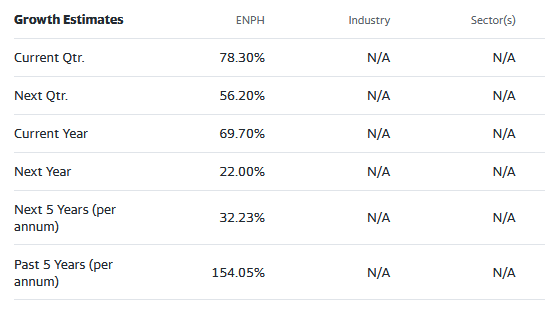
We start with comparisons of reward prospects and risk exposures.
Figure 1
blockdesk.com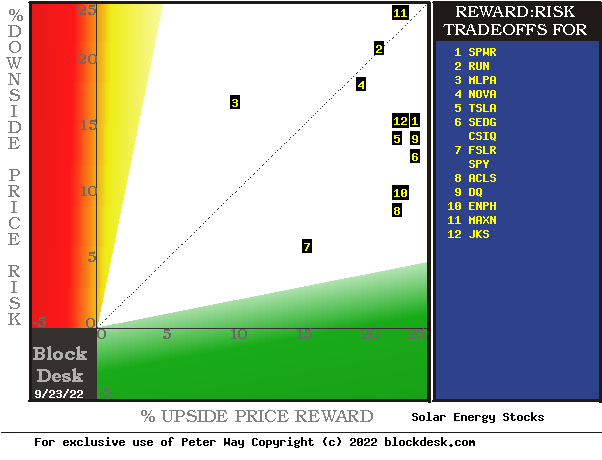
(used with permission)
Expected rewards for these securities are the greatest gains from current closing market price seen worth protecting short positions. Their measure is on the horizontal green scale.
The risk dimension is of actual price drawdowns at their most extreme point while being held in previous pursuit of upside rewards similar to the ones currently being seen. They are measured on the red vertical scale.
Both scales are of percent change from zero to 25%. Any stock or ETF whose present risk exposure exceeds its reward prospect will be above the dotted diagonal line. Capital-gain attractive to-buy issues are in the directions down and to the right.
Our principal interest is in ENPH at location [10]. A “market index” norm of reward~risk tradeoffs is offered by SPY at [7]. The most appealing (to own) by this Figure 1 view may be ACLS at [8]. But other considerations in Figure 3 will show why this may not be so.
Comparing features of Alternative Stocks: Utilities
Figure 2
blockdesk.com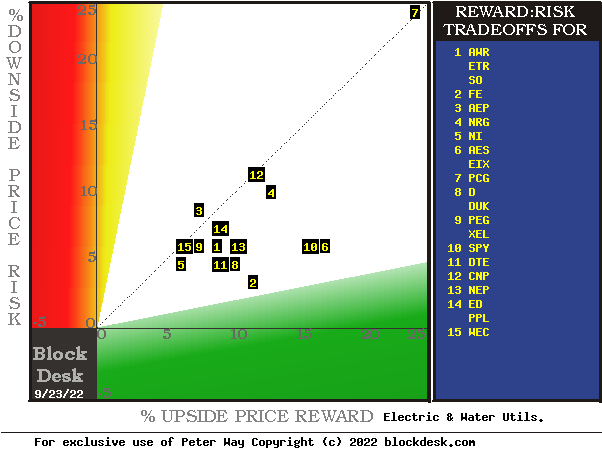
used with permission
The Figure 2 map provides a good parallel to the “business as usual” which pervaded the auto industry before Tesla (TSLA). The 21st century equities markets thrive on technological advance, but there are often some laggards.
How do you want your capital to perform, scared? Then you may likely miss ENPH’s likely coming +20%+ near-term capital gain.
The Figure 1 map provides a good visual comparison of the two most important aspects of every equity investment in the short term. There are other aspects of comparison which this map sometimes does not communicate well, particularly when general market perspectives like those of SPY are involved, as done in Figure 2 at location [10]. And where questions of “how likely” are present other comparative tables, like Figure 3, may be useful.
Yellow highlighting of the table’s cells emphasizes factors important to securities valuations and the security ENPH, most promising of near capital gain as ranked in column [R]. Pink cell fills indicate inadequate proportions of essential performance competitive requirements, as in [T] where [F] Risk exposure exceeds [E] Reward opportunity.
Figure 3
blockdesk.com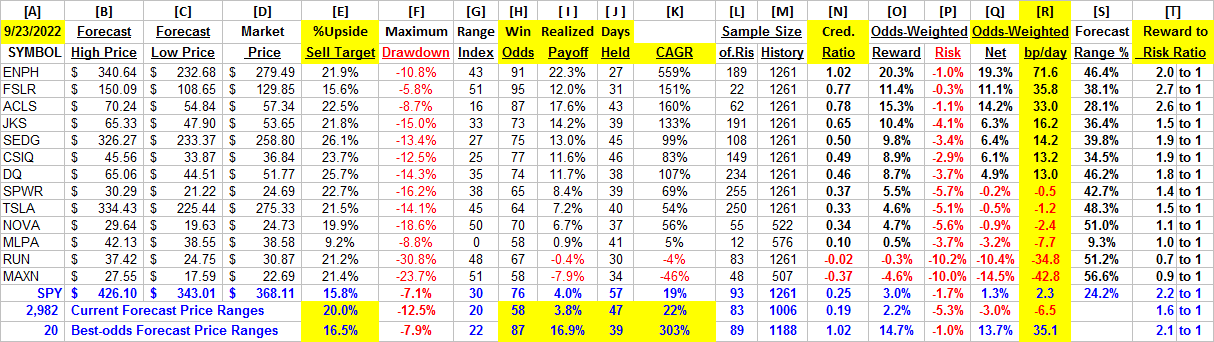
used with permission
The price range forecasts implied by the day’s transactions activity are in columns [B] and [C], typically surrounding the day’s closing price [D]. They produce a measure of risk and reward we label the Range Index [G], the percentage of the B to C forecast range which lays between D and C.
Today’s Gs are used for each stock’s past 5-years of daily forecast history [M] to count and average prior [L] experiences. Fewer than 20 of Ls or a shorter than 3 years history of Ms are regarded as statistically inadequate.
[H] tells what percentage of the L positions were completed profitably, either at range-top prices or by market close above day after forecast close price entry costs. The Net realization of all Ls is shown in [I].
[I] fractions get weighted by H and 100-H in [O, P, & Q] appropriately conditioned by [J] to provide investment ranking [R] in CAGR units of basis points per day.
The parade of [H] profitable positions at 10 out of every 11 is excellent.
Comparable data for the S&P 500 Market Index ETF and for the over 3,000 other equities population with comparable price forecasts provide perspective to the Covid stocks group outcomes. Top-ranked issues from that population support ENPH’s excellent CAGR score.
Recent Trends of Price Range Forecasts for ENPH
blockdesk.com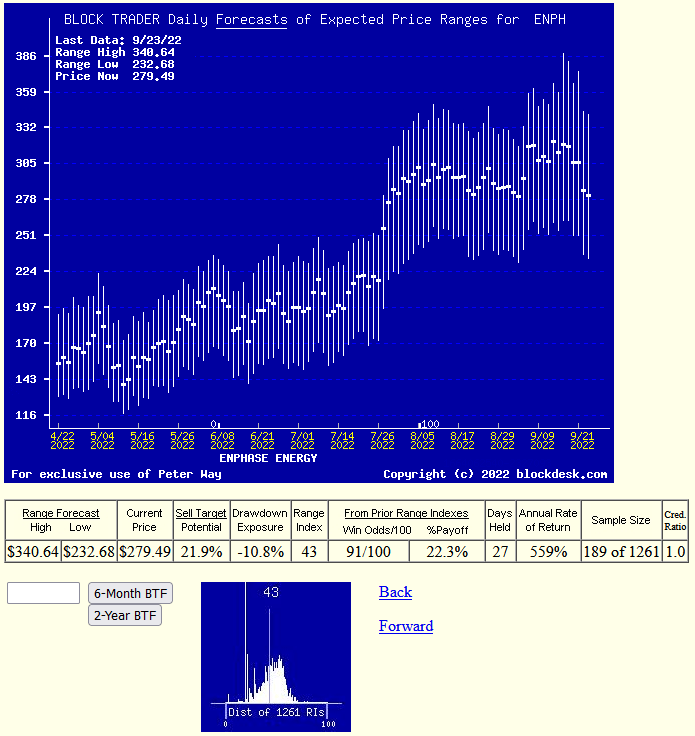
(used with permission)
This is not a typical “technical analysis chart” of simple historical (only) observations. Instead it pictures the daily updated Market-Maker price range forecasts implied by live real-capital commitments in real time.
Its communicative value is present here by visual comparisons of the proportions of upside and downside price change expectations at each forecast date. Expectations of the market-making community, as influenced by the actions of an interested and involved big-$ institutional investing participants.
Those forecasts are typically resolved in time horizons of less than a half year, and often in two months or shorter. This one states that of the 189 prior forecasts like today’s, some 10 of every 11 were profitable, completed in 27 market-days (under 6 weeks) profitably at average +21.9% gains, a CAGR rate of 559%. No promises, just fun with history.
Conclusion
Comparison of the performances of near-term Market-Maker forecasts for Enphase Energy with similar forecasts of other technologically-active securities pursued by investor referencing, it seems clear that this stock can be an attractive investment choice for investors pursuing near-term capital gain strategies.
Be the first to comment