

Tara Moore/DigitalVision via Getty Images
Thesis
Readers familiar with my writing know that I am bullish on the overall energy sector under the current conditions. My view is that the oil price is overdue for a secular appreciation in the years to come. Oil prices have lagged behind inflation in the past 10 years, and the rallies we are experiencing now might be the starting point of an expansion cycle. Energy Transfer (NYSE:ET) and Suncor Energy (NYSE:SU), besides enjoying the support from oil price expansion as the rest of the sector, provide several additional advantages.
Firstly, both have their assets primarily located in North America. And as a result, they provide an effective hedge for investors against the ongoing geopolitical risks, mainly the Russian/Ukraine situation. SU, as a Canadian company, provides further geographical diversification for investors whose exposures are concentrated in the U.S. As Russia threatens to cut off all gas supplies to the “collective West”, such geographical hedging is especially timely. Both of them would be top candidates to replace the Russian supply should this threat materializes because of their scale and political compatibility with European nations.
Secondly, both have relatively well-diversified revenue streams to weather the ongoing uncertainties. ET, as a pipeline and storage business, offers reduced sensitivity to oil and natural gas prices gyrations. SU is an integrated player. It conducts exploration and produces natural gas and crude oil, transports and refines them, and also engages in the production of petrochemicals. Combined with its scale, it is in a good position to withstand turmoil in both upstream and downstream segments.
As such, I really do not see anything wrong with owning both. However, for investors who are more interested in the dividends aspects of these stocks, a bit more consideration is needed to pick the one better suited for individual timelines and needs. Both provide generous current dividends as seen from the chart below, although ET’s dividend of 6.58% is almost higher than SU’s 4.58% by a half (44% to be exact). And we will examine the implications of such differences immediately below. But my overall conclusion is that both are excellent dividend stocks. It is a matter of if you want to eat the cakes now (pick ET in this case) or later (pick SU in this case).
Source: Seeking Alpha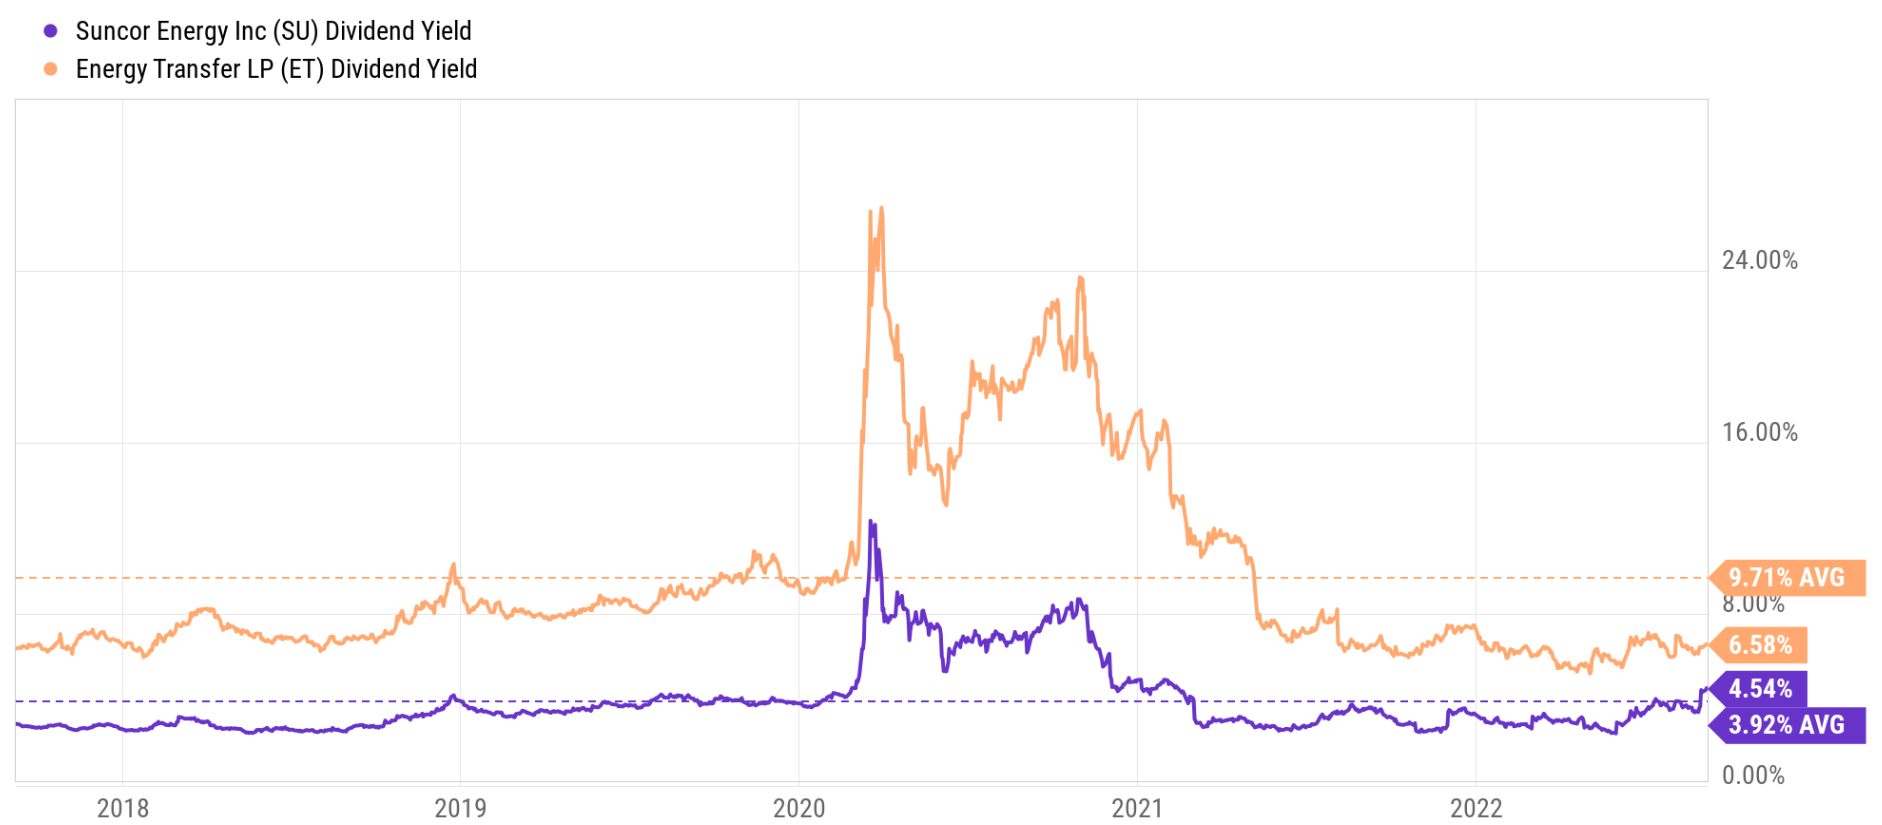
Total shareholder yield
For investors who do not need current income yet (like myself), I prefer to look at the total shareholder yield instead of the dividend yields as shown in the chart below. The chart compares the net common buyback yield from both ET and SU. for readers new to the concept, the buyback yield is the amount spent on repurchases divided by the market cap of a company (just like dividend yield is the total amount of dividends paid divided by the market cap).
As you can see, SU’s buyback yield has been on average 3.6% in the long-term, almost on par with its 3.9% average dividend yield seen above. Currently, its buyback yield stands at a remarkable 8.9%, far exceeding its dividend yield of 4.54%. And therefore, the total shareholder yield is 13.4% (8.9% buybacks plus 4.5% dividends). In contrast, ET has been consistently diluting its shares (which is totally normal for a partnership), as reflected by the negative buyback yield. And therefore, its higher dividend yields (on average 9.7% in the past decade) have been partially offset by the share dilution.
Investors who do not need immediate income could be better served by share buybacks, for several reasons. You can always sell some shares (to take advantage of the share price appreciation created by the repurchase) and effectively pay yourself a (or an additional) dividend. This way, you have better control over the timing, amount, and tax issues yourself. For example, you can pick when to sell and which shares to sell to minimize your taxes. Indeed, tax consideration is ALWAYS the first thing I consider in investment decisions, and the first I suggest our readers and marketplace members to consider. Everything else in investing always involves an element of uncertainty out of our control, but tax is an issue we can calculate and control with good certainty.
Source: Seeking Alpha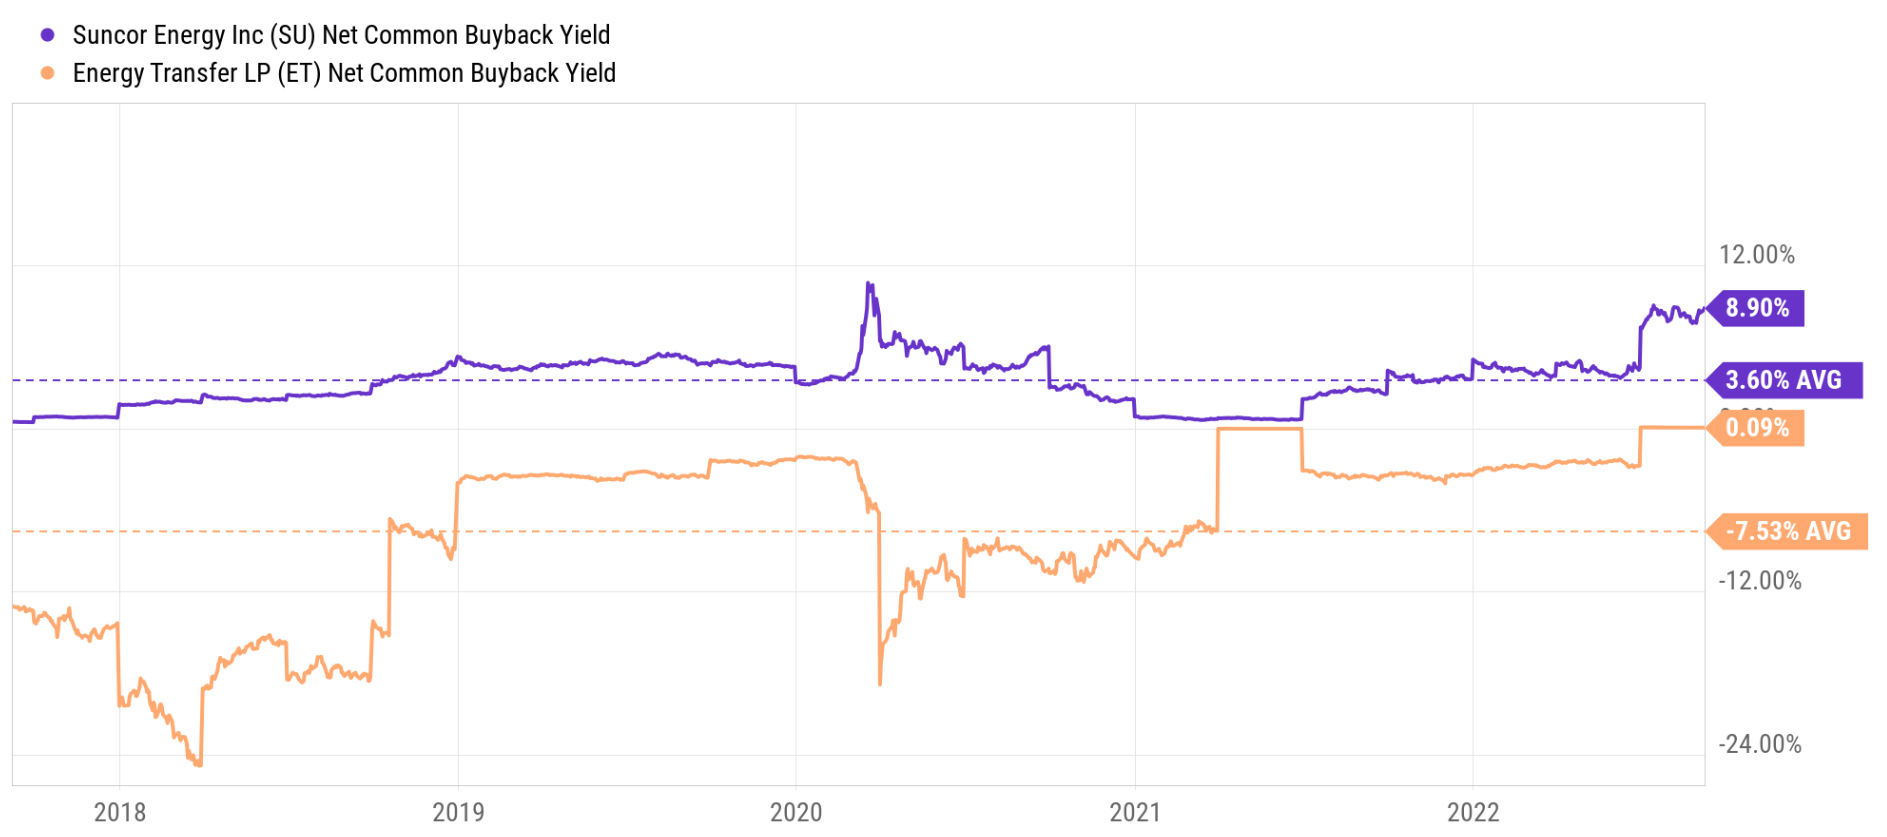
Dividends vs reinvestment
From a business owner’s perspective, how to deploy and return capital also depends on the profitability and investment opportunities available.
The next chart compares the profitability of ET and SU in terms of return on equity (“ROE”) and returns on invested capital (“ROIC”). Their ROE and ROIC have tracked each other over the years closely with no surprise. Both bottomed near the end of 2020 due to the pandemic and have recovered strongly after that. To wit, SU’s current ROIC stands at 17.5% and ROE at 25%, both far exceeding those of ET (whose ROIC is 7.4% and ROE is 14%).
I am not concerned about ET’s relatively low ROE and ROIC here. The operative word is its only relative. ET’s ROE and ROIC are strong in their own right as a pipeline business. And both ET and SU’s profitability are far above their cost of capital (which is about 6.5% for ET and about 8.5% for SU based on my WACC analysis).
Source: Seeking Alpha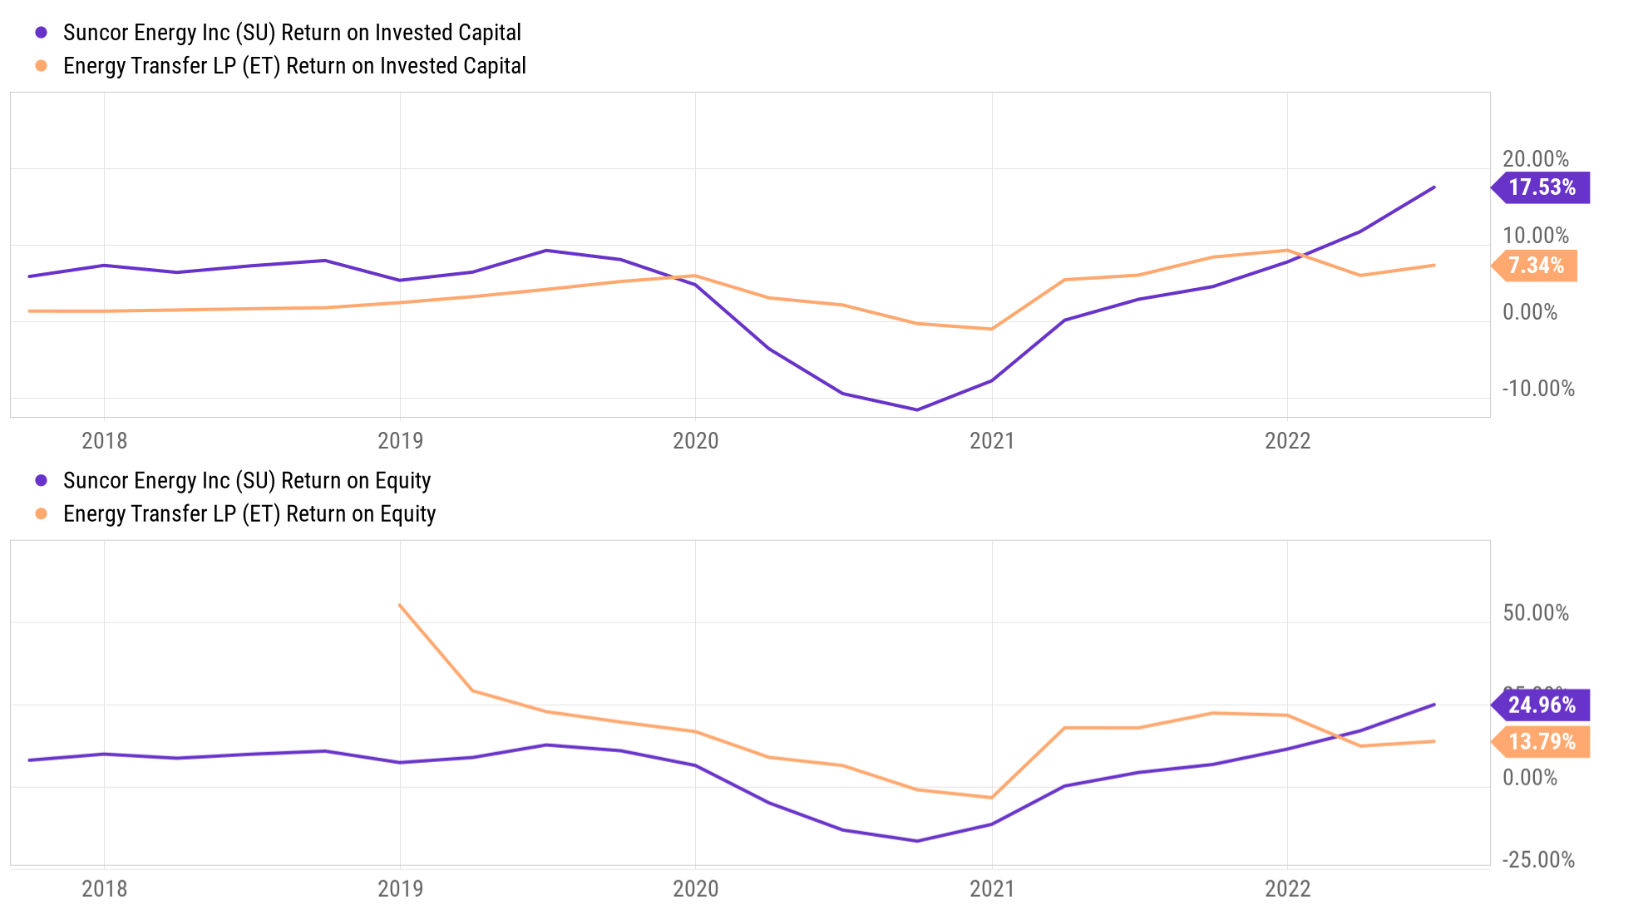
Given SU’s current high ROE and ROIC, it makes better sense for it to reinvest more aggressively and buy back shares while they are undervalued more aggressively as aforementioned, instead of paying out more dividends. And indeed, that is what the company intends to do. The company plans to spend $4.8B in capital investment in 2022 (with a target ceiling of $5B). Going forward, the company plans to stick to a capital allocation plan balanced among dividends, share buybacks, capital reinvestments, and also debt reduction. As a highlight to investors, once its net debt reaches $9 billion, it intends to direct all free funds flow to shareholder returns as CEO Mark Little commented during its recent earnings report (abridged and emphases added by me):
With respect to capital allocation… our plan is to use half of our free funds flow to buy back shares and have to repay debt until our net debt reaches $12 billion. Once at $12 billion, our plan is to direct 75% of free funds flow to buying back shares and 25% to debt reduction. And for clarity, once net debt is at a $9 billion floor, we’ll direct all free funds flow to shareholder returns. With current strip pricing, we expect to be in a position to achieve our $12 billion net debt target during the second half of this year and move to this increased share buyback level.
Source: SU earnings report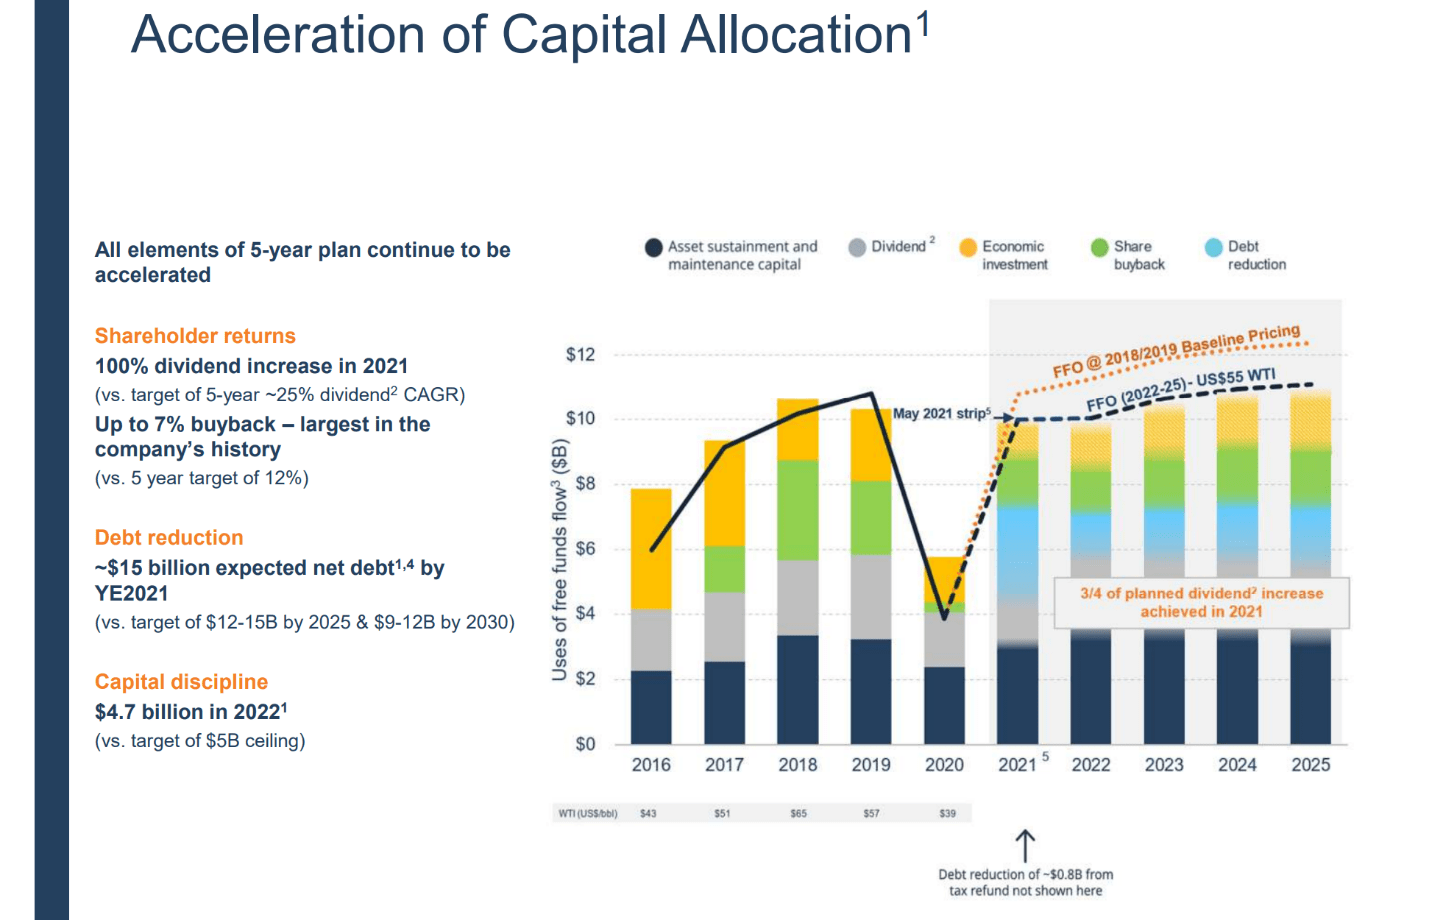
On the other hand, for ET, it makes more sense for it to focus more on dividends both due to its partnership structure and the nature of its business. Thus, the capital allocation at ET is quite simple as seen in the next chart. Maintenance CAPEX represents about 55.9% of its OPC (operation cash flow). And dividends represent another 37.8% of its total OPC. Overall, these two items represent almost 90% of its total OPC already.
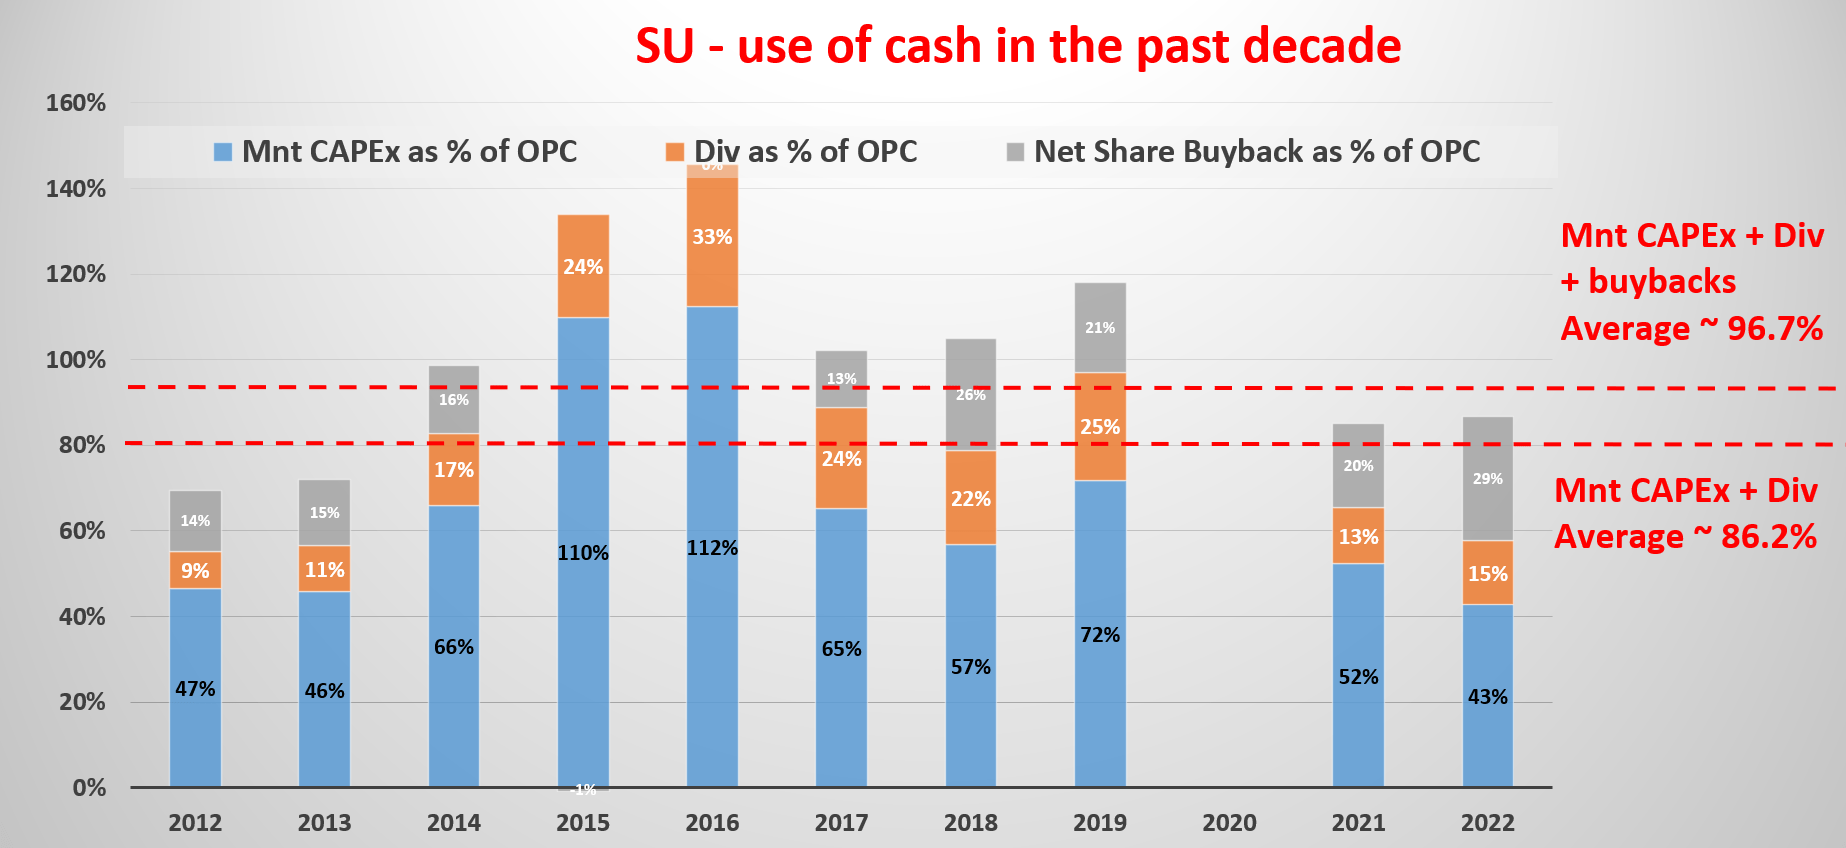
In contrast, there are a few items on the menu of capital allocations for SU as you can see from the second chart below. Maintenance CAPEX represents about 67% of its OPC. And dividends represent another 29.2% of its total OPC. Hence, these two items represent about 86.2% of its total OPC (compared to 90% for ET). As a result, the business has a bit of flexibility after covering these “mandatory” items to engage in share buybacks and growth reinvestment as aforementioned.
Source: Author based on Seeking Alpha data Source: Author based on Seeking Alpha data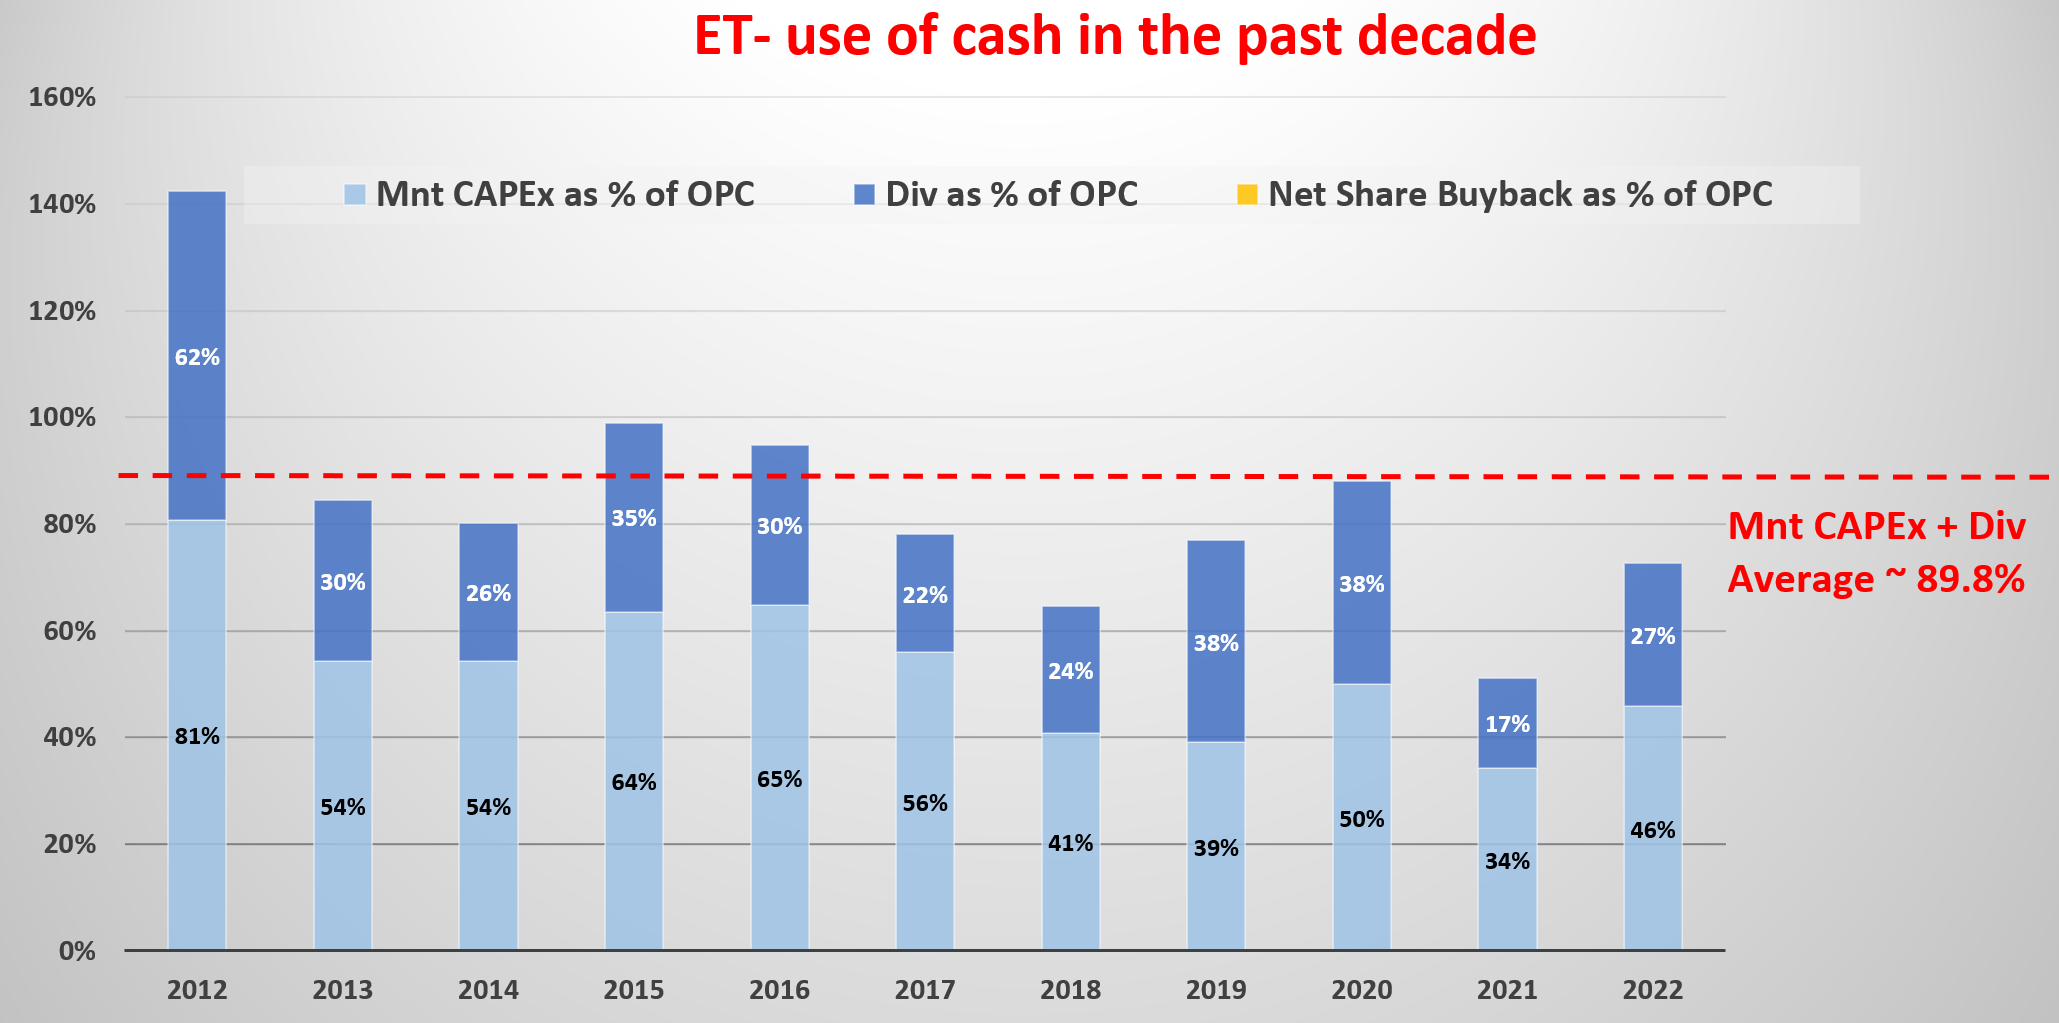
Valuations and projected returns
Onto to valuations and projected returns. As the following table shows, ET is currently about fairly valued, possibly with a small discount. It is discounted by about 8% in terms of dividend yield compared to its historical averages. Its present FW PE is about 7.9x, almost exactly on par with its historical average of around 8.0x.
With the above slightly compressed valuation, a healthy projected return can be expected when combined with moderate growth rates assumed to be 5% based on consensus estimates. For the next 3~5 years, the total return is projected to be in a range of 23% (the low-end projection) to about 31% (the high-end projection), translating into an annual return of 5.2%to 7.0%. And note again that pretty much all the potential returns are projected to come as dividend payouts.
Source: Author based on Seeking Alpha data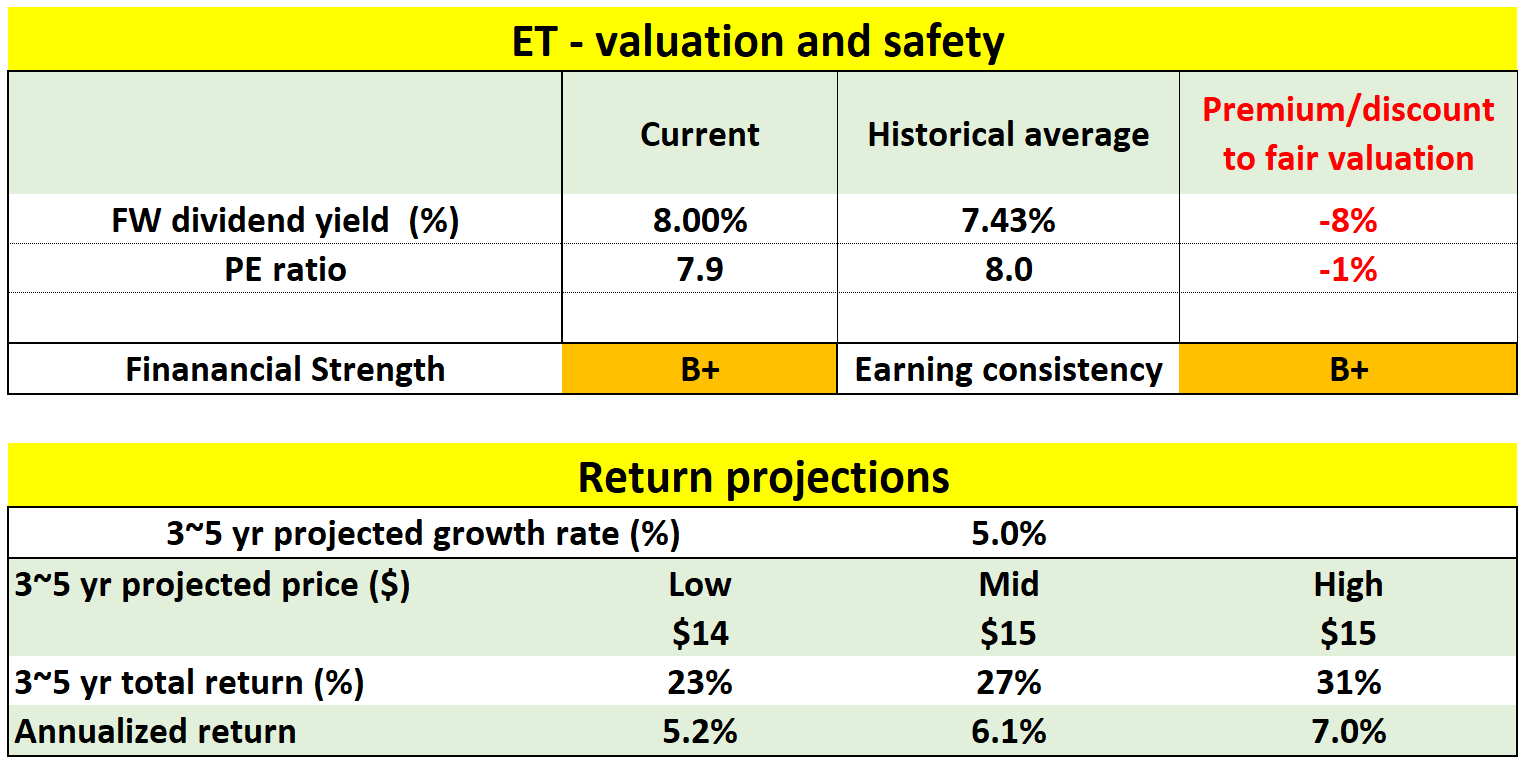
As the next table shows, SU is currently more discounted than ET. It is discounted by about 11% in terms of dividend yield compared to its historical averages. Its present FW PE is about 6.9x only, an 28% discount from its historical average of around 9.5x.
Furthermore, as mentioned above, SU currently also features a higher return on capital and also a higher reinvestment rate than ET. As such, I’m projecting a faster growth rate of 7.5% for SU. The compression of valuation, combined with the higher growth rates, leads to a much higher return potential. For the next 3~5 years, the total return is projected to be in a range of 48% (the low-end projection) to about 85% (the high-end projection), translating into an annual return of 10.3%to 16.6%. And note here that the dividend yields of 4.5% would only be a relatively minor part of the projected return potential.
Source: Author based on Seeking Alpha data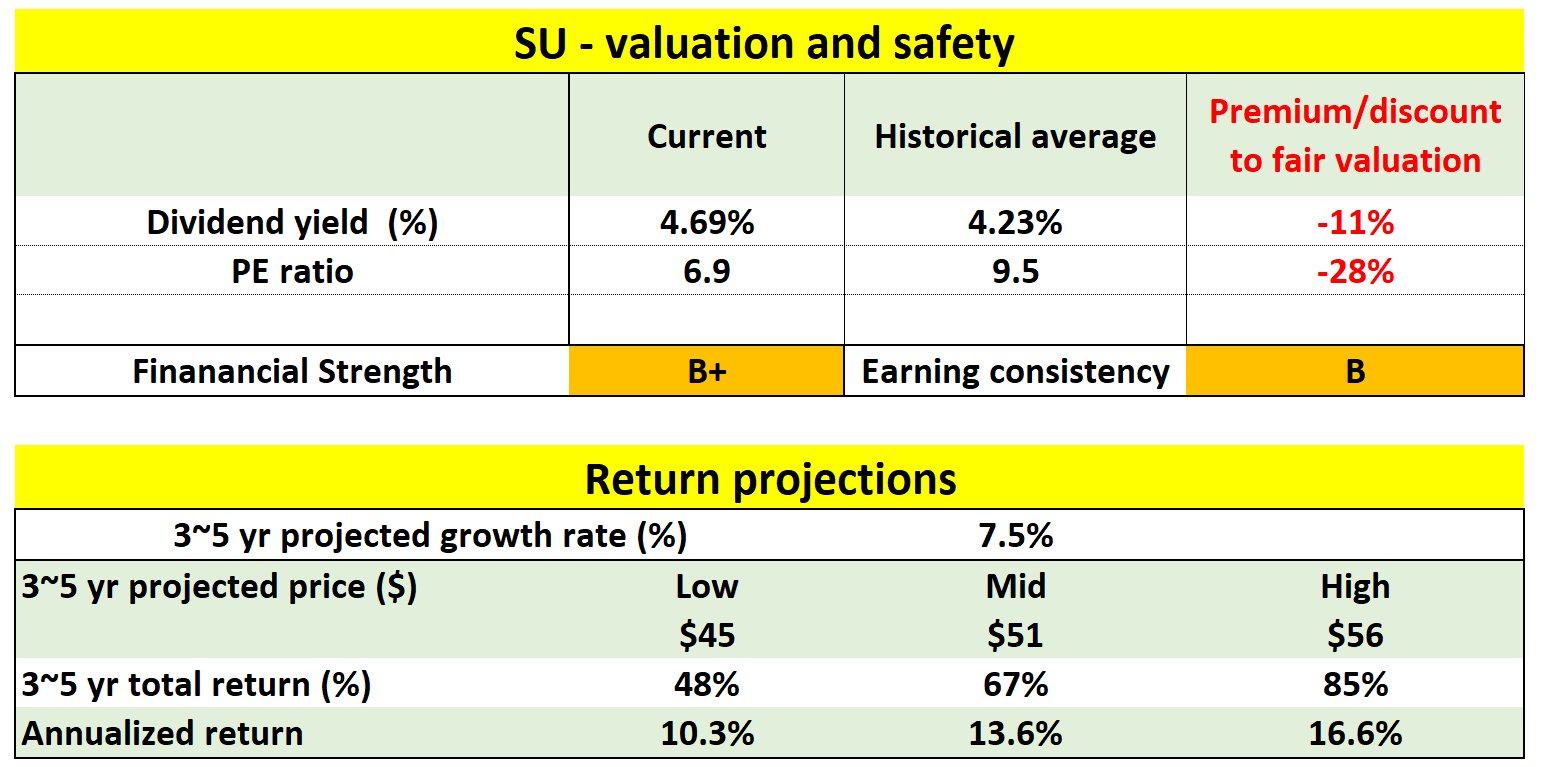
Final thoughts and risks
To reiterate, I really do not a bad choice here. I see plenty of positives for both ET and SU: generous current dividends (6.5% for ET and 4.5% for SU), an oil price expansion that is overdue, an effective hedge against ongoing geopolitical risks such as the Russian/Ukraine situation, and very reasonable valuation. It is just a matter of eating the cakes now (ET) or later (SU). ET’s projected return (5.2% to 7.0%) would almost all come from dividend payouts. In contrast, SU’s projected return is higher (in the range of 10.3%to 16.6%). And at the same time, its dividend yields of 4.5% would only be a relatively minor part of the projected return potential (about ½ to 1/3), hence adding more uncertainties in the near term.
Finally, risks. With commodity stocks, investors do need a stronger nerve to tolerate short-term volatility risks. As seen in the chart above, their beta in the past 60 months has been substantially higher than the overall market (1.84 for ET and 1.74 for SU). In the longer term, climate and environmental concerns are a risk for both of them. Our concerns over climate change and the environment could impact oil and gas production in general. Both stocks are often involved in legal disputes with environmental groups, protests, lawsuits, and government regulations.
Source: Seeking Alpha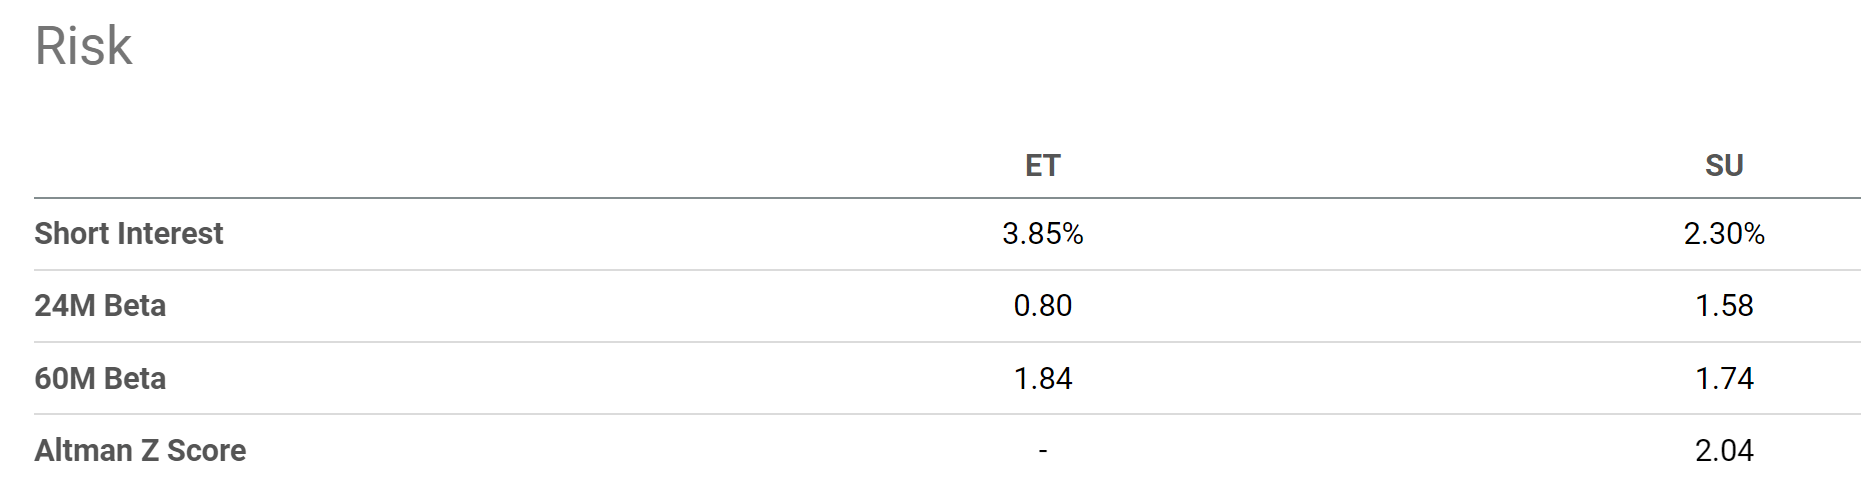
Be the first to comment