

AvigatorPhotographer/iStock via Getty Images
I am still shocked as Energy Transfer (NYSE:ET) delivered a strong Q2 earnings report, and shares traded down. ET generated $25.9 billion of revenue which was a YoY increase of 71.5% and a beat of $5.57 billion while delivering GAAP EPS of $0.39, which was a beat by $0.02. ET produced $3.23 billion of Adjusted EBITDA and $1.88 billion of distributable cash flow (DCF) throughout Q2, and it seems like no matter what ET does, it’s just not enough. ET’s direct competitors have all reported Q2 earnings, and on a trailing twelve-month (TTM) basis, ET is trading at a low valuation compared to Enterprise Products Partners (EPD), Kinder Morgan (KMI), and MPLX LP (MPLX). The pipeline sector regardless of if it’s an LP or an MLP hasn’t been a shining star over the past 5 years as all 4 of these companies, minus distributions paid, are in the red from a capital appreciation perspective. EPD is at the top of the range, down -3.24%, while ET is at the bottom, down -35.89%. In 2022 ET has appreciated by 27.55%, while EPD has increased by 13.6%, KMI by 5.81%, and MPLX by 1.97%, but compared to these competitors, ET should have a much larger market cap. I believe ET’s fair value is still around $20 per share, and the market isn’t taking the turnaround into consideration.
Seeking Alpha 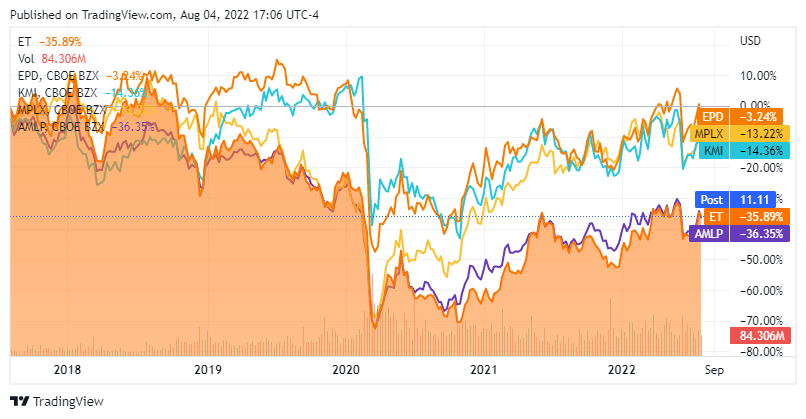
Seeking Alpha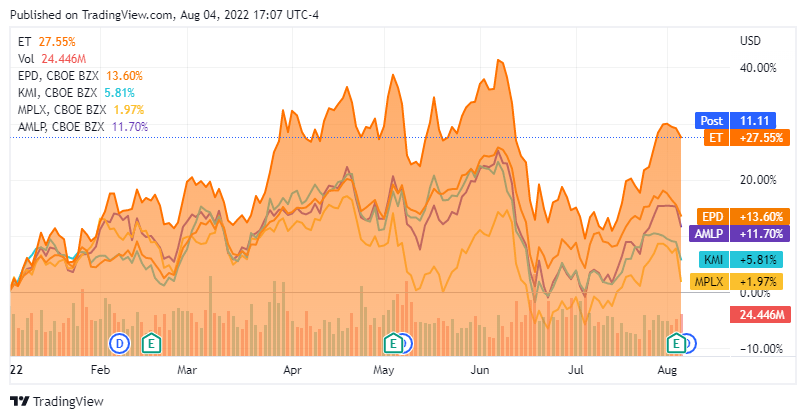
ET’s valuation feels like an arbitrage play because its massively out of sync with its competitors.
I created a chart below so everyone reading this article can see ET, EPD, KMI, and MPLX’s market caps at the close on 8/4/22 and their revenue, adjusted EBITDA, DCF, and Total Debt on a TTM basis before I conduct my analysis. Currently, KMI’s market cap is larger than ET’s by $4.88 billion (14.23%), and EPD’s is larger by $21.8 billion (63.6%).
|
ET |
EPD |
KMI |
MPLX |
|
|
Market Cap |
$34,280,270,570.00 |
$56,081,249,662.00 |
$39,159,153,773.00 |
$30,895,488,023.00 |
|
Revenue |
$81,757,000,000.00 |
$56,498,200,000.00 |
$17,559,000,000.00 |
$10,333,000,000.00 |
|
Adjusted EBITDA |
$11,960,000,000.00 |
$8,802,257,000.00 |
$7,248,000,000.00 |
$5,727,000,000.00 |
|
Distributable Cash Flow |
$8,009,000,000.00 |
$7,109,000,000.00 |
$4,737,000,000.00 |
$4,845,000,000.00 |
|
Total Debt |
$48,905,000,000.00 |
$29,910,200,000.00 |
$31,692,000,000.00 |
$20,628,000,000.00 |
There isn’t an exact science to evaluating companies; otherwise, every stock would trade off the same financial metrics. Since there isn’t one mold for pricing, sometimes the market leaves opportunities for investors to take advantage of. The market’s hatred for ET is deep, and investors have experienced the dark cloud firsthand for many years, but that doesn’t mean there isn’t light at the end of the tunnel. The figures I will discuss are outlined in the chart below. Many investors use distributable cash flow – DCF – to market cap ratio as an indicator to see how midstream operators are priced compared to others in the sector. I’m also going to utilize the adjusted EBITDA to market cap ratio, Adjusted EBITDA to total debt, and P/S ratios to provide a more complete picture of these companies.
|
Market Cap |
Revenue |
Adjusted EBITDA |
Distributable Cash Flow |
Total Debt |
|
|
ET |
$34,280,270,570.00 |
$81,757,000,000.00 |
$11,960,000,000.00 |
$8,009,000,000.00 |
$48,905,000,000.00 |
|
EPD |
$56,081,249,662.00 |
$56,498,200,000.00 |
$8,802,257,000.00 |
$7,109,000,000.00 |
$29,910,200,000.00 |
|
KMI |
$39,159,153,773.00 |
$17,559,000,000.00 |
$7,248,000,000.00 |
$4,737,000,000.00 |
$31,692,000,000.00 |
|
MPLX |
$30,895,488,023.00 |
$10,333,000,000.00 |
$5,727,000,000.00 |
$4,845,000,000.00 |
$20,628,000,000.00 |
|
Adjusted EBITDA to Market Cap Ratio |
DCF to Market Cap Ratio |
Debt to Adjusted EBITDA |
Price to Sales |
||
|
2.87 |
4.28 |
4.09 |
0.42 |
||
|
6.37 |
7.89 |
3.40 |
0.99 |
||
|
5.40 |
8.27 |
4.37 |
2.23 |
||
|
5.39 |
6.38 |
3.60 |
2.99 |
ET is the largest MLP by revenue, Adjusted EBITDA, and DCF, yet it’s on the lower end of the valuations scale. In the TTM, ET has generated $81.76 billion of revenue, and its market cap is $34.28 billion. ET is trading at a 0.42x P/S ratio. EPD trades at close to even money at a 0.99x P/S, while the market has placed a 2.23x P/S ratio on KMI and a 2.99x ratio on MPLX. ET trading at less than half its revenue is crazy, and there aren’t many industries where this is normal.
Steven Fiorillo, Seeking Alpha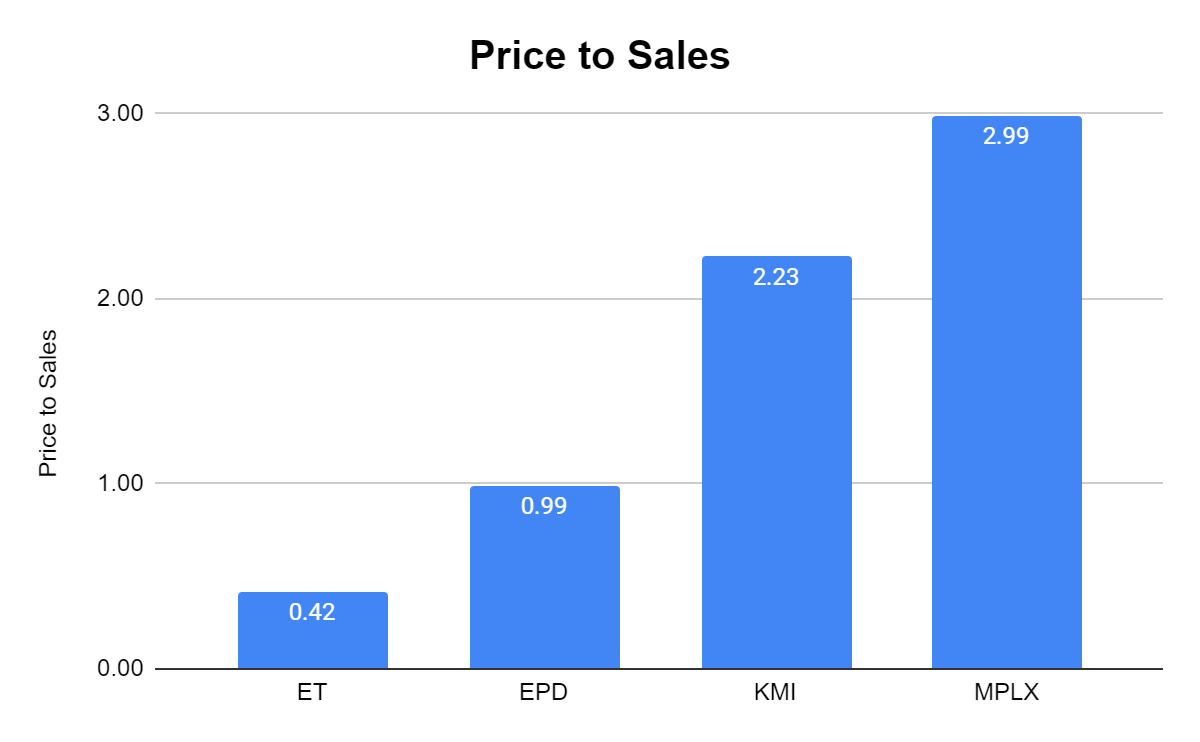
When you’re investing in pipeline companies, it’s important to look at the DCF as this is the pool of capital distributions are paid from. DCF is the equivalent of funds from operations (FFO) from REITS. ET produces the most DCF of these 4 companies, with $8.01 billion generated in the TTM. ET generates $3.16 billion (65.30%) more DCF than MPLX, $3.27 billion (69.07%) more DCF than KMI, and $900 million (12.66%) more DCF than EPD, yet ET trades at the lowest valuation. Today you are paying 4.28x ET’s DCF to market cap ratio while the market has put a lofty premium on the DCF that EPD, KMI, and MPLX generate. MPLX trades at 6.38x its DCF, EPD 7.89x its DCF, and KMI 8.27x its DCF. $1 of DCF is $1 of DCF regardless of what company is producing it. Today you’re getting the largest MLP at the cheapest P/S and DCF to market cap ratios.
Steven Fiorillo, Seeking Alpha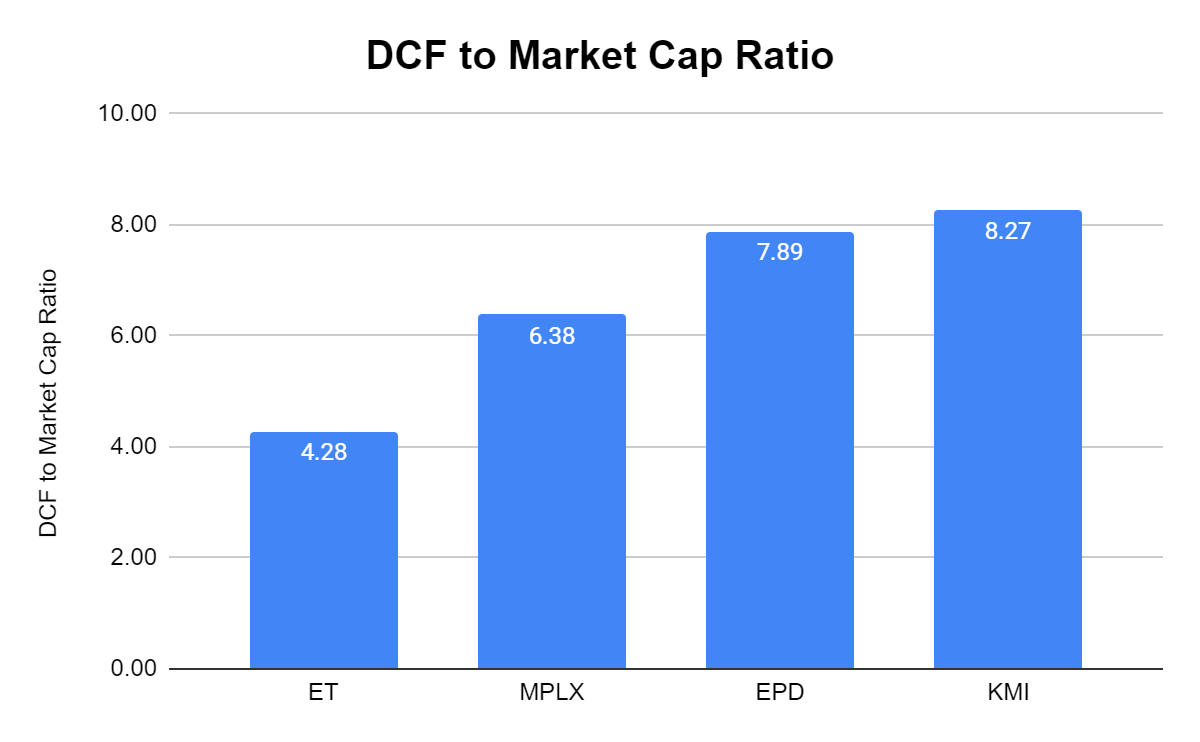
I always like looking at the adjusted EBITDA to market cap ratio because Adjusted EBITDA (Earnings Before Interest, Taxes, Depreciation, and Amortization) basically tells you how much cash is left over after paying the business operating costs, excluding one-time charges. Just like the other metrics, ET generates the largest level of adjusted EBITDA. ET generated $11.96 billion of adjusted EBITDA in the TTM, which was $3.16 billion (35.87%) more than EPD, $4.71 billion (65.01%) more than KMI, and $6.23 billion (108.84%) more than MPLX. ET is trading at 2.87x its adjusted EBITDA while the market has placed a 5.39x multiple on EPD, a 5.4x multiple on KMI, and a 6.37x multiple on EPD.
Steven Fiorillo, Seeking Alpha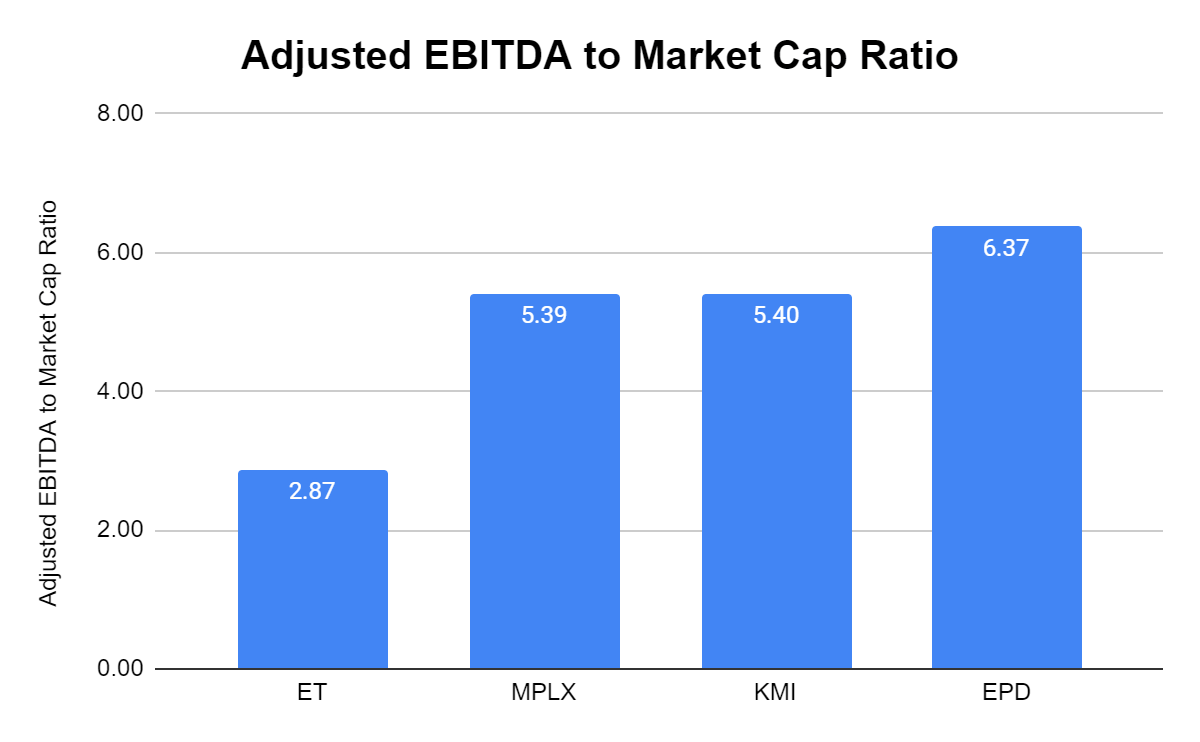
The last metric I want to look at is the adjusted EBITDA to the total debt level. Credit rating agencies generally like to see Debt / EBITDA ratios of 4.5 or less. In addition, an MLP’s debt covenants, which are tied to their credit facilities, usually state an absolute limit to this ratio above which an MLP’s loans can be called in early should they be violated. Some sites use long-term debt on this metric, but I like to use total debt to see the true measures of a company’s liquidity.
ET has the largest level of total debt with $48.91 billion, but due to their large level of adjusted EBITDA their adjusted EBITDA to total debt ratio is well within the range created by EPD, KMI, and MPLX. The range is 3.4x – 4.37x, and ET has a 4.09x adjusted EBITDA to total debt ratio.
Steven Fiorillo, Seeking Alpha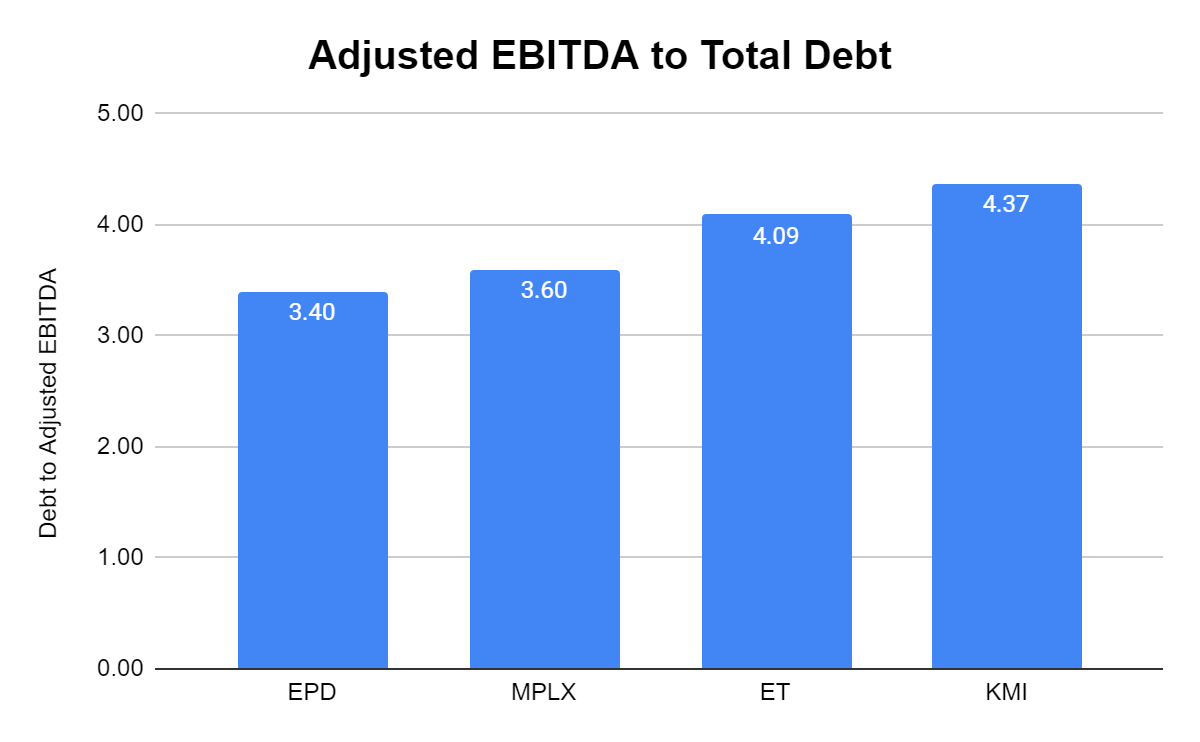
Based on these metrics, ET looks like an arbitrage play at this point. There is no reason why the market should be discounting ET as severely as it is while other companies are trading at lofty valuations. ET doesn’t have a debt crisis on its hands which the market was once worried about, and can be bought for 4.28x its DCF or 2.87x its adjusted EBITDA. If I was looking to acquire one of these companies, ET would deliver the most bang for the buck. Based on how its peers are valued, ET should trade at no less than $20. If we see that anytime soon is another story, but I will sit back and collect the distributions while I wait for ET to be fairly valued.
Energy Transfer reported a strong 2nd quarter and raised 2022 guidance yet the market wasn’t impressed
Maybe not enough people read through ET’s quarterly report because it should have been more than enough to create some excitement. Since the end of 2019, ET had acquired SEMGROUP, and Enable Midstream, strengthening its asset and operations base while lowering its total debt from $52.33 billion at the close of 2020 to $48.91 billion as of the end of Q2 2022. Since the close of 2019, ET’s revenue has increased by $27.92 billion (52.56%). ET has been firing on all cylinders, and the Q2 report reinforced just how well ET is executing on its vision. Due to ET’s performance in Q2, management now expects Adjusted EBITDA for the full year to be between $12.6 to $12.8 billion compared to a range of $12.2 to $12.6 billion. In Q2 ET generated $3.23 billion of adjusted EBITDA and $1.88 billion of DCF. After its distributions were paid, ET was left with $1.17 billion of excess cash flow.
ET resumed construction of its eighth fractionator at its Mont Belvieu, Texas facility. Frac VIII, which was more than half funded when construction was paused in 2020, is expected to be in service in Q3 of 2023. This will increase ET’s fractionation capacity to over 1.1 million bpd. ET completed a non-binding open season on its Gulf Run Pipeline Project. The good news is that per discussions with customers, the demand will likely exceed the initial design of 1.65 Bcf/d. This pipeline will be completed by the end of Q4 2022 and will provide natural gas transmission between the prolific Haynesville Shale and the U.S. Gulf Coast.
I have been bullish on exporting for some time, and we received clarity around the Lake Charles LNG facility. Lake Charles LNG has executed five LNG offtake agreements for an aggregate of 5.8 million tons per annum. The purchase price in all these agreements is indexed to the Henry Hub benchmark plus a fixed liquefaction charge, and the LNG will be delivered to the customer’s vessels on a FOB basis. The agreements will become fully effective upon the satisfaction of the conditions precedent by Energy Transfer LNG, including reaching FID. ET is also in “active negotiations” with several “high-quality customers,” and some more announcements are expected throughout Q3. ET plans on achieving FID by year-end, with a significant portion of the capital cost being sold as equity to infrastructure funds and possibly industry participants. Once Lake Charles LNG is completed ET plans to see incremental cash flows from the transportation of natural gas through its trunk line system and other upstream pipelines connected to Lake Charles. The global events placing increasing importance on natural gas should be bullish for this project as more companies secure long-term contracts. I think the Lake Charles LNG facility will play a critical exporting role and become a focal point for the global energy demand.
Management is making good on their promise to bring the distribution back to its previous levels
Many investors were worried about ET’s distribution returning to its original state as management’s original plan was met with some skepticism. In Q4 of 2020, ET reduced its quarterly distribution from $0.305 to $0.1525. Management had outlined a plan to reduce its debt and improve its leverage ratio. Management had indicated that their goal would be to restore the distribution over time as certain metrics were achieved. After 5 consecutive quarters of the reduced quarterly distribution of $0.1525, ET has now provided 3 consecutive increases to its distribution. Since the Q4 2021 distribution of $0.1525 per share, ET has increased the distribution, paying a distribution of $0.175 in Q1 2022, $0.20 in Q2 2022, and will be paying $0.23 in Q3 2022. Management has shown that they are executing its financial plan and staying true to its commitment to bringing the distribution back to its former level.
On the Q2 earnings call, management spoke about the rising distribution. They reinforced that the board will evaluate its distribution on a quarterly basis with the ultimate goal of returning distributions to the previous level of $0.305 per quarter or $1.22 on an annualized basis. Management also indicated that as their leverage target is reached, they will also evaluate additional growth opportunities and the potential for unit buybacks. After 3 consecutive distribution increases and the commentary on the earnings call, I think management has earned the right to be taken at their word that at some point, the distribution will be restored to $1.22 annualized.
Seeking Alpha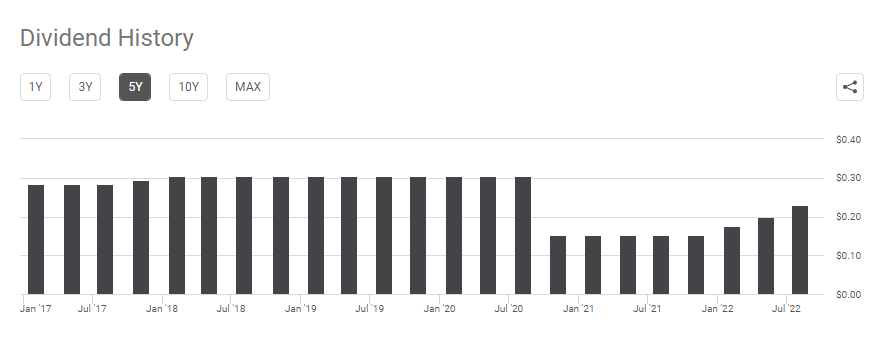
Conclusion
I think it’s clear that oil and gas will continue playing a critical role in the global energy mix for decades to come. ET’s infrastructure is critical to society’s way of life, and it’s almost impossible to recreate ET’s asset base. ET may not be a household name such as Apple (AAPL), but its assets across the energy infrastructure space are critical for a portion of the United States’ day to day operations. Energy will continuously need to be transferred from point A to point B, and a handful of companies can facilitate this necessity. ET is drastically undervalued compared to its peers, and the dark cloud above it hasn’t dissipated regardless of ET’s operational and financial improvements. I still believe ET has a fair value of at least $20 per share, especially when the market has placed tremendous valuations on companies that don’t produce the level of revenue, adjusted EBITDA, or DCF that ET does. If ET ends up trading at a fair valuation to its peers is a different story. Right now, ET is an income play with a growing distribution that has the possibility to turn into a capital appreciation play as well.
Be the first to comment