

Brett_Hondow
It was another tough earnings season for the restaurant industry (EATZ), with reduced sales leverage due to weaker traffic trends combined with another quarter of elevated wage/commodity inflation. However, despite the softer results, most casual dining names shrugged off the bad news. In Dine Brands’ (NYSE:DIN) case, the stock posted solid results, but its post-earnings rally was interrupted by a resumption of the cyclical bear market in the S&P 500 (SPY).
While the backdrop for casual dining stocks remains challenging due to a tight labor market, rising food costs, and a weaker consumer, Dine Brands’ franchisees are in solid shape and positioned well from a demand standpoint. This is because it benefits from a much lower average check than brands like Outback Steakhouse (BLMN) and Red Lobster, meaning that even with taking price, it stands out as a cheap option for families/couples anxious to get out for entertainment. Given this enviable positioning, I see DIN as a decent buy-the-dip candidate if we see further weakness.
S&P 500 Weekly Chart (TC2000.com)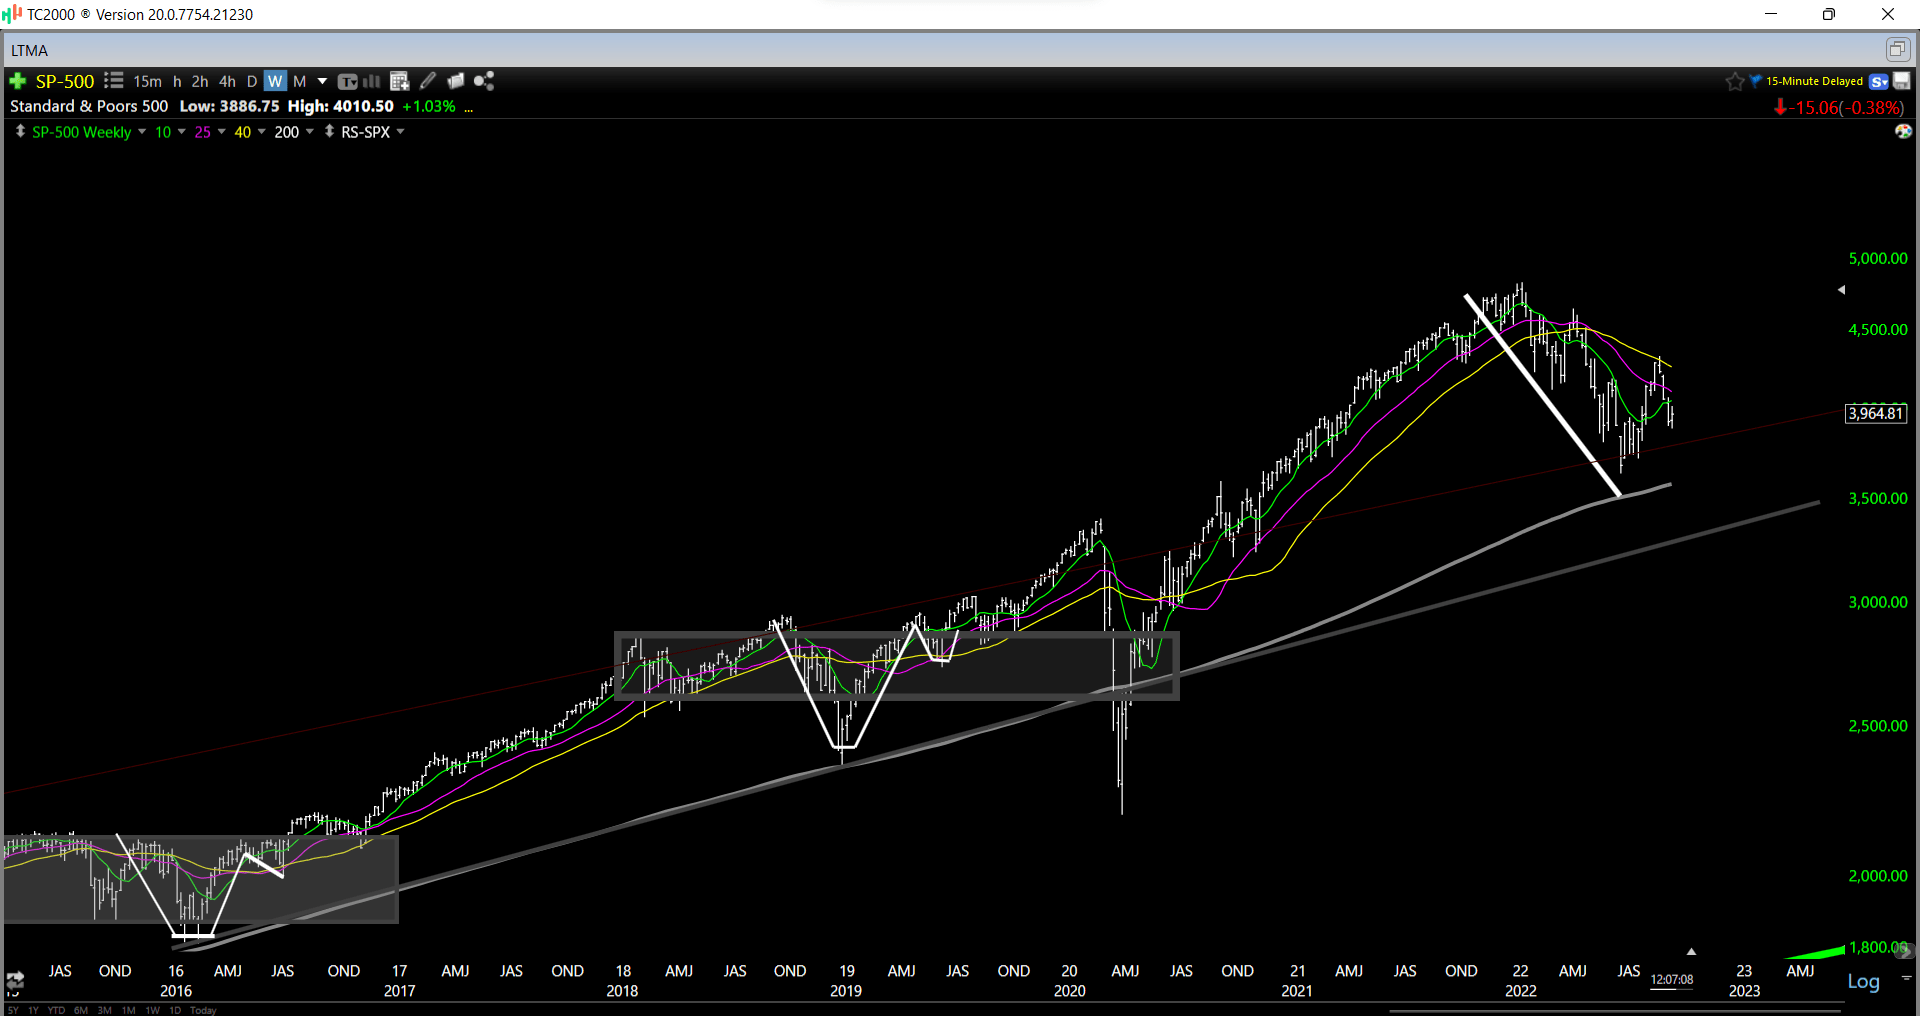
Q2 Results
Dine Brands released its Q2 results last month, reporting quarterly revenue of $237.8 million, a 2% increase from the year-ago period. This was helped by low single-digit comparable sales growth at both of its brands, with Applebee’s reporting 1.8% comp sales growth (12.5% vs. 2019) and IHOP reporting 3.6% comp sales growth. Notably, off-premise sales (delivery and pick-up) remain sticky for both brands, with Applebee’s and IHOP exiting the quarter with over 21% mix from off-premise and weekly sales of $13,900 and $8,300, respectively.
Applebee’s Menu Offerings (Company Presentation)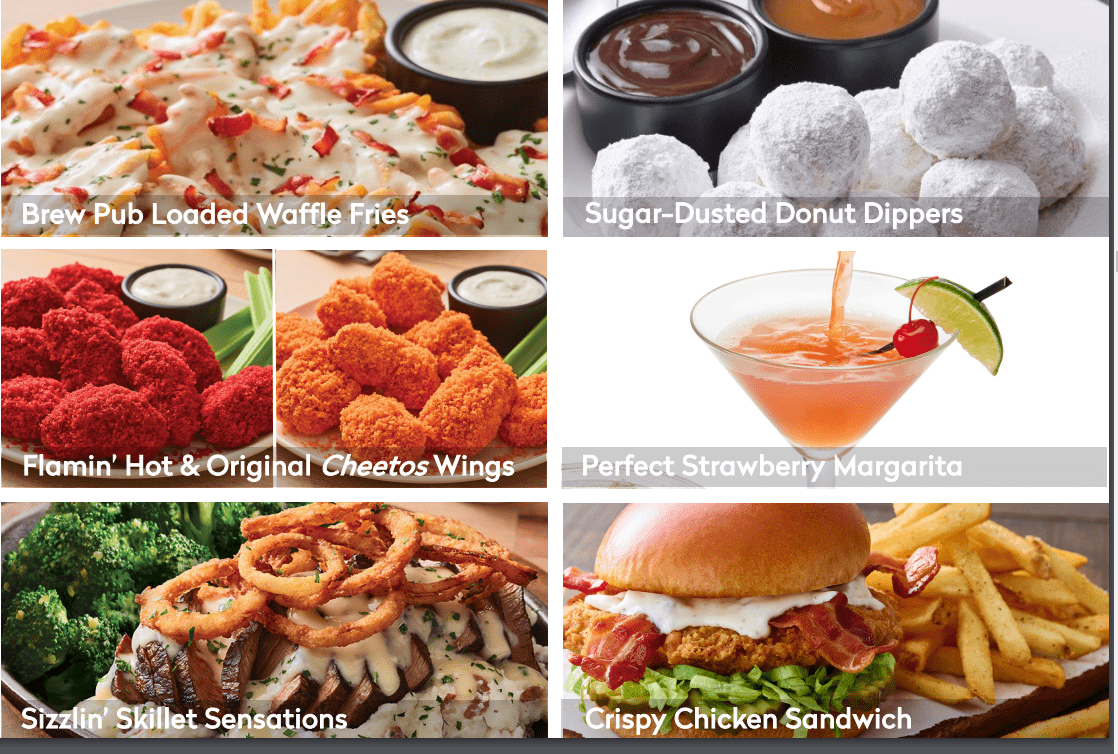
If we look at Dine Brands’ revenue trend below, it may be weaker than some of its peers, but sales have held up quite well, considering the headwinds. Like other companies, Dine Brands noted that it did see some pullback from its lower-income guest later in the quarter, with the solid April and May sales partially offset by spiking gas prices later in the quarter. Fortunately, gas prices have declined considerably from their peak above $5.00/gallon, improving to $3.75/gallon this week. Given this impact on discretionary budgets, this could set up Dine Brands for a better September than planned, with gas inflation cooling off quicker than expected.
National Gas Prices (AAA Gas Prices)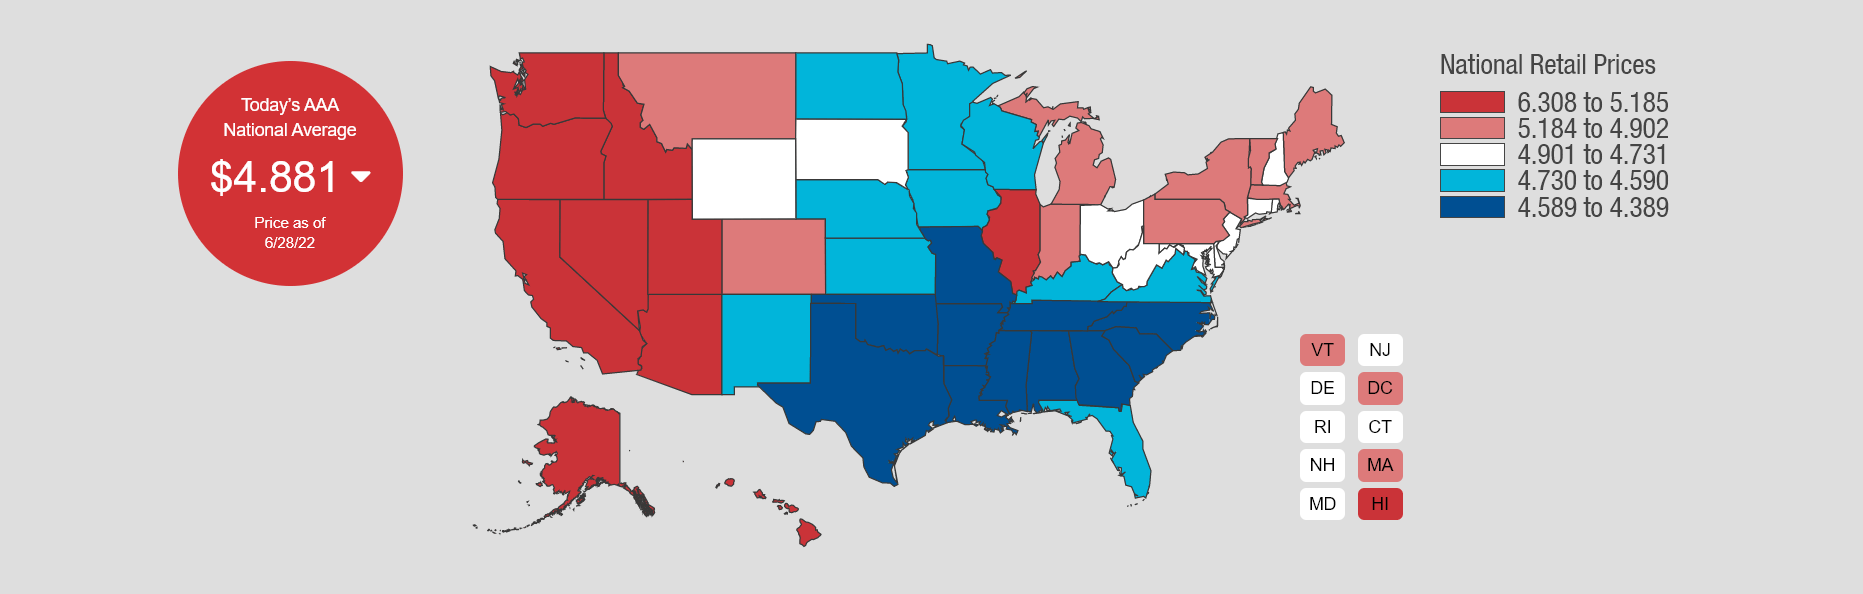
Dine Brands – Quarterly Revenue (Company Filings, Author’s Chart)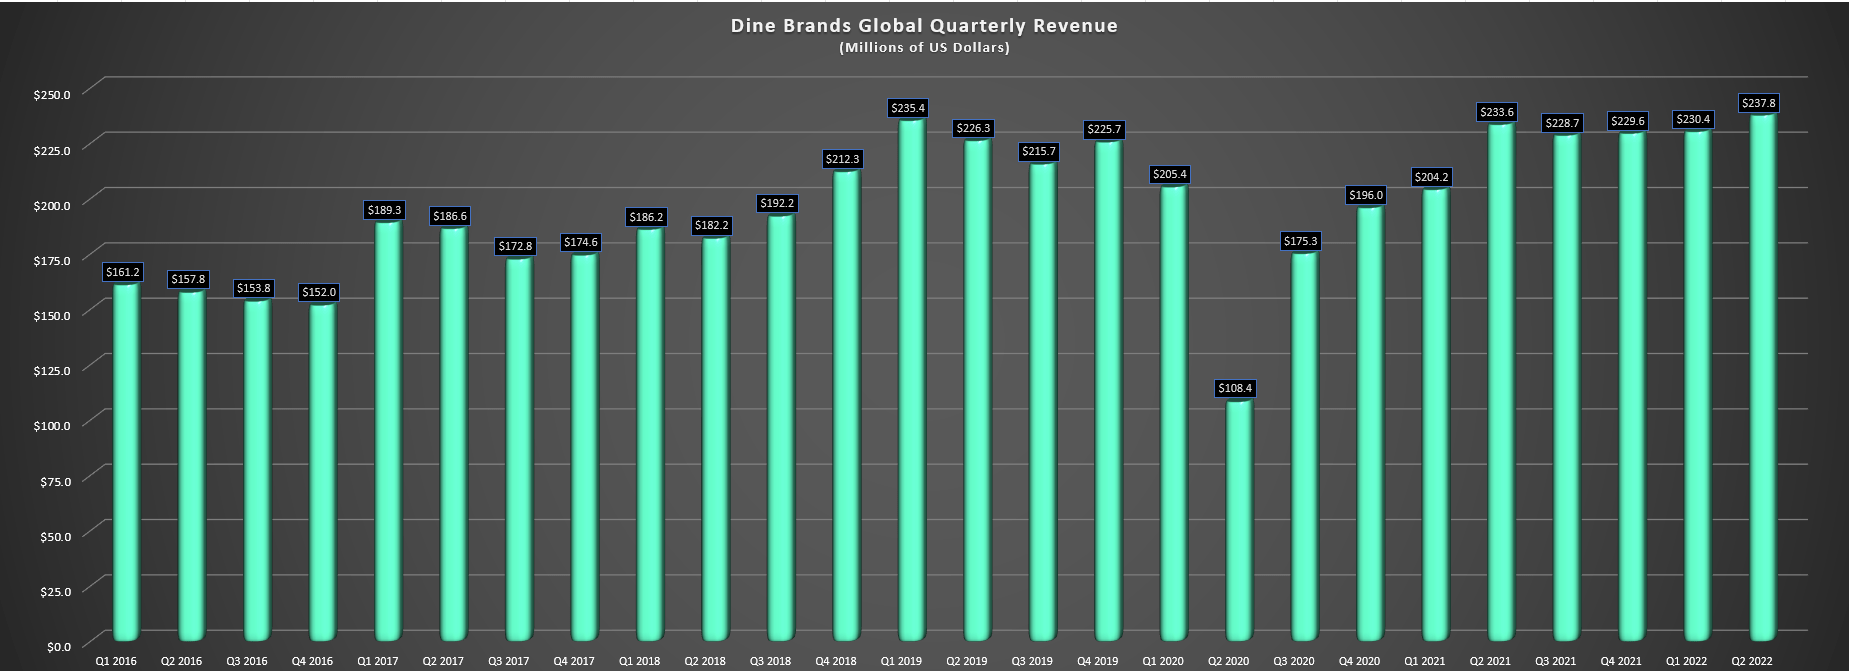
Digging into operations a little closer, Applebee’s is planning to expand its Cosmic Wings virtual brand to its Applebee’s core menu, similar to what Denny’s (DENN) is doing with It’s Just Wings. It’s also continuing with strategic discounting vs. giving away dollars, offering a dozen shrimp for $1.00 when guests order a steak, and bringing back All You Can Eat with a wing deal, offering All You Can Eat boneless wings for $12.99. At IHOP, the company noted that its International Bank of Pancakes launch exceeded expectations, with 2 million loyalty members (30% new to the brand) now earning ‘PanCoins’.
IHOP Restaurant (Company Presentation)
Costs & Earnings Trend
Unfortunately, while sales were solid and Applebee’s is more protected than peers with its leading franchise model in the casual dining space, commodity costs remained elevated in Q2. Commodity inflation came in at 22%, and while it will improve to low teen levels in H2, it impacted adjusted EBITDA in the period. The combination of increased G&A and inflation led to an 8% dip in adjusted EBITDA (66.1 million vs. $71.7 million) despite the slight increase in revenue. Dine Brands noted that the increase in G&A was related to travel-related costs to support franchisees and strategic growth initiatives.
Monthly Eating & Drinking Employment (National Restaurant Association, BLS)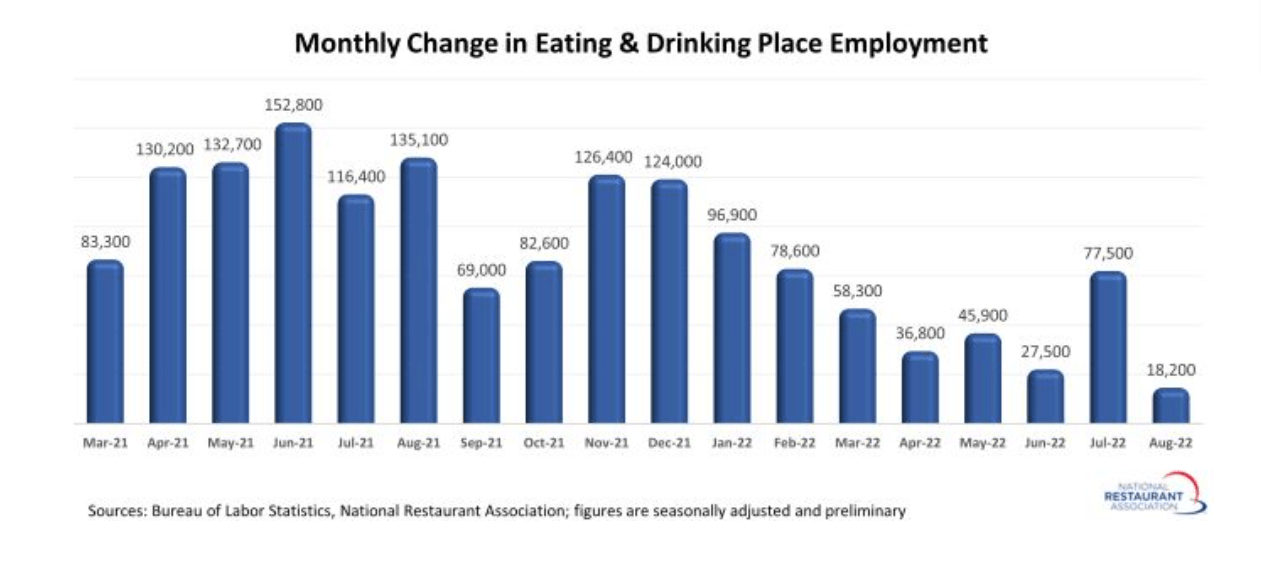
On the positive side, while staffing remains a challenge industry-wide, IHOP saw an increase in restaurants open at regular operating hours, with 91% now operating at standard hours. This should help average unit volumes and will be a tailwind as more of the system returns to a 24/2 and 24/7 format. Lastly, when it comes to unit development, the company saw six net new openings in the period and will see unit growth accelerate in 2023. Shortly after quarter-end, IHOP announced new deals in Saudi Arabia and Qatar, with 9 openings expected in these two countries later this decade.
Dine Brands – Earnings Trend (YCharts.com, FactSet, Author’s Chart)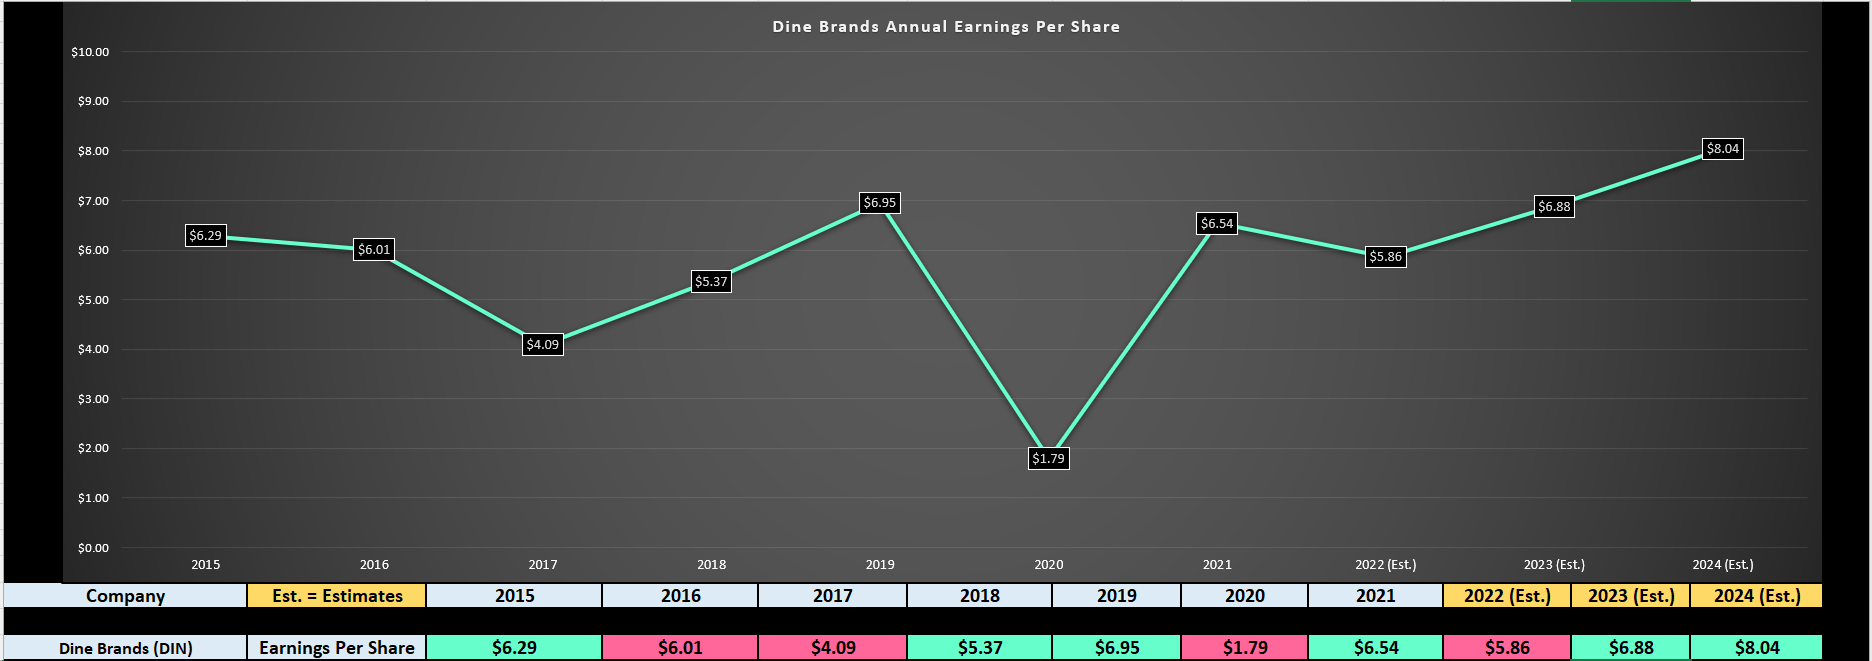
Given the increase in revenue offset by inflationary pressures, Dine Brands saw some pressure from an earnings standpoint. During Q2, it reported quarterly EPS of $1.65, a 15% decline year-over-year. This has pushed annual EPS estimates down to just $5.86 for FY2022, which will translate to a double-digit decline vs. FY2021 levels and push earnings back near FY2018 levels.
However, with an aggressive share buyback program in place (~921,000 shares or 5% of float repurchased in Q2 alone) and unit growth, we should see a solid recovery next year. In fact, based on FY2024 annual EPS estimates of $8.04, new highs are on deck. So, while annual EPS has struggled since COVID-19, this looks to be an aberration in the long-term uptrend. Let’s look at the stock’s valuation below:
Valuation & Technical Picture
As shown in the below chart, Dine Brands has historically traded at ~14.2x earnings, and it currently trades at just 12.0x earnings at a share price of $70.30 (FY2022 annual EPS estimates: $5.86) and 10.2x FY2023 estimates ($6.88). This would suggest a buying opportunity in a normal environment, with DIN trading at a discount to its historical multiple with an attractive dividend yield (~3.00%). That said, the industry remains challenged even if Dine Brands’ franchisees remain healthy. Given these headwinds, I think a more conservative earnings multiple is 12.1x earnings (15% discount to 15-year average).
Dine Brands – Historical Earnings Multiple (FASTGraphs.com)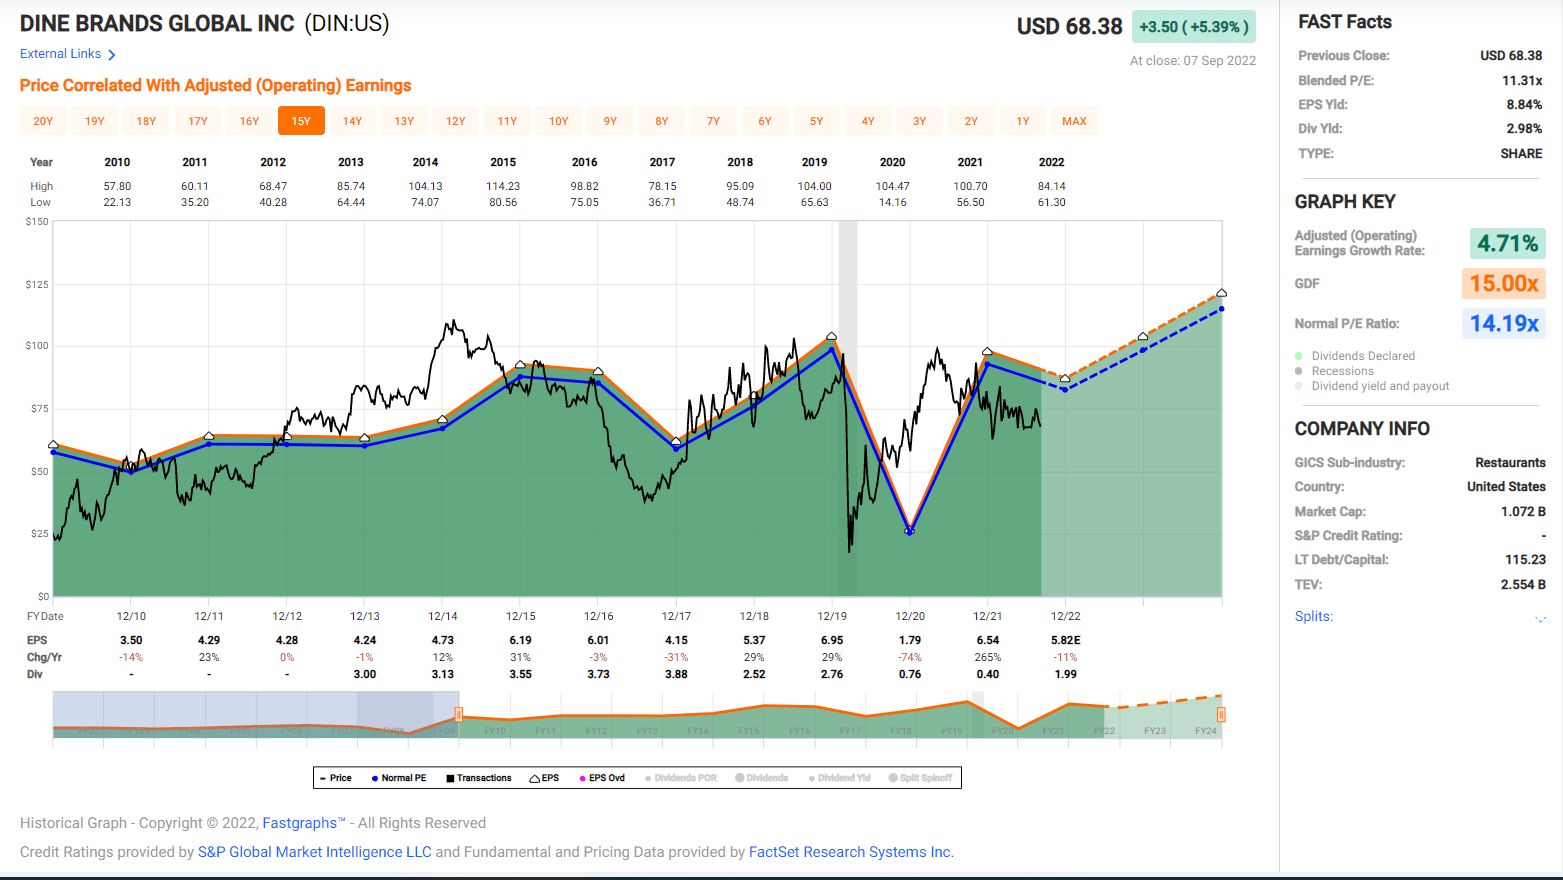
Based on FY2023 annual EPS estimates of $6.88 and a more conservative earnings multiple of 12.1, I see a fair value for Dine Brands of $83.20, translating to a 26% upside on a total return basis vs. its 18-month price target. However, these earnings estimates could be conservative if Dine Brands continues its aggressive pace of share buybacks, with ~5% of the float repurchased in Q2 alone. Hence, it looks closer to a 30% upside to its 18-month target price in an upside scenario, which assumes a conservative multiple for the stock.
That said, I prefer a 30% discount to fair value to justify entering new positions, and even with an 18-month target of $86.30 (dividends paid plus fair value), the low-risk buy zone for the stock moves up to $60.40, which would require a 10% dip from current levels. Obviously, the stock doesn’t have to decline to this level, but this is where I would view DIN as being in a low-risk buy zone and worthy of starting a new position.
Dine Brands – Daily Chart (TC2000.com)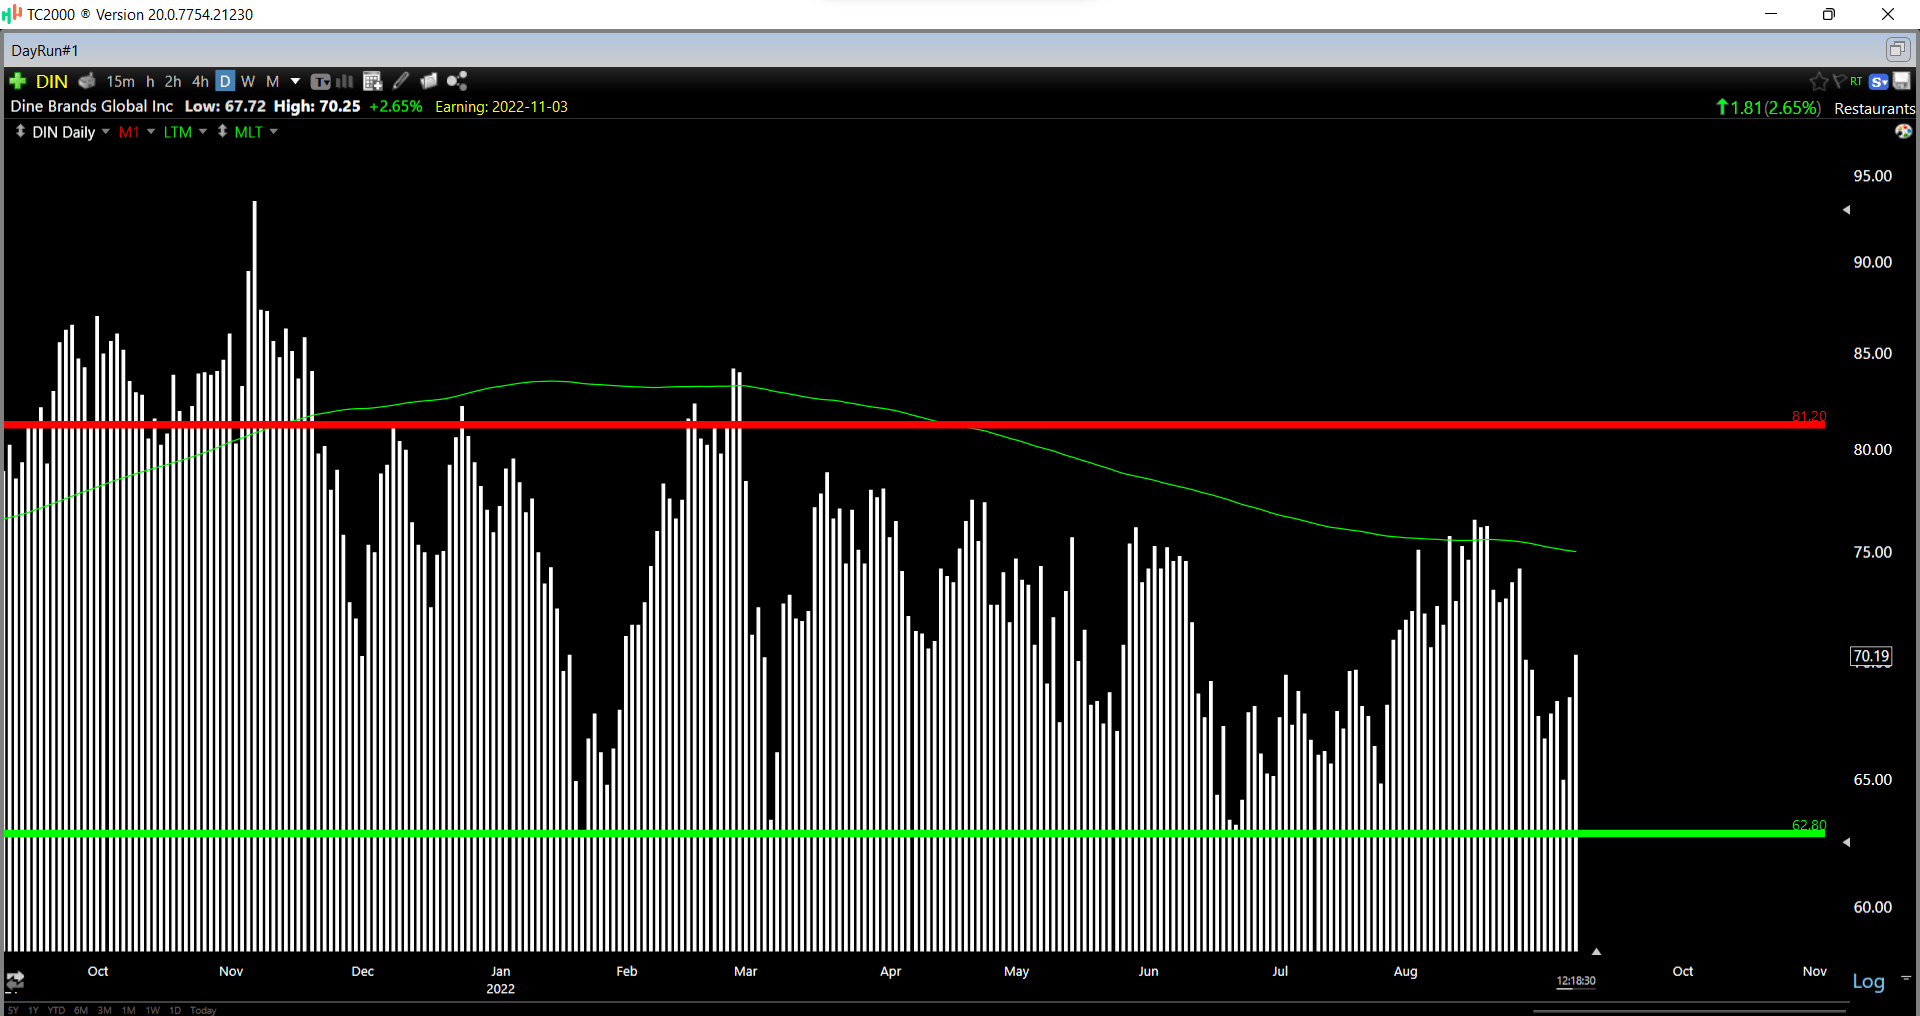
Notably, this area lines up with the technical picture, which shows an updated support level of $61.00 – $62.80, with incessant buying in this area suggesting clear demand from investors and the company (buyback program) at these levels. So, while I am neutral on Dine Brands at $70.30, after a 13% rally since June, I would expect any pullbacks into this technical support and value zone to provide buying opportunities ($60.40 – $62.80).
Summary
Dine Brands put together a solid Q2 performance given the industry-wide headwinds, and we could see a better Q3 than some were expecting, given the rapid decline in gas prices. However, even if inflation remains sticky and commodity costs remain elevated, Dine Brands continues to benefit from its asset-light model and its value proposition relative to other casual dining brands. Based on this superior positioning, I would view pullbacks below $62.80 as buying opportunities, with the most attractive buy zone being $60.40 or lower.
Be the first to comment