

photosbyjim/iStock via Getty Images
Introduction
Energy Transfer LP (NYSE:ET) – owned by billionaire Kelcy Warren – is a publicly-traded limited partnership classified as an energy-related services provider.
Its primary operations are midstream natural gas, intrastate, interstate transportation and storage assets, crude oil, natural gas liquids (“NGL”), and refined product transportation.
The company owns and operates one of the largest and most diversified portfolios of energy assets in the United States and is active in all major domestic production basins, making the stock one of the industry’s best choices.
ET: Map pipelines in the USA (Energy Transfer)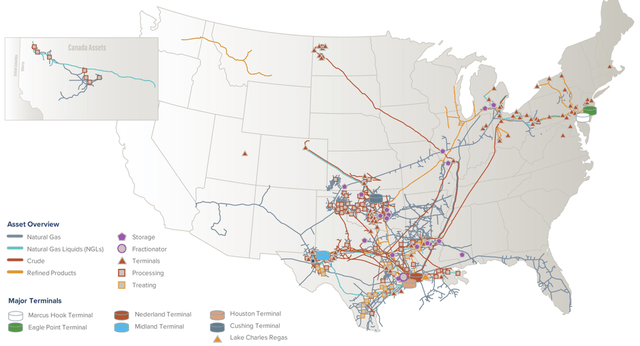
ET also owns Lake Charles LNG Company, the general partner interests, the incentive distribution rights and 28.5 million shares of Sunoco LP (SUN), and the general partner interests and 46.1 million shares of USA Compression Partners, LP (USAC).
On December 2, 2021, Energy Transfer announced that it had completed the acquisition of Enable Midstream.
CEO Tom Long said in the conference call:
For the full year 2021, we generated adjusted EBITDA of $13 billion, which was a significant increase over 2020 and in line with our expectations. DCF attributable to the partners of Energy Transfer, as adjusted, was $8.2 billion, which resulted in excess cash flow after distributions of approximately $6.4 billion. On an incurred basis, we had excess DCF of approximately $5 billion after distributions of $1.8 billion and growth capital of approximately $1.4 billion.
1 – 4Q21 and full-year Snapshot
On February 16, 2022, Energy Transfer LP reported net income attributable to partners for the three months ended December 31, 2021 of $921 million compared to $509 million in 4Q20.
Adjusted EBITDA for the three months ended December 31, 2021, was $2.81 billion compared to $2.59 billion for the three months ended December 31, 2020.
Distributable Cash Flow attributable to partners, as adjusted, for the three months ended December 31, 2021, was $1.60 billion compared to $1.36 billion for the same period last year.
In the fourth quarter of 2021, Energy Transfer achieved its highest volume of NGL transportation and fractionation (please look at the balance sheet table below).
ET: 4Q21 Highlight presentation (Energy Transfer LP)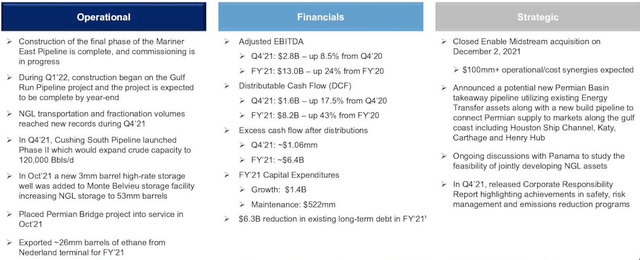
2 – Stock Performance
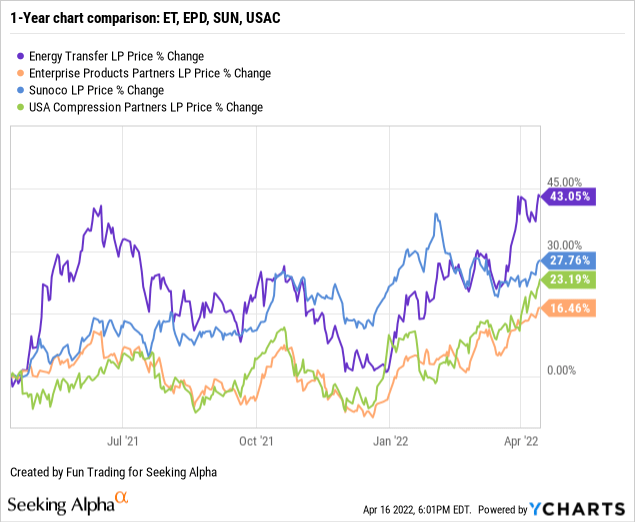
ET is up 43% on a one-year basis and has outperformed most of its peers on a one-year basis.
3 – Investment Thesis
As I said in my preceding article, the investment thesis for Energy Transfer is quite simple. I consider ET a solid long-term investment, particularly adjusted to dividend-oriented investors interested in a business model targeting the domestic distribution and storage of natural gas liquid. In my preceding article, I recommended accumulating ET at or below $8.20, and it paid off.
However, ET is now up 41% since my last recommendation, and it is vital to look at the stock price now and re-assess the valuation based on the new situation.
The energy sector received a significant boost recently as the war in Ukraine is about to end its second month.
One crucial component is that the company is paying a high-level dividend of 6.07% (versus EPD with 6.96% now) which I consider safe.
Energy Transfer announced a 15% increase in its quarterly distribution on common units. For the quarter ended December 31, 2021, Energy Transfer will pay a quarterly distribution of $0.175 per common unit ($0.70 annualized). – Source: Press release.
Of course, there are always risks attached to such a business which requires significant CapEx and is dependent on the oil and gas prices. Still, the solid balance sheet shows a steady free cash-flow-generation business model, and it is what investors should consider before any other considerations.
Another critical element is the debt level and the company’s ability to reduce it. Unfortunately, the net debt jumped this quarter; even so, Energy Transfer paid off about $400 million this quarter (excluding Enable’s acquisition). Furthermore, the debt decreased by $6.3 billion in 2021.
Finally, production is growing fast in the Permian basin, and demand is rising from new liquefied natural gas export plants on the Gulf Coast. ET seems well-positioned to build a new Permian pipeline.
Also, the company commenced building the Gulf Run pipeline in Louisiana to move gas from the Haynesville Shale in Texas, Arkansas, and Louisiana to the Gulf Coast. The project is expected to be completed by year-end 2022.
ET: Gulf Run Presentation (Energy Transfer)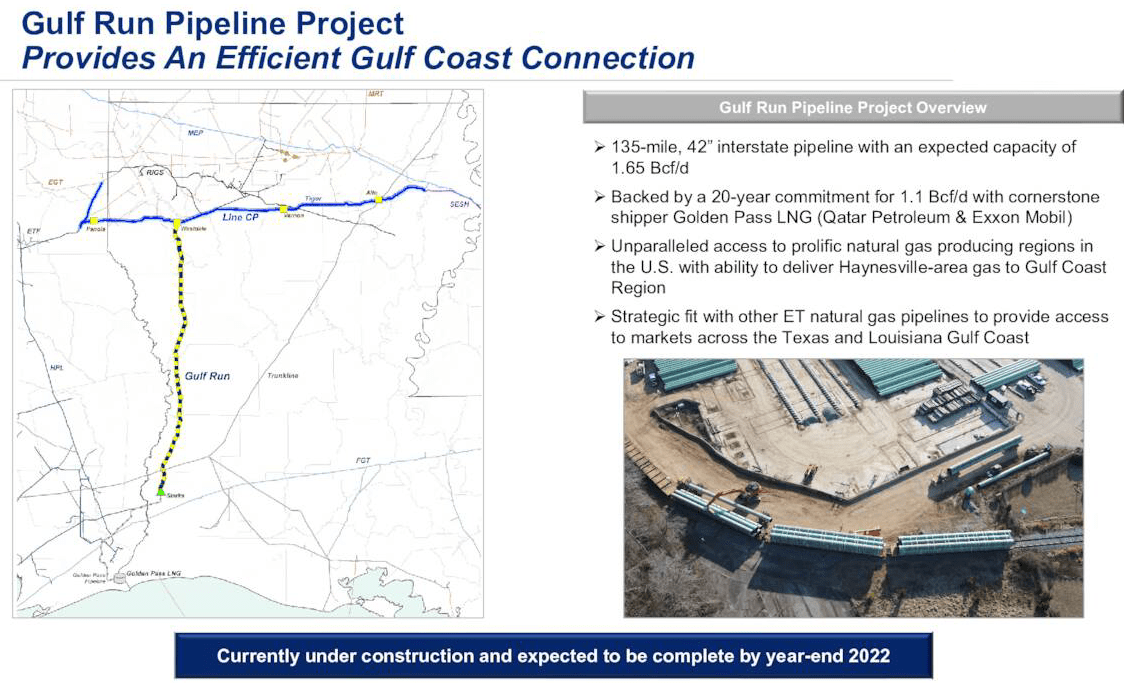
However, while the long-term investment thesis is indisputable, I recommend trading LIFO over 35% of your total position due to the high volatility in this ever-moving segment.
You will take full advantage of the sector’s cyclicality while keeping a long-term core position for a much higher target and getting paid.
Energy Transfer LP – Financial table 4Q21 – The raw numbers
| ET | 4Q20 | 1Q21 | 2Q21 | 3Q21 | 4Q21 |
| Total revenues in $ million | 10,034 | 16,995 | 15,101 | 16,664 | 18,657 |
| Net Income in $ Million | 636 | 3,288 | 626 | 635 | 921 |
| EBITDA $ Million | 2,442 | 5,259 | 2,496 | 2,485 | 2,715 |
| EPS diluted in $/share | 0.19 | 1.21 | 0.20 | 0.20 | 0.29 |
| Operating cash flow in $ Million | 1,906 | 5,155 | 2,005 | 2,263 | 1,739 |
| CapEx in $ Million | 1,100 | 698 | 731 | 617 | 776 |
| Free Cash Flow in $ Million | 806 | 4,457 | 1,274 | 1,646 | 963 |
| Total cash $ Million | 367 | 355 | 282 | 313 | 336 |
| Long-Term debt in $ Million | 51,438 | 47,735 | 46,286 | 45,471 | 49,702 |
| Dividend per share in $ | 0.1525 | 0.1525 | 0.1525 | 0.1525 | 0.175 |
| Shares outstanding (diluted) in Million | 2,699.2 | 2,708.6 | 2,717.8 | 2,720.6 | 2,830.6 |
| Oil and Gas Transportation | 4Q20 | 1Q21 | 2Q21 | 3Q21 | 4Q21 |
| Natural Gas transported BBTu/d | 12,634 | – | – | 12,335 | 14,765 |
| NGL Transportation volume MBbls/d | 1,449 | – | – | 1,803 | 1,872 |
| Crude oil transportation MBbls/d | 3,542 | – | – | 4,173 | 3,839 |
Sources: EP release
Analysis: Revenues, Earnings Details, Free Cash Flow, Debt, An Oil And Gas Production
1 – Total revenues and others were $18,657 million in 4Q21
ET: Chart Quarterly Revenues history (Fun Trading)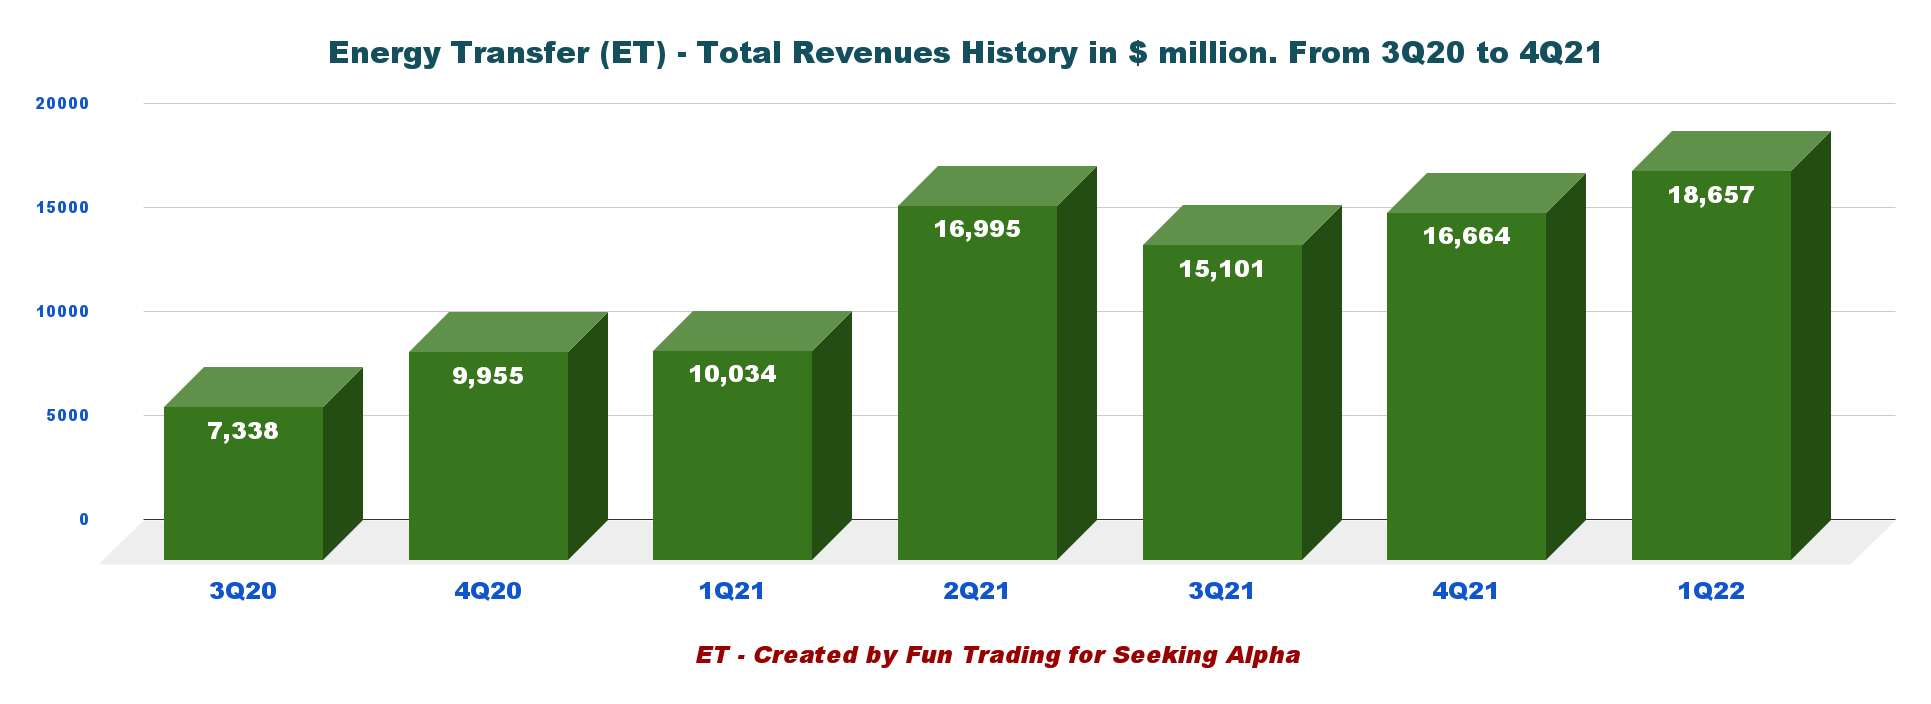
The revenues for the 4Q21 were $18,657 million with a net income of $921 million or $0.29 per diluted share. It was a solid improvement from the 4Q20.
Net income for the fourth quarter was $921 million, up 81% from a year ago.
ET tumbled early March after the company announced the sale of its 51% interest in its Canadian operations when Europeans showed interest in buying more U.S. natural gas, boosting the sector.
The sale is expected to result in cash proceeds to Energy Transfer of approximately C$340 million (U.S. $270 million), subject to certain purchase price adjustments. The transaction is expected to close by the third quarter of 2022.
It was an excellent opportunity to add to my long-term position. The proceeds will be used for domestic CapEx in 2022, expected to be between $1.6 billion to $1.9 billion.
ET: 2022 CapEx repartition Presentation (Energy Transfer)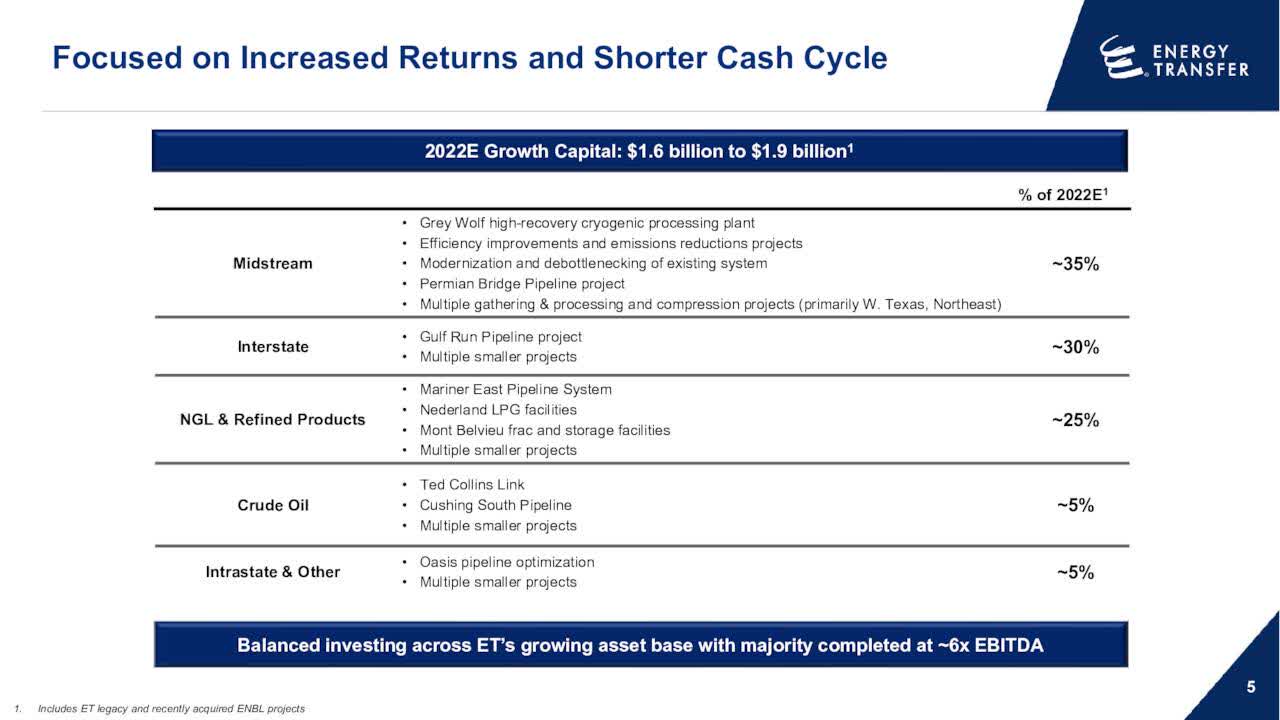
2 – Free cash flow was $963 million in 4Q21
ET: Chart Quarterly Free cash flow history (Fun Trading)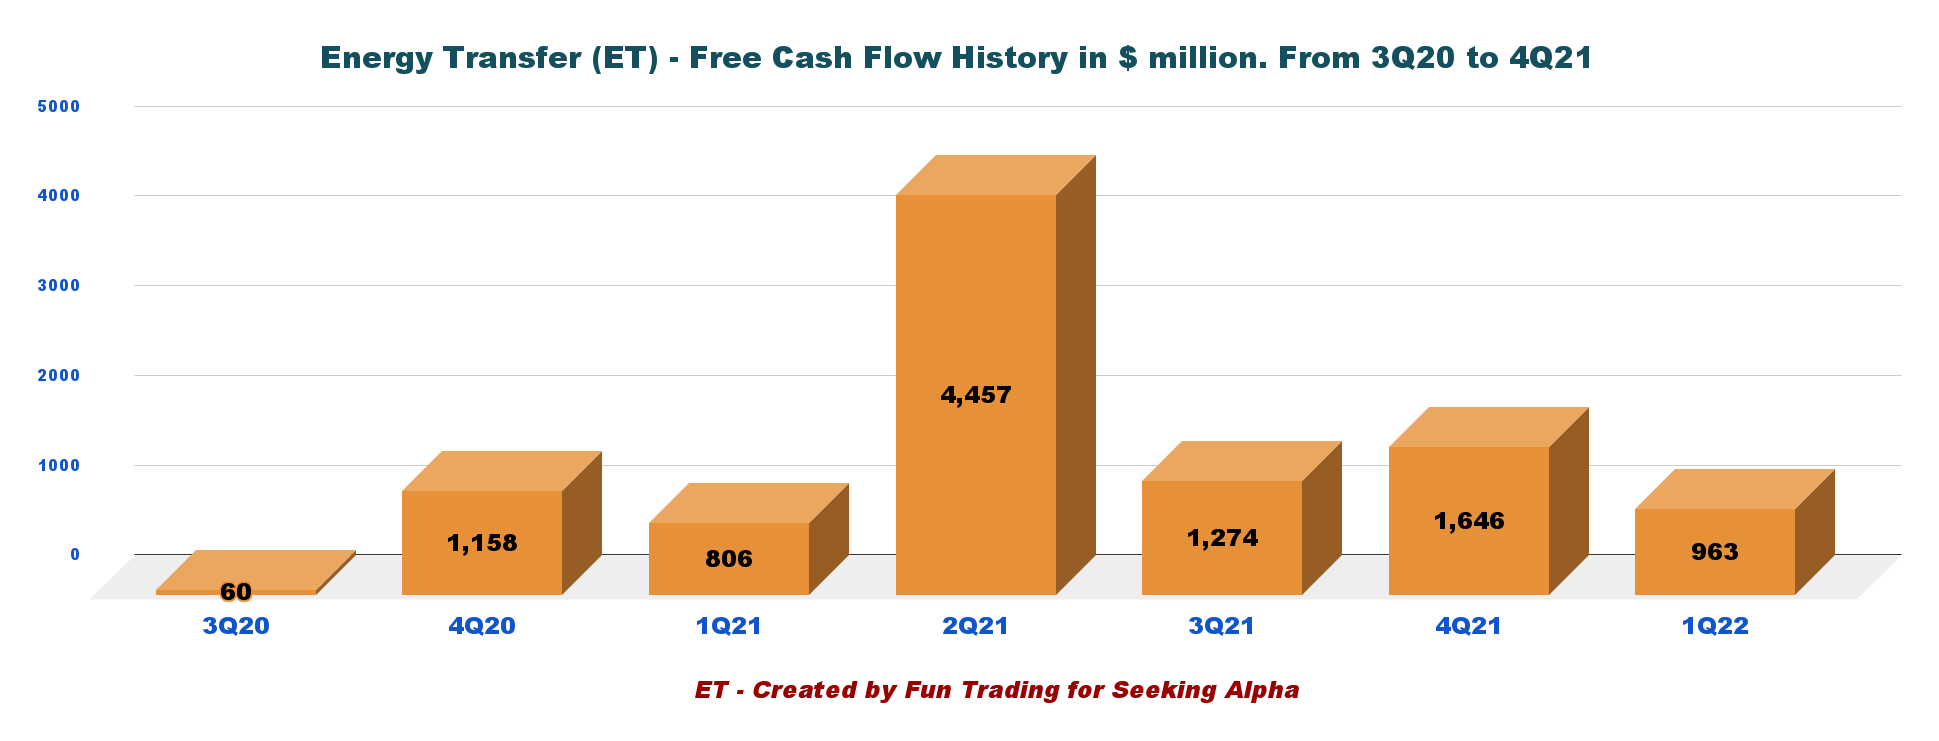
Note: Free cash flow is cash from operations minus CapEx.
Trailing twelve-month free cash flow is now $8.340 billion, and free cash flow for 4Q21 was $963 million.
3 – Net debt was $49.37 billion in 4Q21
ET: Quarterly Cash versus Debt history (Fun Trading)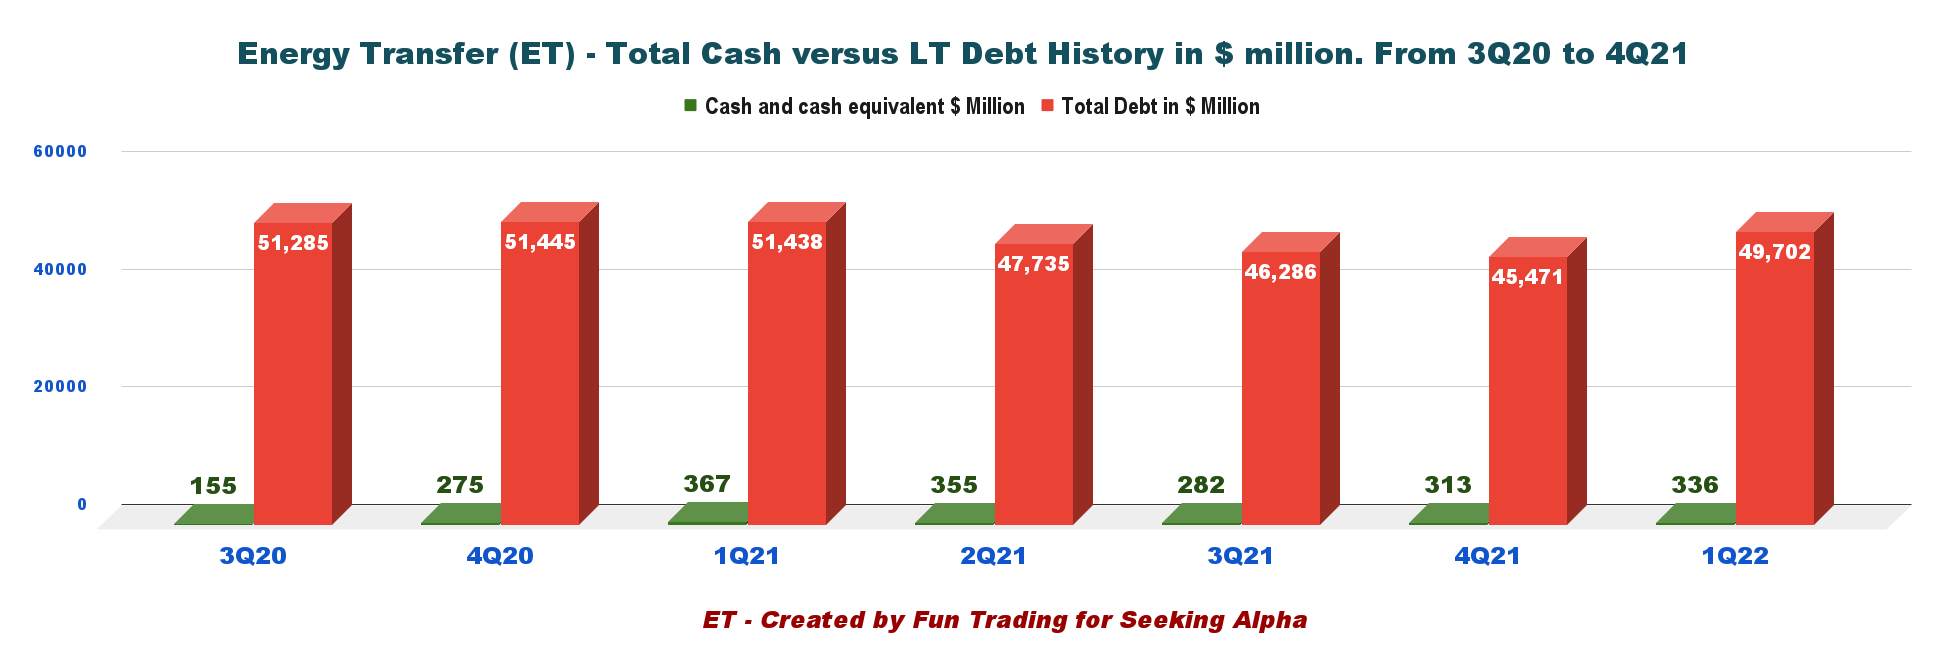
Cash and cash equivalent were $336 million in 4Q21, up 7.3% sequentially, and LT debt (including current) was $49.702 billion.
During the fourth quarter of 2021, the Partnership reduced outstanding debt by approximately $400 million. However, the total debt increased with the debt assumed from Enable’s acquisition.
For 2021, Energy Transfer reduced its existing long-term debt by approximately $6.3 billion.
As of December 31, 2021, the Partnership‘s $5.00 billion revolving credit facilities had an aggregate $2.03 billion of available capacity, and the leverage ratio, as defined by its credit agreement, was 3.07x.
Technical Analysis (Short Term) And Commentary
ET: TA Chart short-term (Fun Trading)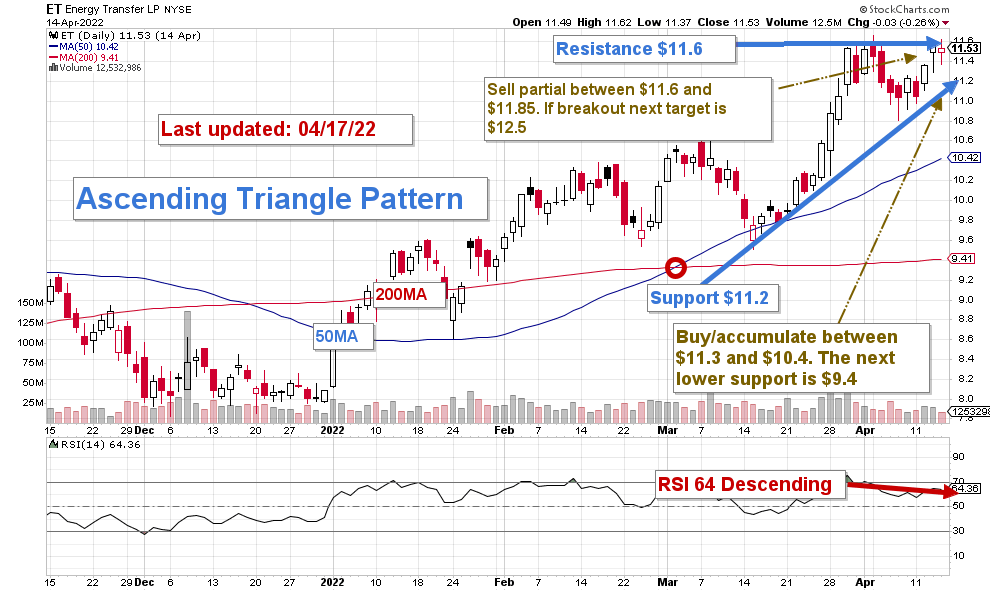
Note: The chart is adjusted for the dividend.
ET forms an ascending triangle pattern with resistance at $11.6 and support at $11.20. The pattern is close to its apex, suggesting a strong move up or down with a line-crossing soon.
The ascending triangle pattern shown above is a bullish continuation pattern, which means a possible breakout may occur. However, it will be entirely up to the underlying commodities’ momentum price.
The trading strategy is to sell 30% to 35% of your position between $11.60 and $11.85 with a potential new higher resistance at $12.50-$13.50 in case of a breakout. Watch the volume. It is an excellent indicator in this case.
On the other hand, it is reasonable to start accumulating below $11.2 with a potential low at $10.40. However, if the sector turns bearish in the next few weeks or months, the next lower support is $9.40.
Warning: The TA chart must be updated frequently to be relevant. It is what I am doing in my stock tracker. The chart above has a possible validity of about a week. Remember, the TA chart is a tool only to help you adopt the right strategy. It is not a way to foresee the future. No one and nothing can.
Author’s note: If you find value in this article and would like to encourage such continued efforts, please click the “Like” button below as a vote of support. Thanks!
Be the first to comment