


peshkov
Thesis
Much of recent discussions on oil stocks have been surrounding Warren Buffett’s positions in Chevron Corporation (CVX) and Occidental Petroleum Corporation (OXY). Buffett’s independent and long-term thinking are good reasons to make his actions a market event. And I totally share his overall bullish view on the energy sector.
In this article, I will invite you to just forget about Buffett’s actions and perform our independent evaluations on a leading oil stock, Energy Transfer (NYSE:ET), a stock that Buffett does not hold. And you will see that it is indeed an excellent stock, featuring outsized return potentials in the next few years. More specifically, you will see that the following fundamentals drivers can support a 10%+ annual return even under conservative assumptions:
- The combination of its elevated utilization level and high oil and gas prices. Its expansion projects are expected to make it the world’s biggest exporter of NGLs (Natural Gas Liquids), at a time when the supply-demand imbalance is expected to continue and robust NG prices are expected to persist.
- A strong pipeline of growth projects should lead to annual earnings growth of well over 10% in the next 3- to 5-year timeframe. Two of the notable projects include the Frac 8 facility and the Lake Charles NGL & processing facility.
- And finally, its currently compressed valuation provides a thick margin of safety and good odds for unit price appreciation even after unit dilutions are considered.
Elevated Asset Utilization levels
ET’s utilization levels were elevated across its various infrastructure in the June interim, and I expect such efficient operations to continue to produce robust results going forward.
As a result, management has revised upwards its 2022 EBITDA guidance from $12.2 billion-$12.6 billion to $12.6 billion-$12.8 billion. And management optimism is fully supported by the operation metrics as you can see from the following chart. The chart shows its asset utilization in the past decade. Currently, its asset utilization is about 0.79x. To put things under historical perspective, the utilization has fluctuated between as low as 0.36x to about a peak of 1.0x with an average of 0.635x. It dipped to the bottom level shortly after the pandemic as seen. Then it recovered quickly to the current level of 0.79x, not only far above its historical average by more than 25% in relative terms, but also close to its peak level in a decade.
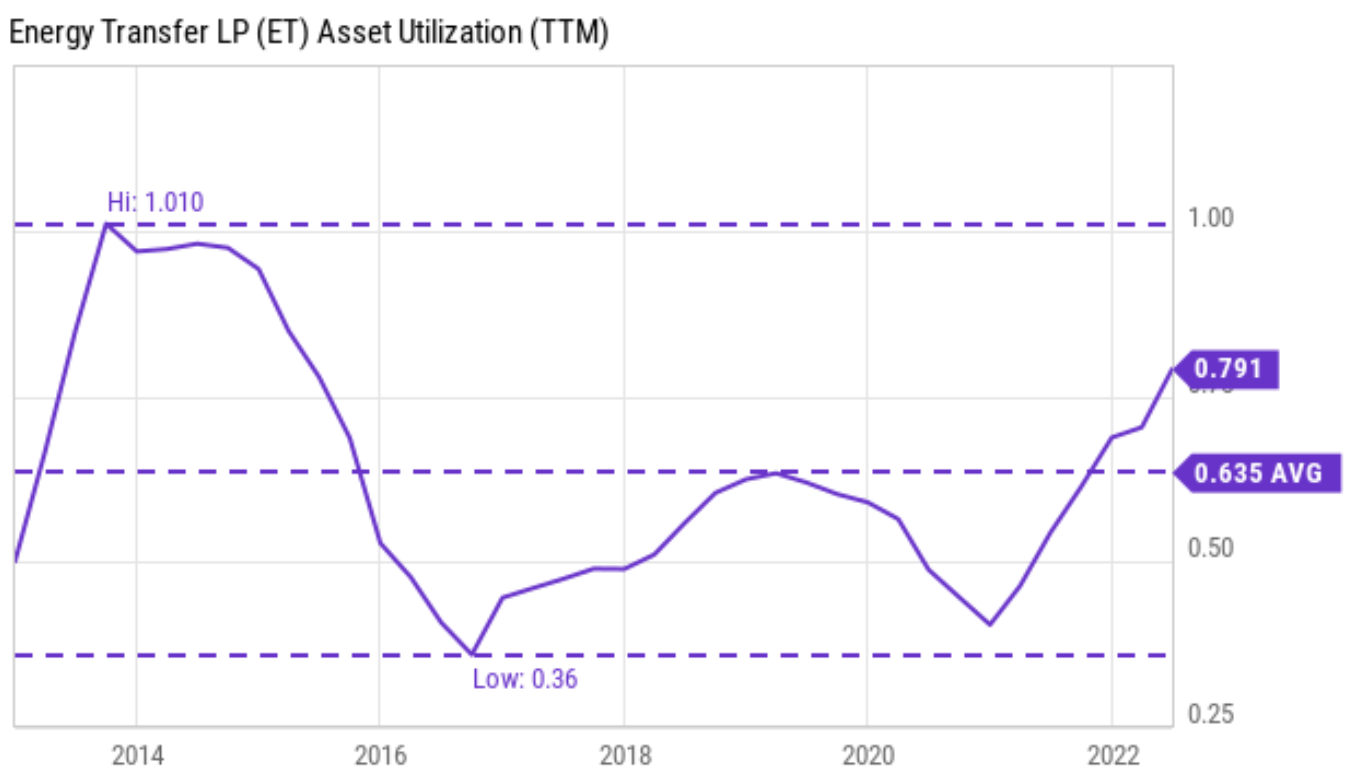
Source: Seeking Alpha data
Robust growth ahead
The elevated operation level analyzed above, when combined with its pipeline of expansion projects and robust natural gas prices, provides a perfect recipe for profit growth ahead in my mind. Here I will cite a few key projections. Its Mariner East pipeline system is fully commissioned and capable of transporting more than 365,000 barrels of NGL per day. The Nederland Terminal should also be able to increase its volume to bring total ethane shipments to 40 million barrels in 2022. The management further expects it to rise to 60 million barrels in 2023. These projects should strengthen its position as the world’s biggest exporter of NGLs, accounting for approximately 20% of the global market – at a time when I expect the energy supply-demand imbalance to continue and the robust pricing environment to persist.
Take its Lake Charles property as an example. The contracts at this property are indexed to the Henry Hub benchmark plus a fixed liquefaction charge. And shipments should commence once Lake Charles is operational in 2025-2026. And NG prices are currently very favorable for ET. As you can see from the following chart, the U.S. monthly average Henry Hub spot price this year (the thick blue line) currently stands at $6.6 per million British thermal units (MMBtu). The price nearly doubled in the past 12 months (it was in the $3.8/MMBtu range back in mid-2021). The price peaked at near $10/MMBtu in early 2022. The chart also put the current prices under a broader historical perspective by showing a 1-year seasonal analysis. The thinner lines in the chart show the 10-year seasonal analysis dating back one decade. As seen, the natural gas prices this year, since April 2022, have been far above historical levels.
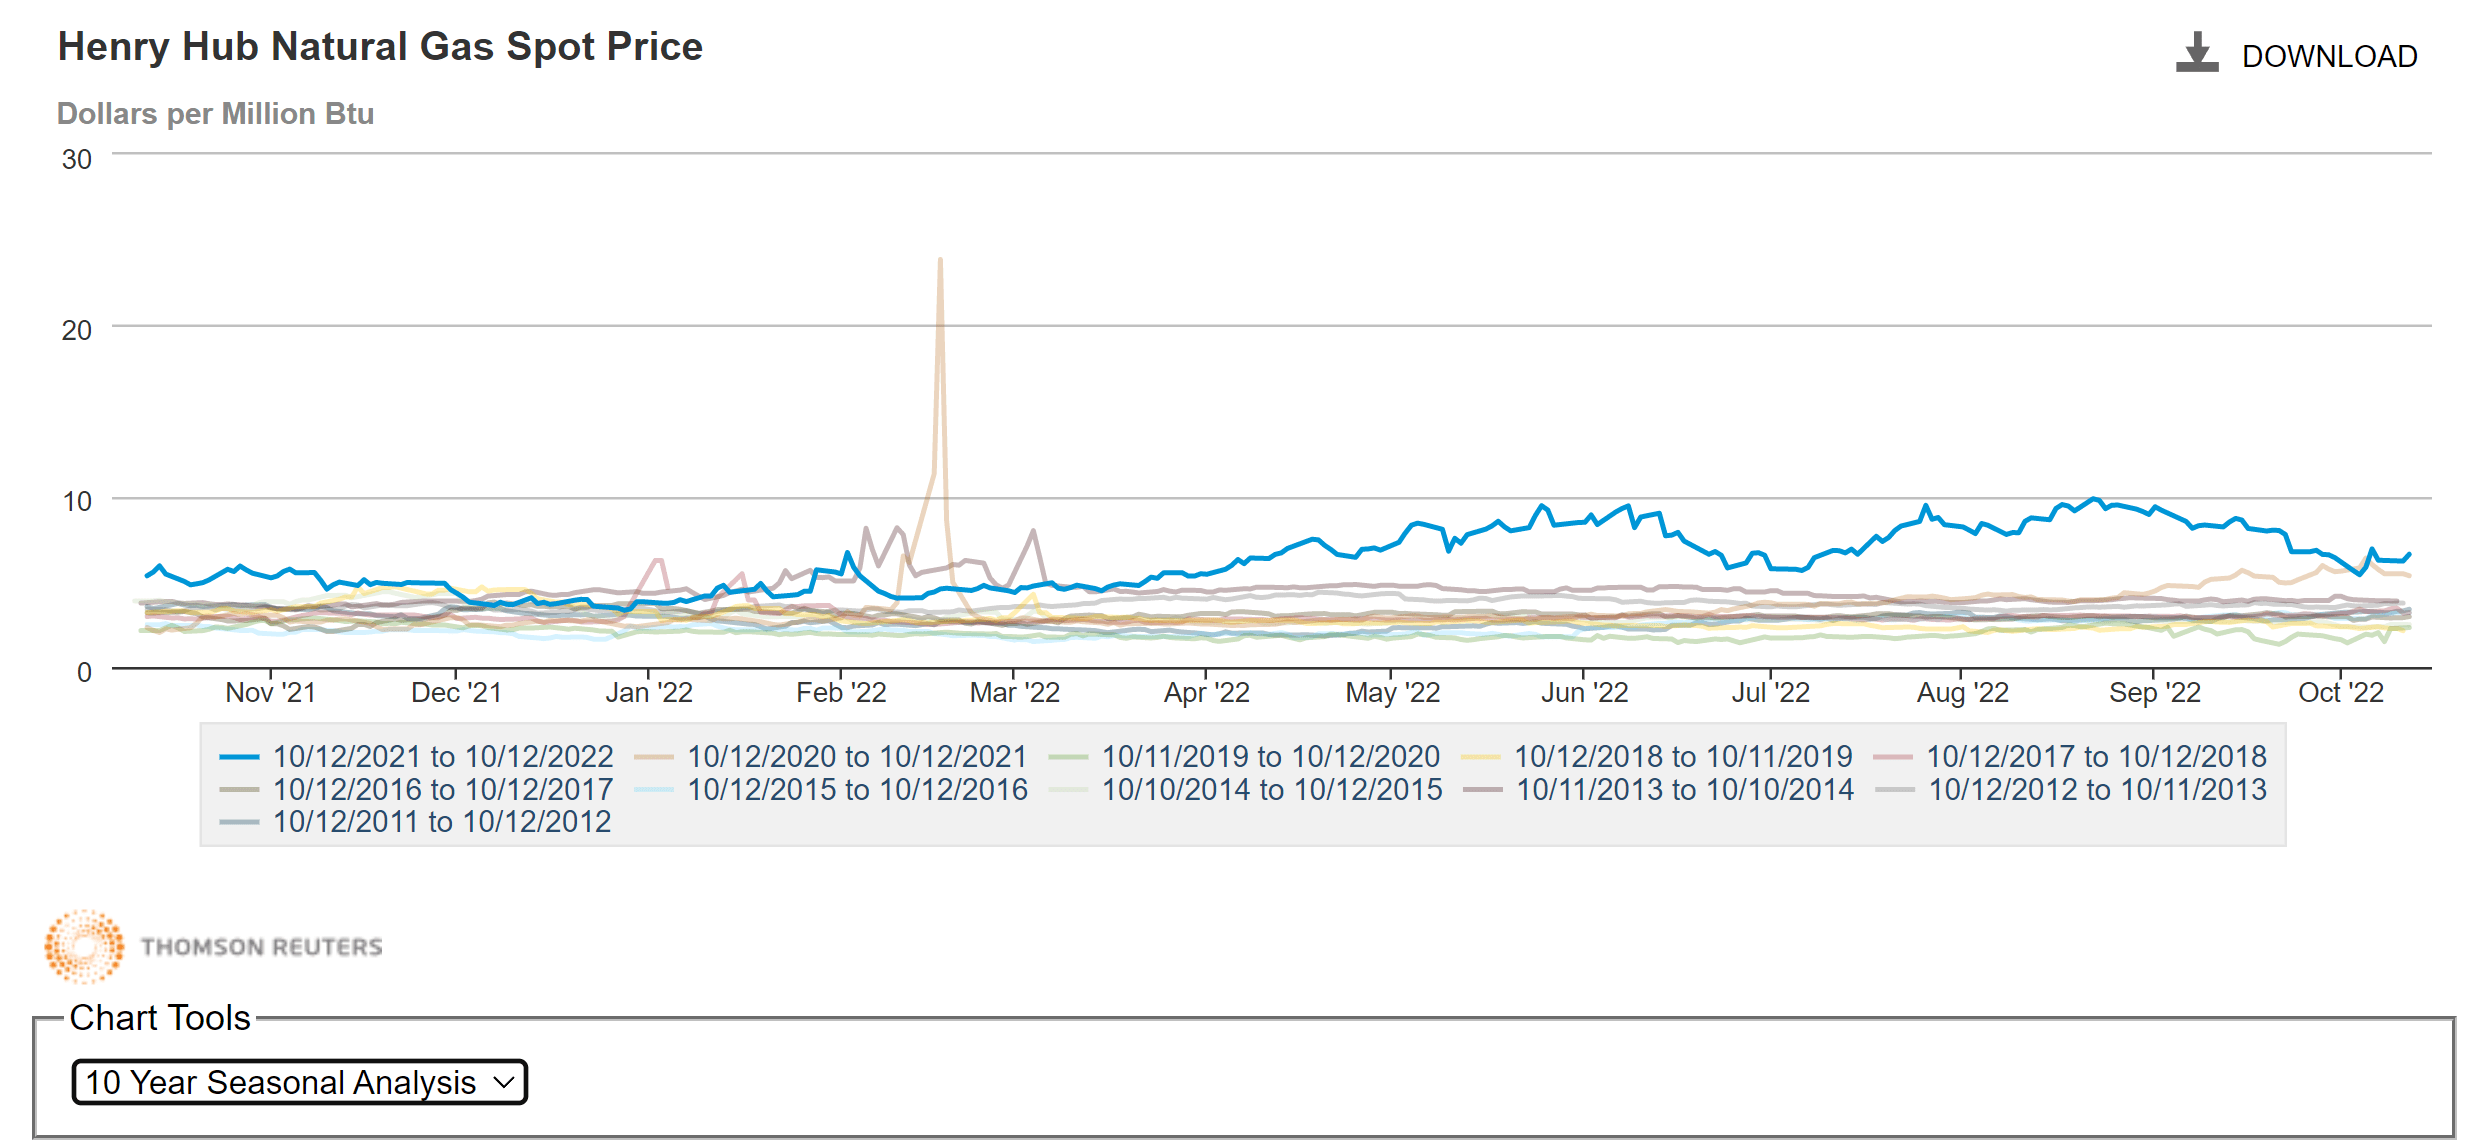
Source: EIA.gov
Looking forward, I foresee the supply-demand imbalance to keep the prices high. The following EIA report cited several factors that have contributed to the rising natural gas prices:
- Colder-than-normal temperatures resulted in total natural gas consumption exceeding the five-year (2017–21) average.
- Growth in economies in Asia and constraints on liquefied natural gas (LNG) exports to Europe from Russia have contributed to strong international demand for natural gas, resulting in increased U.S. LNG exports.
- These above factors could kept inventory low as you can see from the chart below. The chart shows the working natural gas inventory in the lower 48 states in underground storages over the past five years in billion cubic feet. The gray area shows the previous five-year range and the dotted line the average. The current level (shown by the thick red line) is below the average. And what is really alarming is that it is toward the lower end of the range.
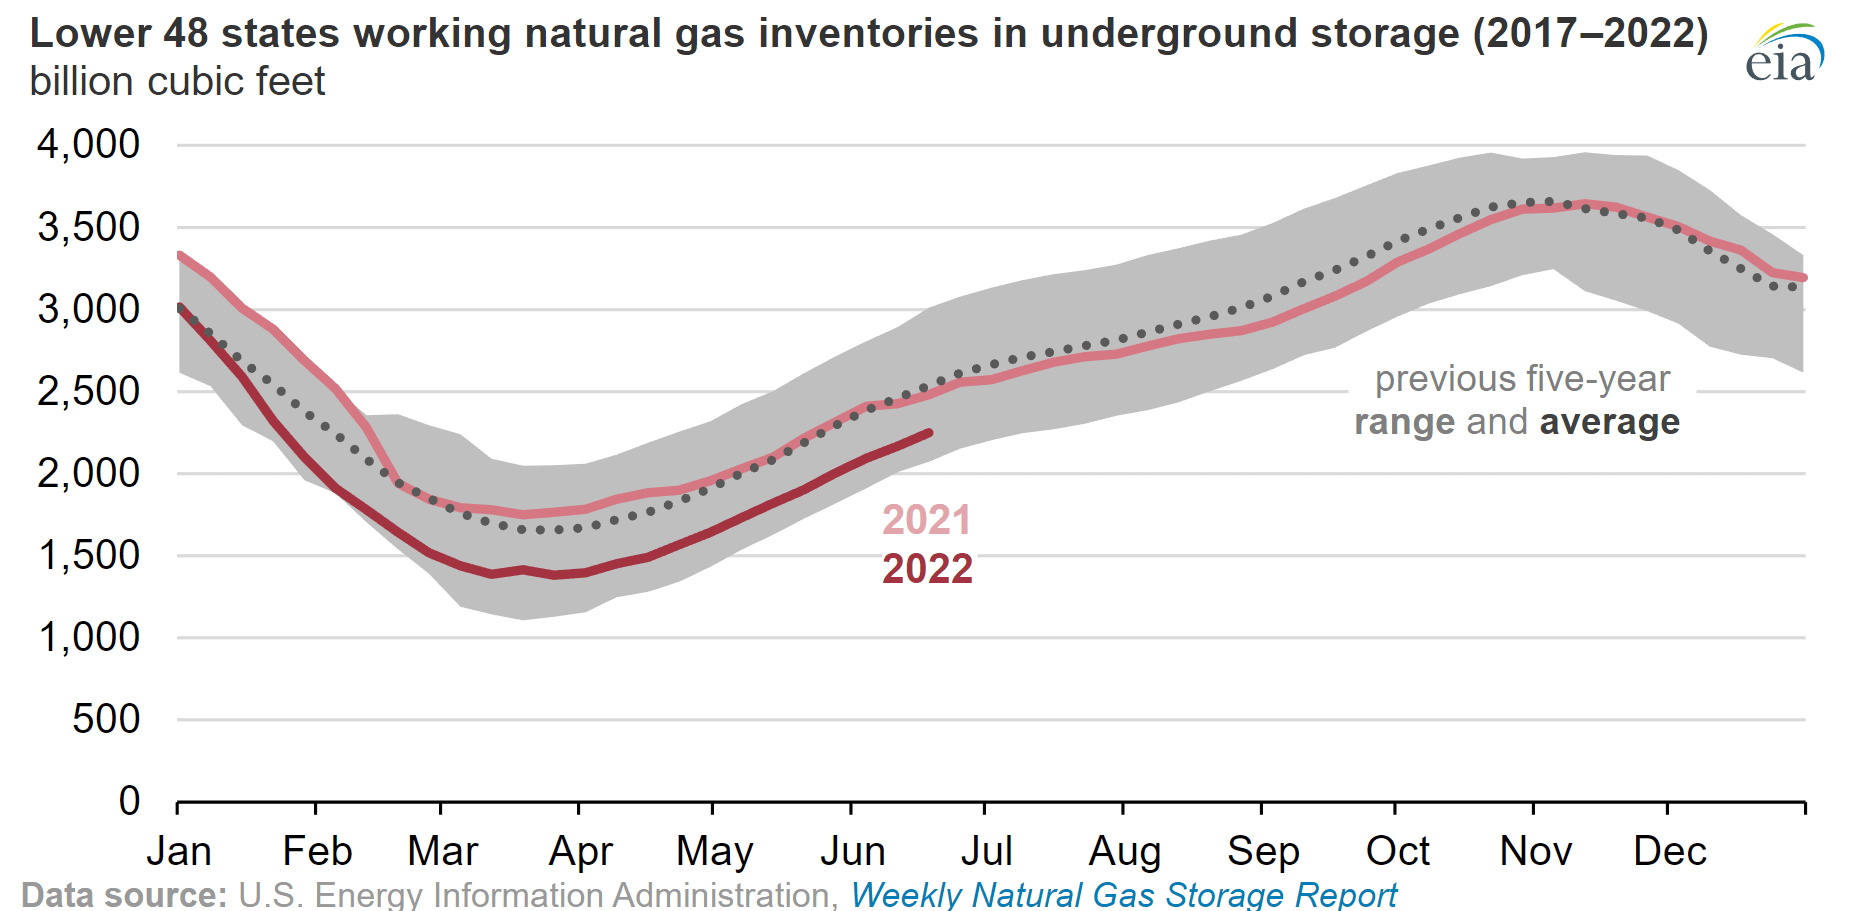
Source: EIA.gov
Valuation and Return projections
Onto valuation. My take is that the stock is currently undervalued at a 7.98x EV/EBITDA ratio. As you can see from the following chart, historically, its EV/EBITDA multiple has fluctuated in the past 5 years between 5.9x to 18.4x with an average of 10.9x. Therefore, its current multiple is below its historical average by about 23%.
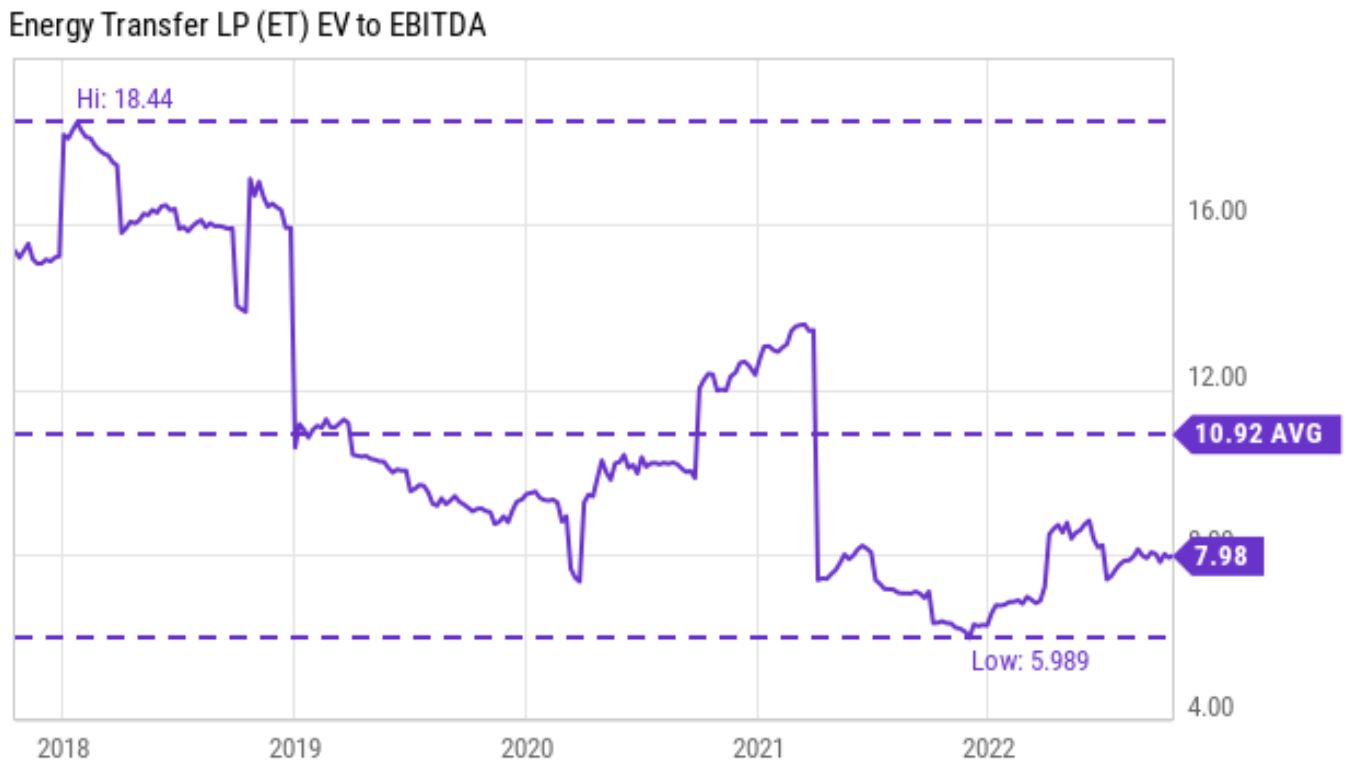
Source: Seeking Alpha data
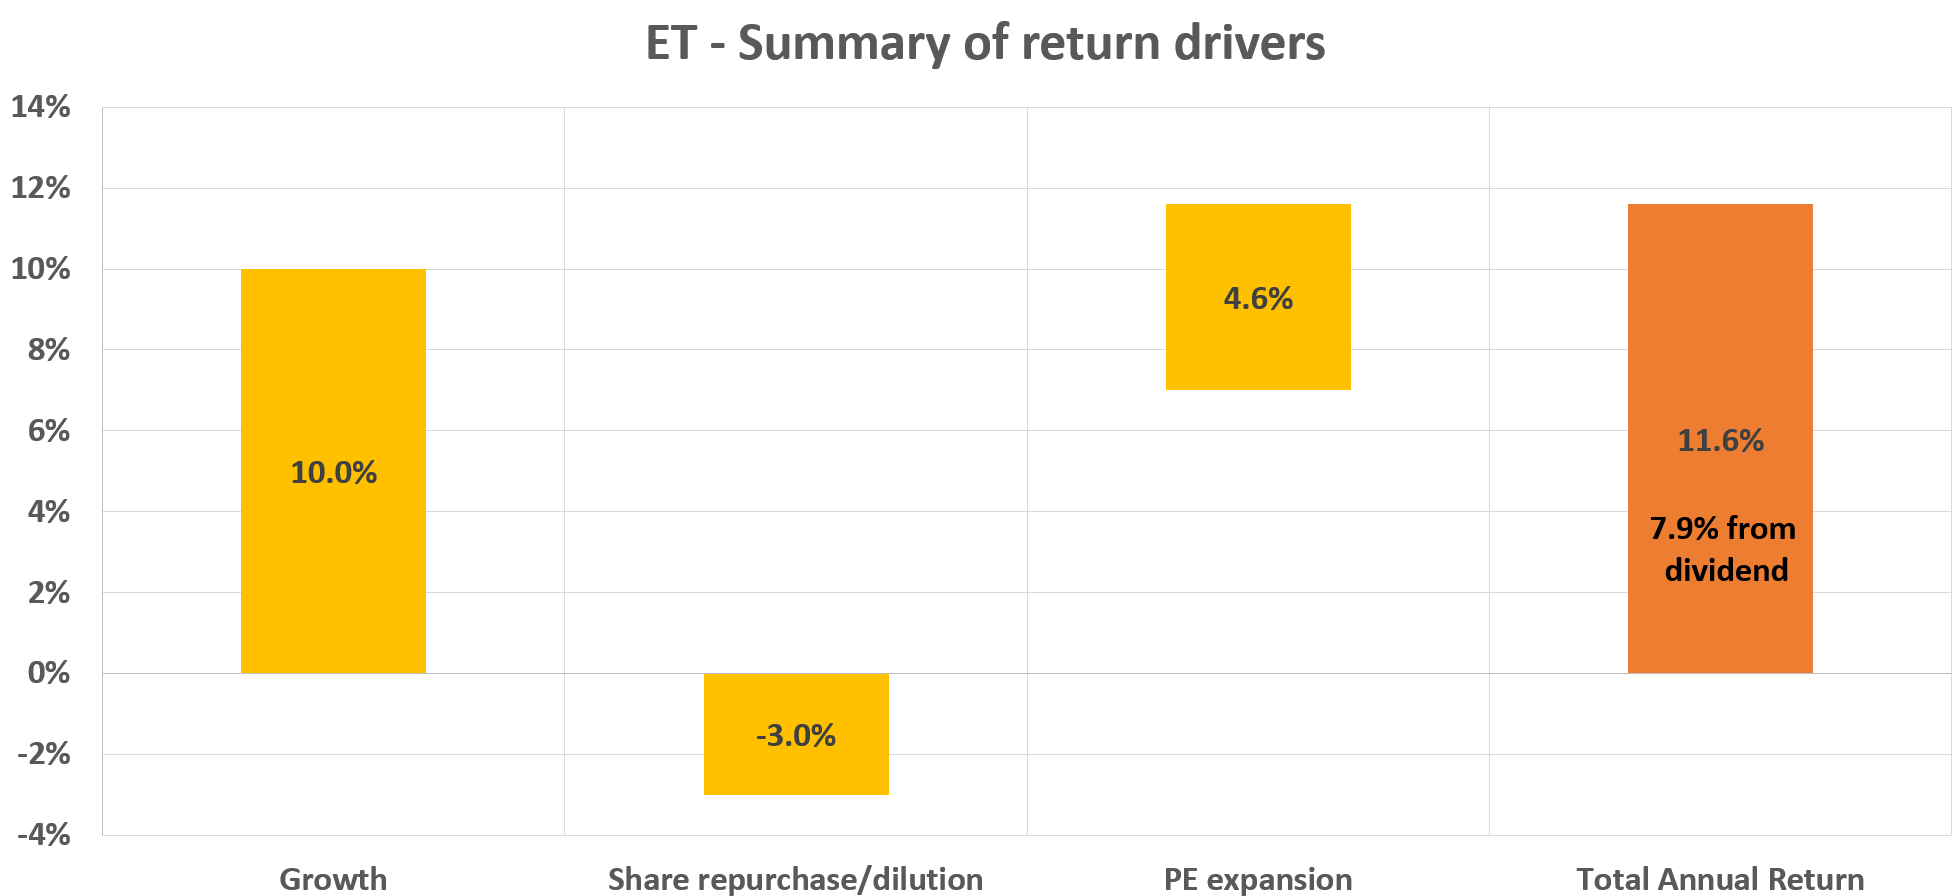
Based on the above analysis of its growth potential and valuation compression, the following chart shows a conservative return scenario. In this scenario, I considered the following return drivers:
- 10% growth in total profit given the expansion projects mentioned above.
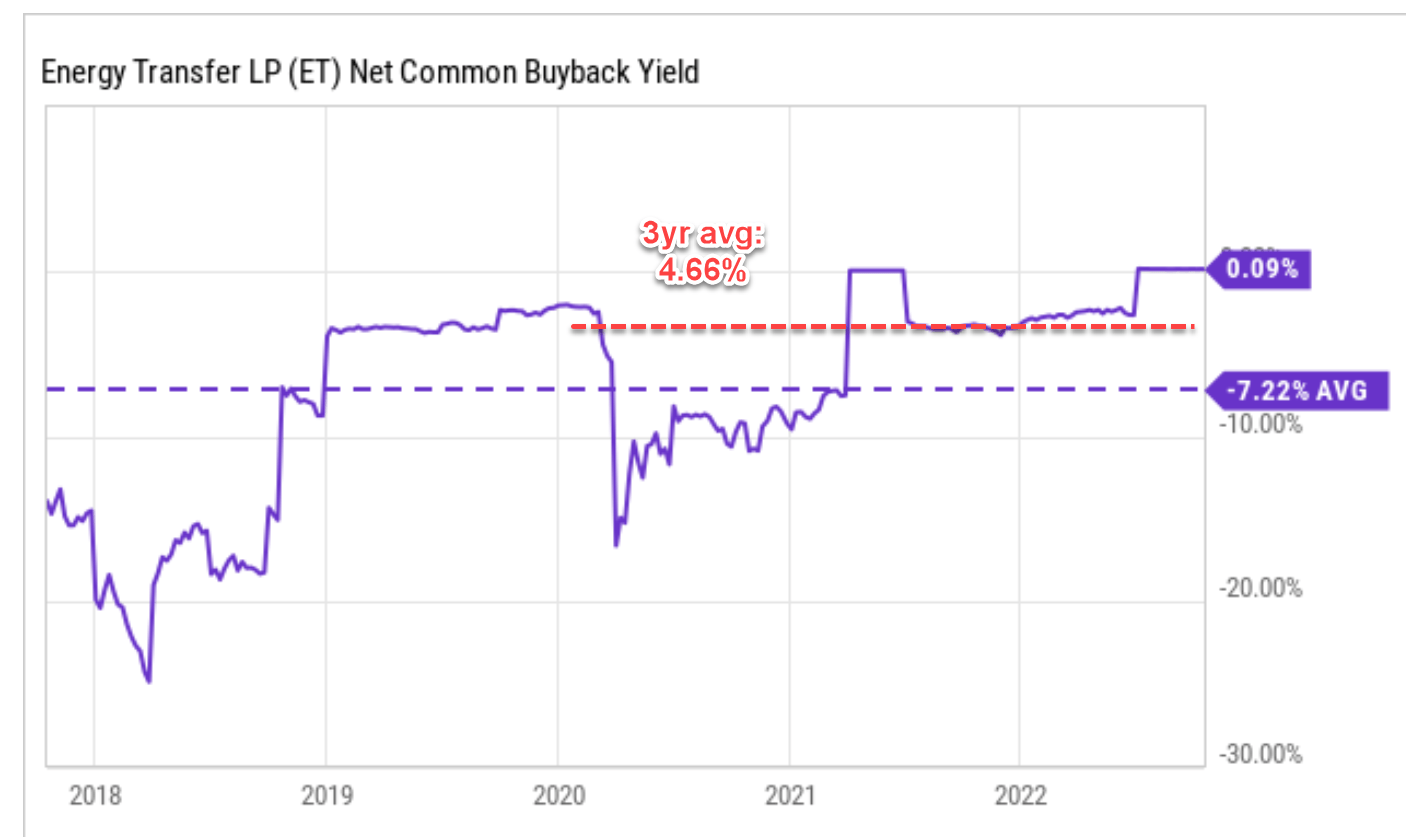
- 3% unit dilution. And I view it as a conservative estimate. Admittedly, ET has been diluting its units at higher rates in the past (for example, at about 7.2% per year on average in the past 5 years as seen in the 2nd chart below). However, those were the lean years for the energy sector with compressed oil and natural gas prices. With the current favorable environment, I expect ET’s unit dilution to dramatically slow or even stop. For example, its unit dilution in the past 3 years has averaged at only 4.6% per year (compared to 7.2% in the past 5 years).
- A valuation revision to the mean. As aforementioned, ET is currently at a 23% discount compared to its historical average. A reversion to the mean in 5 years will cause about a 4.6% annual return.
Based on the above return drivers, the annual return should be around 11.6% a year as shown below. And note that a large portion of the total return is provided via its generous and very safe 7.9% current dividend yield.
Source: Author based on Seeking Alpha data
Source: Author based on Seeking Alpha data
Risks and final thoughts
In terms of risks, ET faces the common regulation, political, and macroeconomic risks as the rest of the energy sector. On top of these common risks, there are a few risks specific to ET that are worth mentioning. First, its financial strength (only B+) is weaker than other energy stocks considering its leverage. As a result, its volatility risks are also higher, both due to the cyclical nature of the commodity sector and its financial strengths. If you recall, an early chart shows that its EV/EBITDA multiple changed from a bottom of 6x to a peak of 18x, by threefold in only 5 years. Rising interest rates could further pressure its debt service burden and increase the company’s cost of capital. Some of its projects have also been facing long-running legal battles (such as the Dakota Access pipeline), again illustrating the legal and regulatory risks.
All told, my view is that the above risks are properly compensated by the return potential. I see the combination of a few strategic catalysts supporting a double-digit annual return even under conservative assumptions. The catalysts include its elevated utilization level, robust oil and gas prices, a strong pipeline of growth projects, and compressed valuation. To add further safety to the investment, a large part of the total return is provided by its 7.9% current dividend yield already.
Be the first to comment