

zorazhuang
Energy Transfer: Fee-Based Contracts Provide Solid Visibility
Energy Transfer LP (NYSE:ET) has been a massive winner for its holders in 2022, as it outperformed the S&P 500 (SPX) (SP500) significantly. With a YTD total return of nearly 57%, it also edged out the Energy Select ETF’s (XLE) 53% YTD gain.
As a leading midstream player in the US with a well-diversified portfolio spanning oil, gas, and NGLs, it has also benefited from the surge in underlying commodity prices in 2022. As a result, relative to its TTM dividend yield of 7.5%, its capital appreciation has been a boon for ET investors.
Therefore, we believe it’s crucial for investors to assess whether the reward/risk still favors adding aggressively at the current levels or if they should wait for a deeper pullback.
We assessed that ET’s relative undervaluation to its peers should still favor adding on pullbacks. The company remains confident that its operating performance is not directly linked to underlying volatility in commodity markets. Energy Transfer accentuated that “the vast majority of the Partnership’s segment margins are fee-based and therefore have limited commodity price sensitivity.”
Hence, it should continue to provide solid visibility into its distributable cash flows (DCF) as management looks to restore its annualized distribution of $1.22 per share.
But, Analysts Still Expect A Marked Slowdown
Energy Transfer Adjusted EBITDA change % and DCF per share change % consensus estimates (S&P Cap IQ)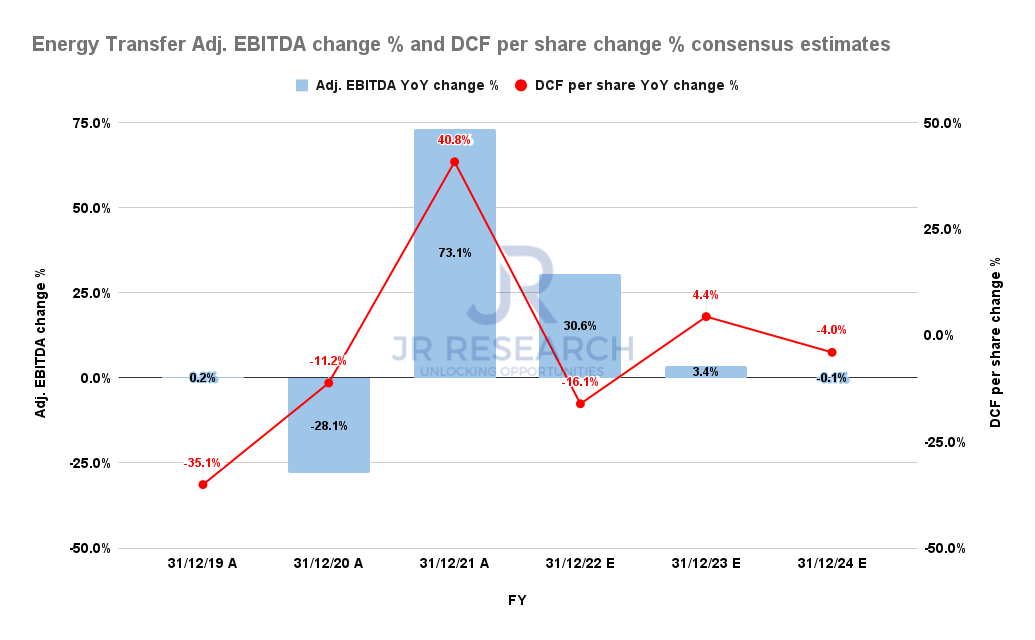
Despite that, Wall Street analysts have penciled in significant deceleration in the growth of its adjusted EBITDA estimates in 2023, given the remarkable performance in 2022.
As such, analysts on its recent Q3 earnings call prodded management to consider its capital allocation priorities to increase buybacks, reduce share count further, and improve its distribution for holders.
While management did not rule out pursuing a more aggressive buyback policy, it remains focused on improving its distribution first as it continues to pay down debt.
Therefore, it’s possible that the Street may not have reflected positive upside surprises from a more aggressive repurchase authorization moving ahead.
Crude Oil And Natural Gas Price Action Have Weakened
However, the bifurcation between the European natural gas (NG1:COM) crisis and the near-term weakness in WTI crude (CL1:COM) needs to be reflected.
Crude oil futures have continued to trade down, even as OPEC+ highlighted that further production cuts should not be ruled out if demand weakens further.
Citi (C) also highlighted in a recent commentary that it sees downside risks at the current levels, as the recent optimism over China’s COVID reopening could have been overstated.
In addition, Citi sees significant supply coming online against the horizon of potentially lower demand, worsened by increased risks of a global recession. We also highlighted our thesis that investors could have understated the macro risks impacting crude oil in our early December piece on the XLE.
In contrast, the natural gas crisis in Europe has continued to keep NG1 high, helping to deliver record performance for energy companies. In addition, Bloomberg released a report highlighting why Europe’s natural gas crisis could continue in earnest through 2026 as they deal with refilling their storage tanks, with Chinese demand postulated to recover in 2023.
However, the recent gas price cap agreed upon by the EU politicians has appeared to invite sellers back into the futures market as Europe looks to stamp out unsustainable price surges from next February.
It’s still debatable whether the price cap would be effective, as energy strategists couldn’t concur. Moreover, there are concerns that such a mechanism could worsen the volatility in the spot market, driving liquidity toward the OTC markets.
Takeaway
Dutch TTF futures price chart (weekly) (TradingView)
We gleaned that Dutch TTF futures have faced significant resistance at their 50-week moving average (blue line). Therefore, it suggests that further downside cannot be ruled out, threatening its medium-term uptrend bias from 2020. For now, the momentum is uncertain, but the rejection against its December highs is unconstructive.
ET price chart (weekly) (TradingView)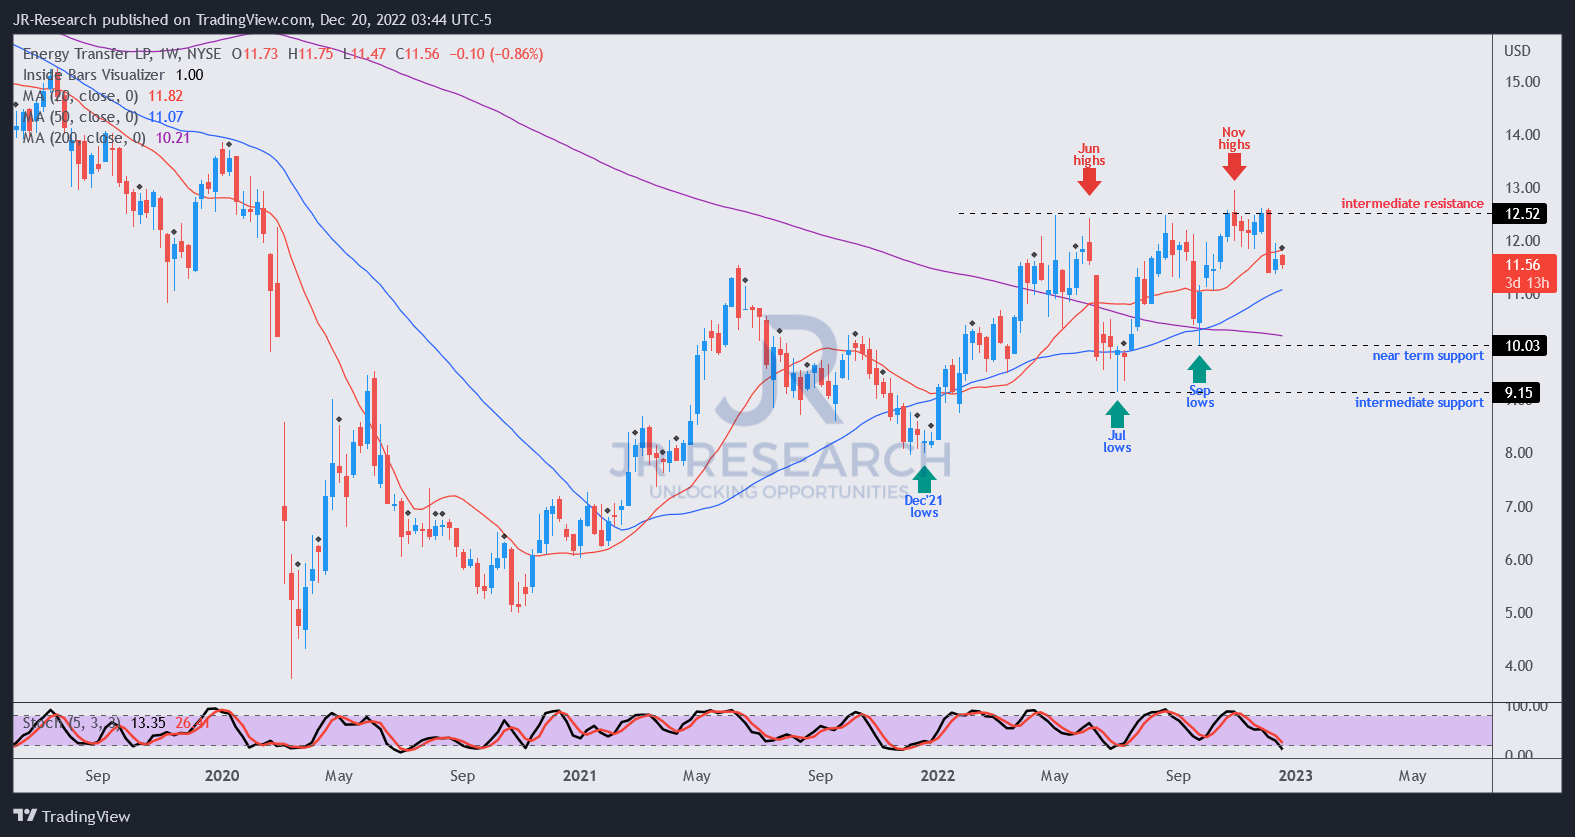
ET’s price action at its November highs validated a bull trap that has kept buyers at bay since its May/June highs.
However, buyers have returned to defend pullbacks to its 50-week moving average (blue line) in July and September. Therefore, we urge buyers to remain cautious here as ET remains close to its November bull trap.
As such, the reward/risk is likely skewed to the downside from these levels if the market anticipates a worse-than-expected downturn.
ET is still expected to report solid profitability margins through the downcycle. However, unless ET can mitigate the slowdown against its profitability growth, a material re-rating from the current levels look challenging.
Maintain Hold for now.
Be the first to comment