

eyegelb/iStock via Getty Images
We’ve finally reached the close of the Q4 Earnings Season for the Gold Miners Index (GDX), and one of the most recent companies to report its results was Endeavour Mining (OTCQX:EDVMF). True to form, the company beat guidance and enjoyed significant growth, marking 9 years of meeting or exceeding guidance. This was helped by two key acquisitions and partially offset by a non-core divestment. Given Endeavour’s high-quality business model with the potential for ~30% production growth (vs. FY2022) later this decade at ~50% AISC margins, I would view sharp pullbacks as buying opportunities.
Endeavour Mining Operations (Company Presentation)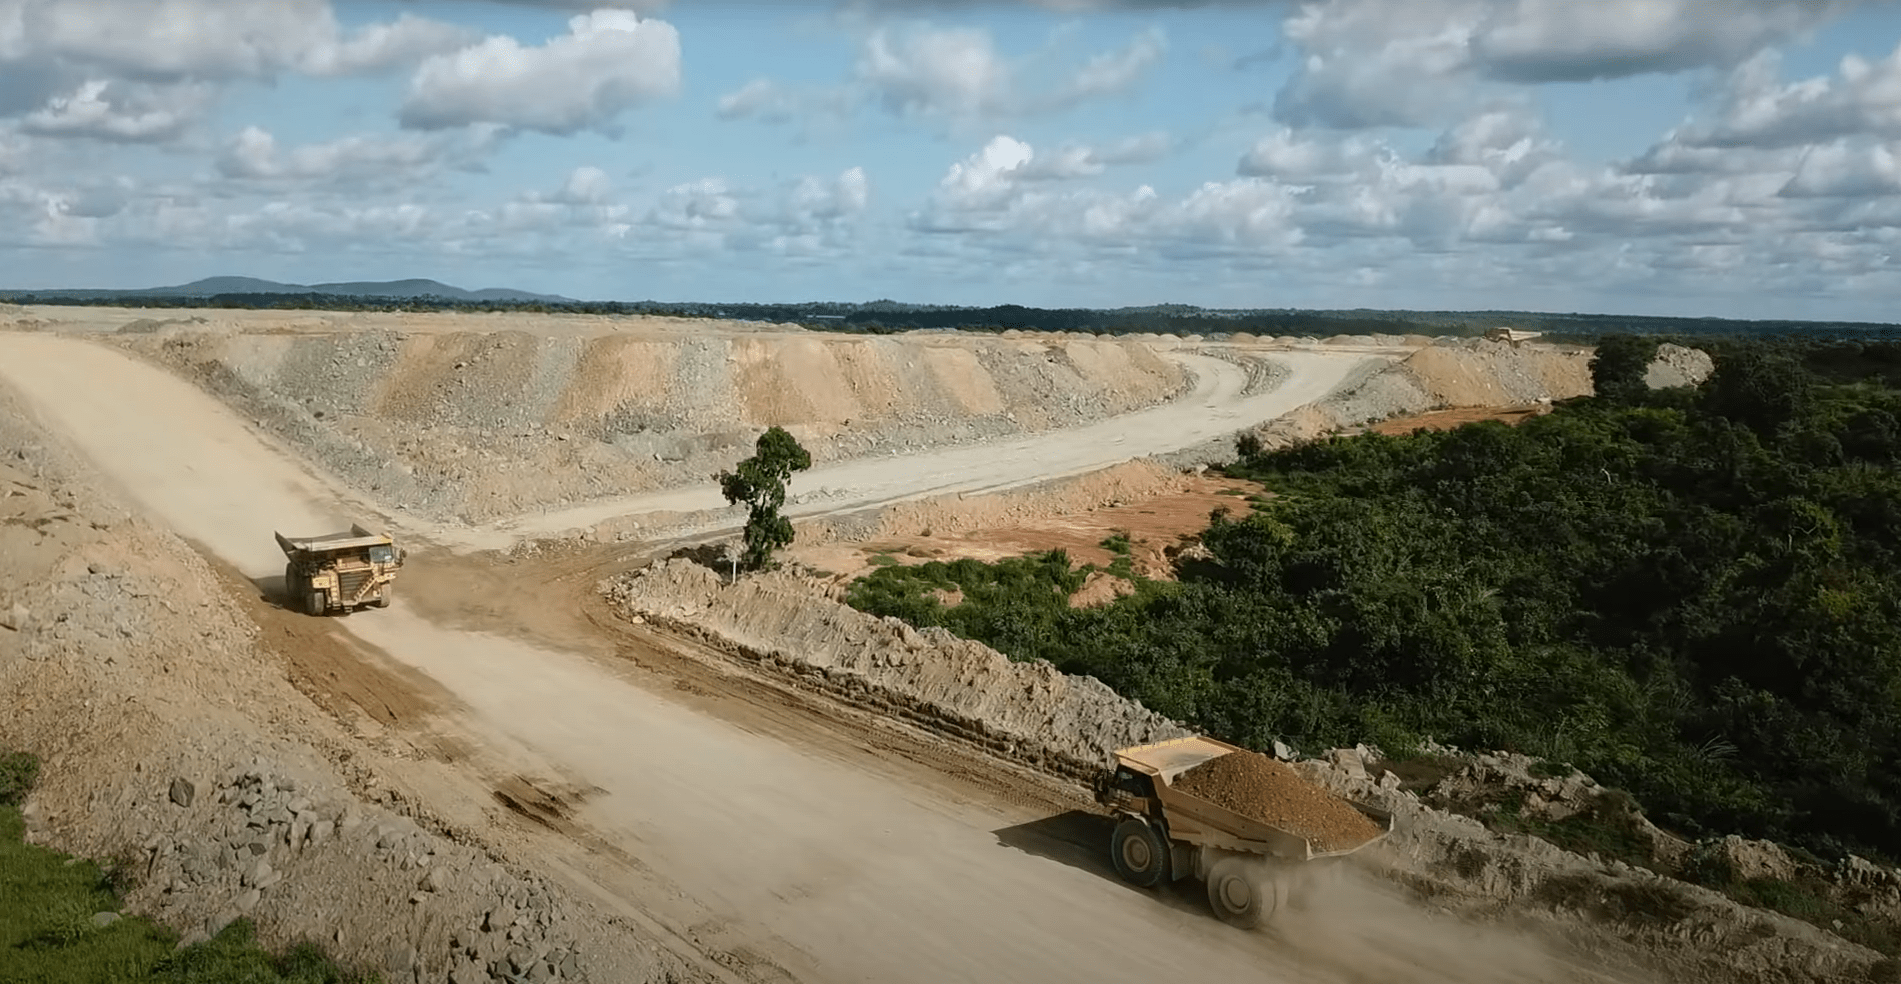
Endeavour Mining released its Q4 and FY2021 results last month, reporting quarterly production of ~398,000 ounces of gold (GLD), just shy of its record production reported in Q4. This helped push Endeavour’s annual production to ~1.52 million ounces of gold, easily beating the company’s guidance mid-point of ~1.43 million ounces. Notably, while production came in above estimates, the company-controlled costs well, especially in what’s been a challenging environment for many producers due to inflationary pressures. Let’s take a closer look below:
Endeavour Mining – Quarterly Gold Production (Company Filings, Author’s Chart)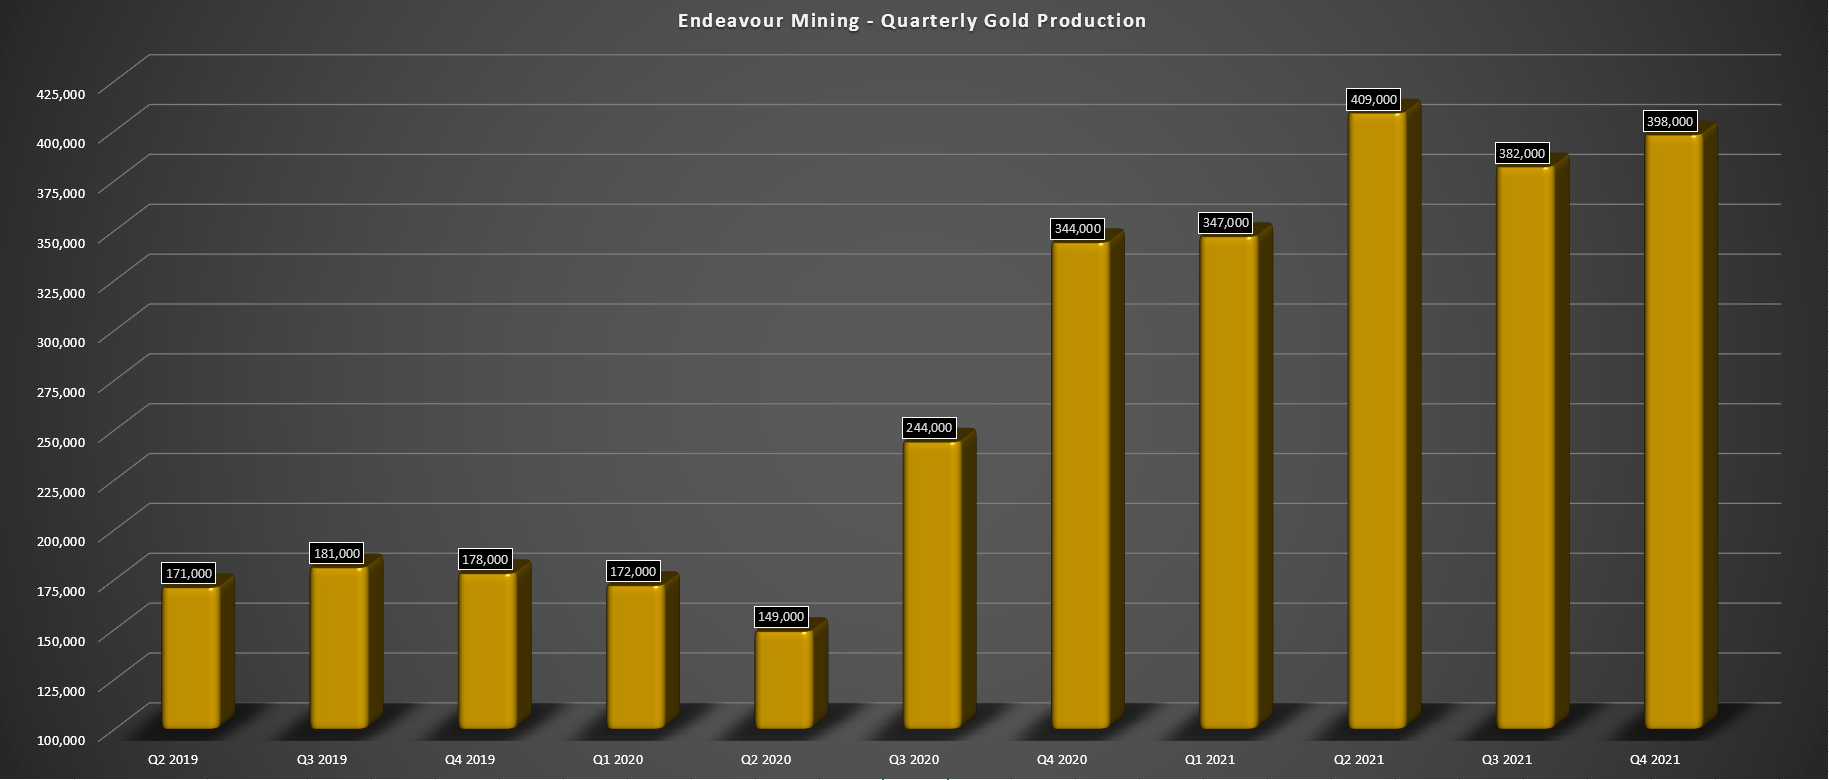
Endeavour Mining – Annual Gold Production (Company Filings, Author’s Chart)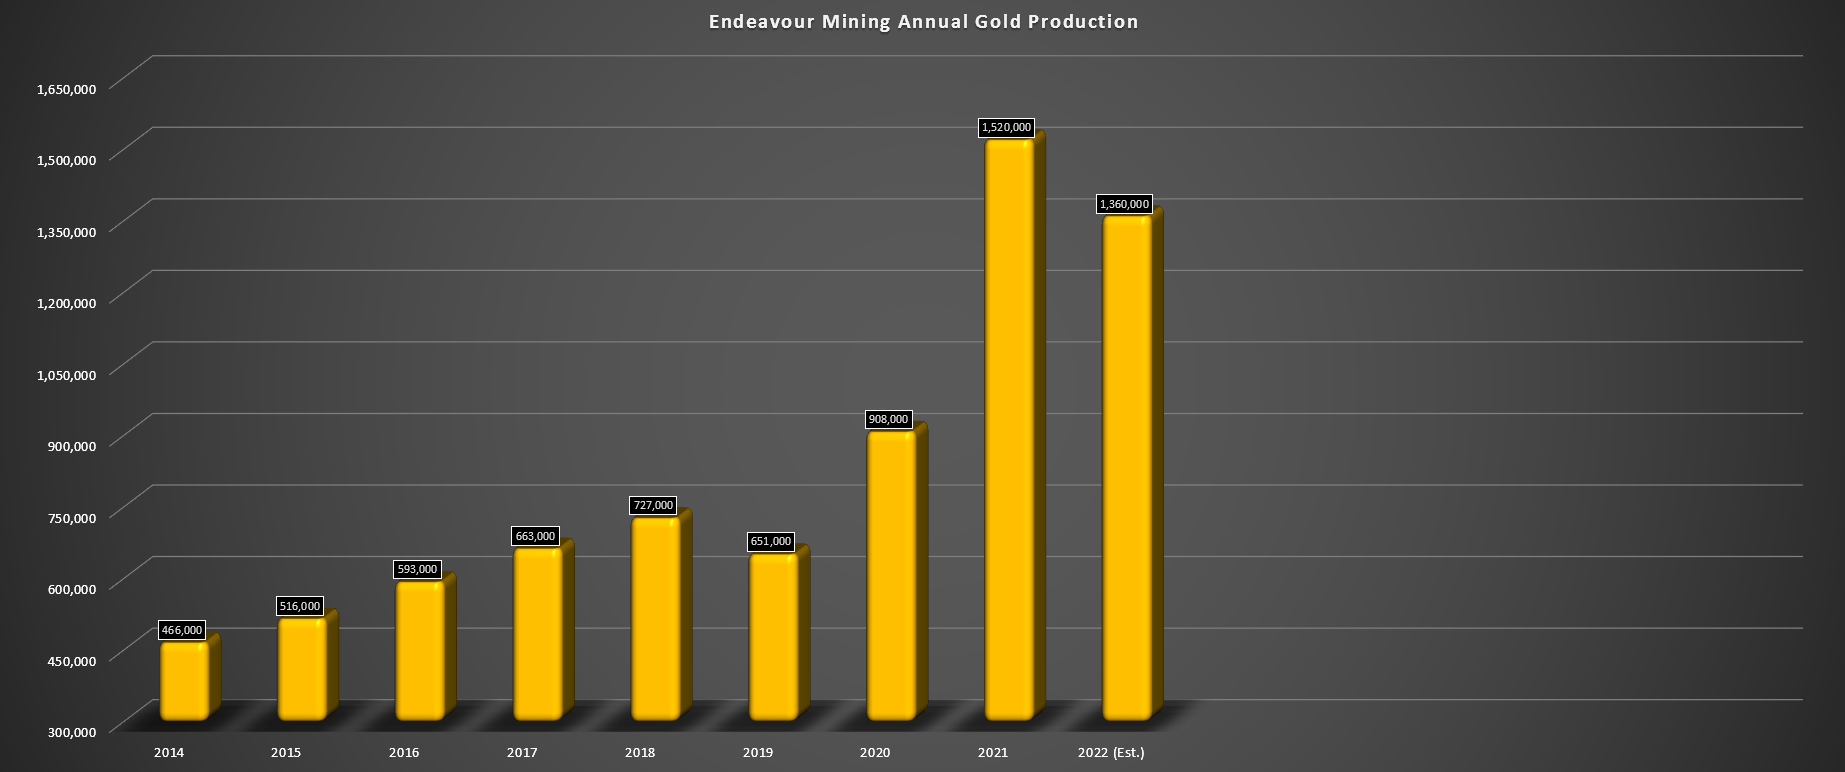
As shown in the charts above, Endeavour enjoyed significant production growth on a year-over-year basis in its most recent quarter, reporting ~16% growth in production. On a full-year basis, annual production soared to ~1.52 million ounces of gold (continuing operations), representing a more than 50% increase year-over-year. As noted earlier, this increase in production was helped by a meaningful contribution from Boungou, a full year of contribution from Mana, and the addition of two new assets: Sabodala-Massawa and Wahgnion. For those unfamiliar, the latter two assets were acquired in the acquisition of low-cost African producer Teranga Gold (OTCQX:TGCDF).
Endeavour Mining – Quarterly Production by Mine (Company Filings, Author’s Chart)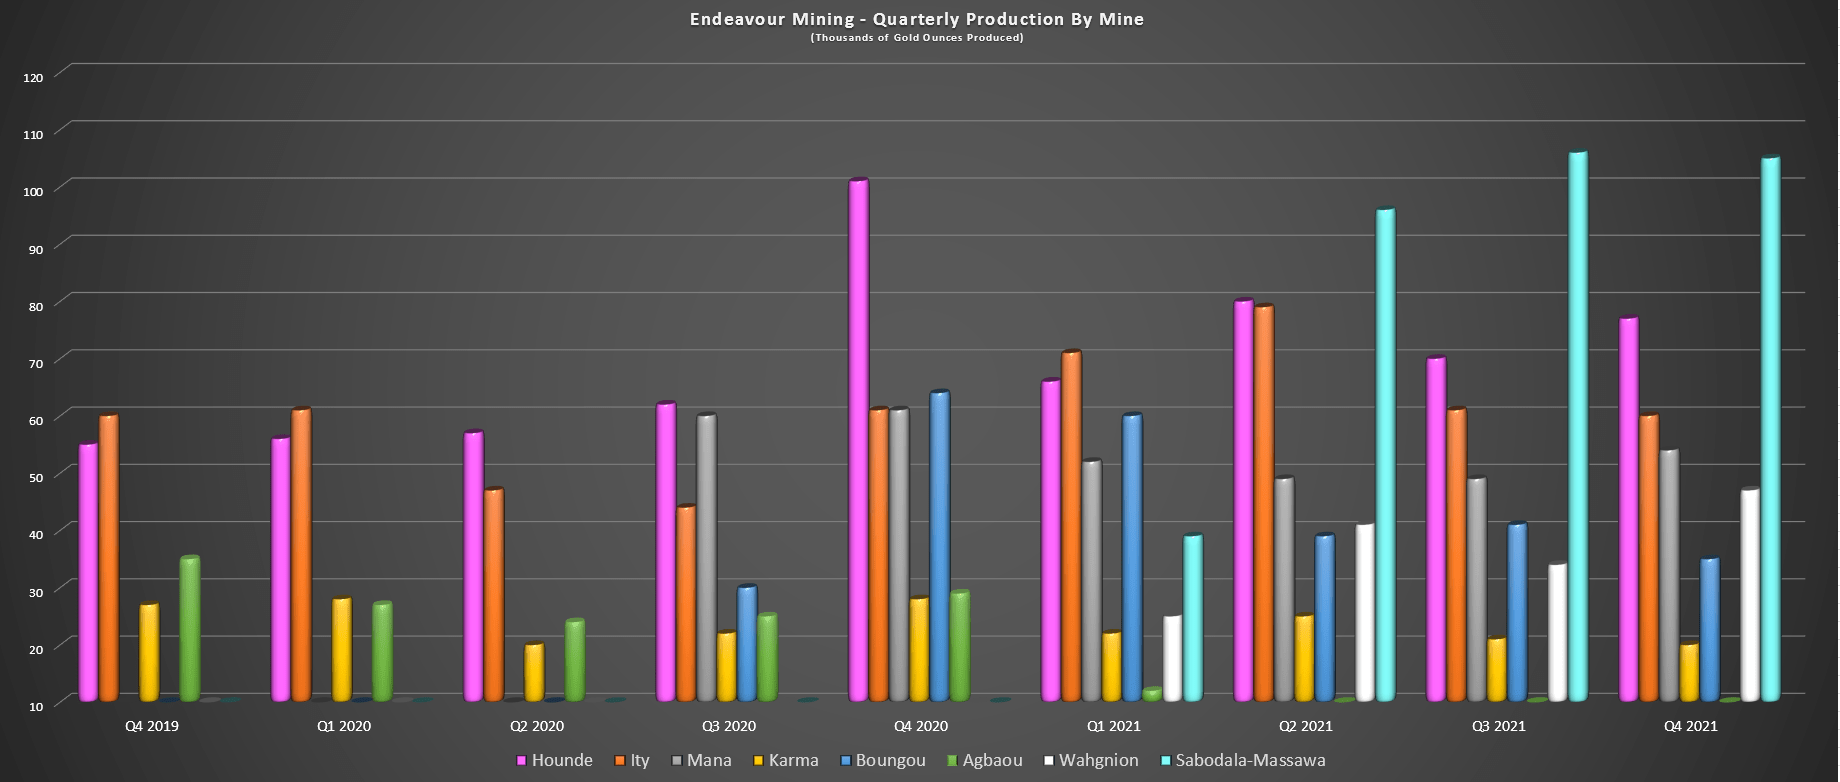
If we look at the above chart below which shows quarterly production by mine, we can see that the two main contributors in Q4 to the increased production on a sequential basis were Hounde (~77,000 ounces), and Sabodala-Massawa (~105,000 ounces). Meanwhile, Wahgnion also had its best quarter yet under Endeavour’s ownership, producing ~47,000 ounces of gold. The only real negative in the quarter was Boungou, which saw a sharp decline in gold production to just ~35,000 ounces (Q4 2020: ~64,000 ounces).
The significant decline in gold production at Boungou was related to lower grades milled, slightly offset by higher throughput (~352,000 tons processed). During Q4, feed grade came in at 3.36 grams per ton gold vs. 6.92 grams per ton gold in Q4 2020. This was related to sourcing ore from the West Pit vs. higher-grade ore that had been stockpiled, so the decline in grades and increase in costs isn’t surprising. However, full-year production also came in below estimates at ~174,000 ounces, below the ~190,000-ounce guidance range.
Boungou Plant (Company Website)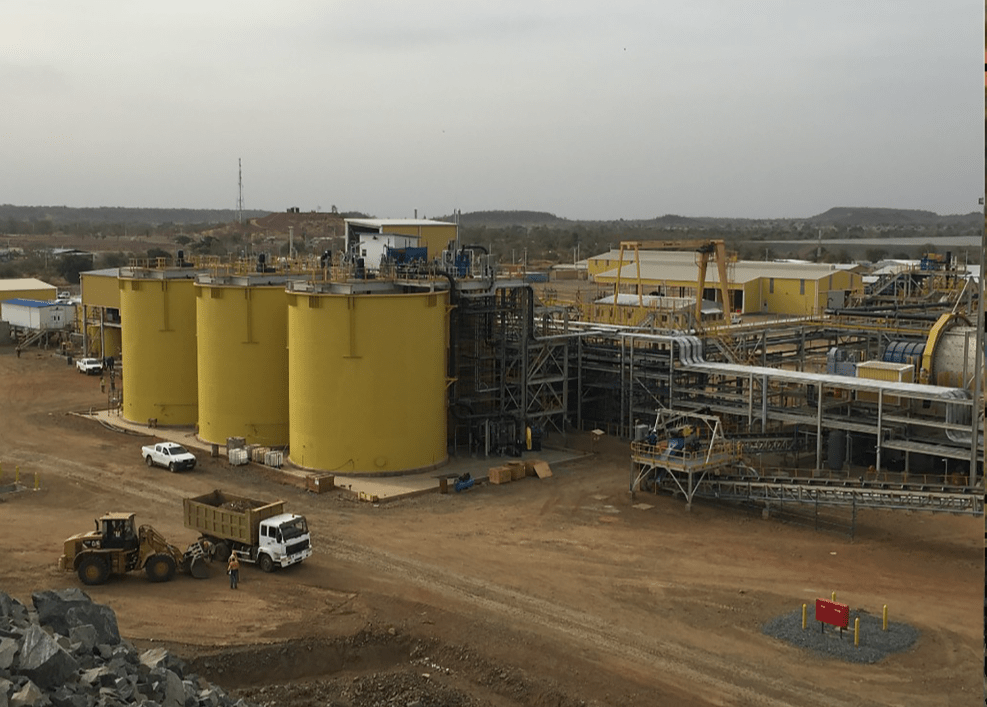
From a cost standpoint, costs came in well above the guidance mid-point of $715/oz., ending the year at $801/oz. The company noted that this was related to higher security costs and higher fuel prices. Unfortunately, the 2022 outlook isn’t any better, with production expected to come in at ~135,000 ounces at $950/oz., assuming the asset meets its guidance mid-point. The culprit for the lower production at higher costs is due to lower grades in line with the mine plan, and waste stripping.
Unfortunately, the other negative was a large write-down of ~$246 million, of which ~$32 million was related to the goodwill recognized on acquisition. Endeavour noted that the impairment was due to a revised life of mine plan which incorporates higher operating costs, lower than expected production and grades, and a decrease in the estimated resource to reserve conversion and exploration potential. This is partially related to security issues and the current security environment, and reduced exploration activities due to security constraints. While disappointing, it’s probably better to be conservative at this asset, following the tragic incident in 2019.
Sabodala-Massawa Operation (Company Presentation)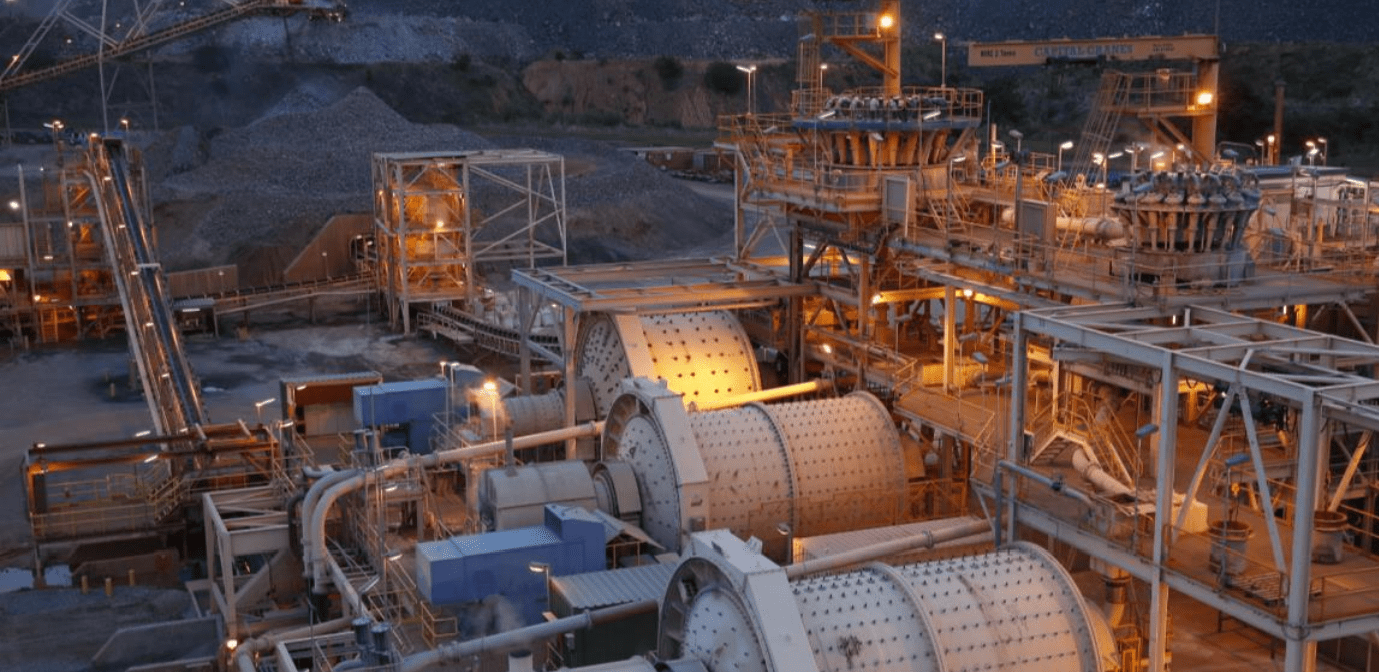
Moving over to Sabodala-Massawa, the asset had an incredible quarter and strong finish to the year, reporting Q4 production of ~105,000 ounces, and annual production of ~365,300 ounces. It’s worth noting that this only reflected production from February 10th to year-end (timing of deal closing). The robust performance was driven by high grades from the Sofia Main and Sofia North pits, contributing to an average feed grade of 3.19 grams per ton of gold in FY2021.
Sabodala-Massawa – Production & Costs (Company Filings, Author’s Chart)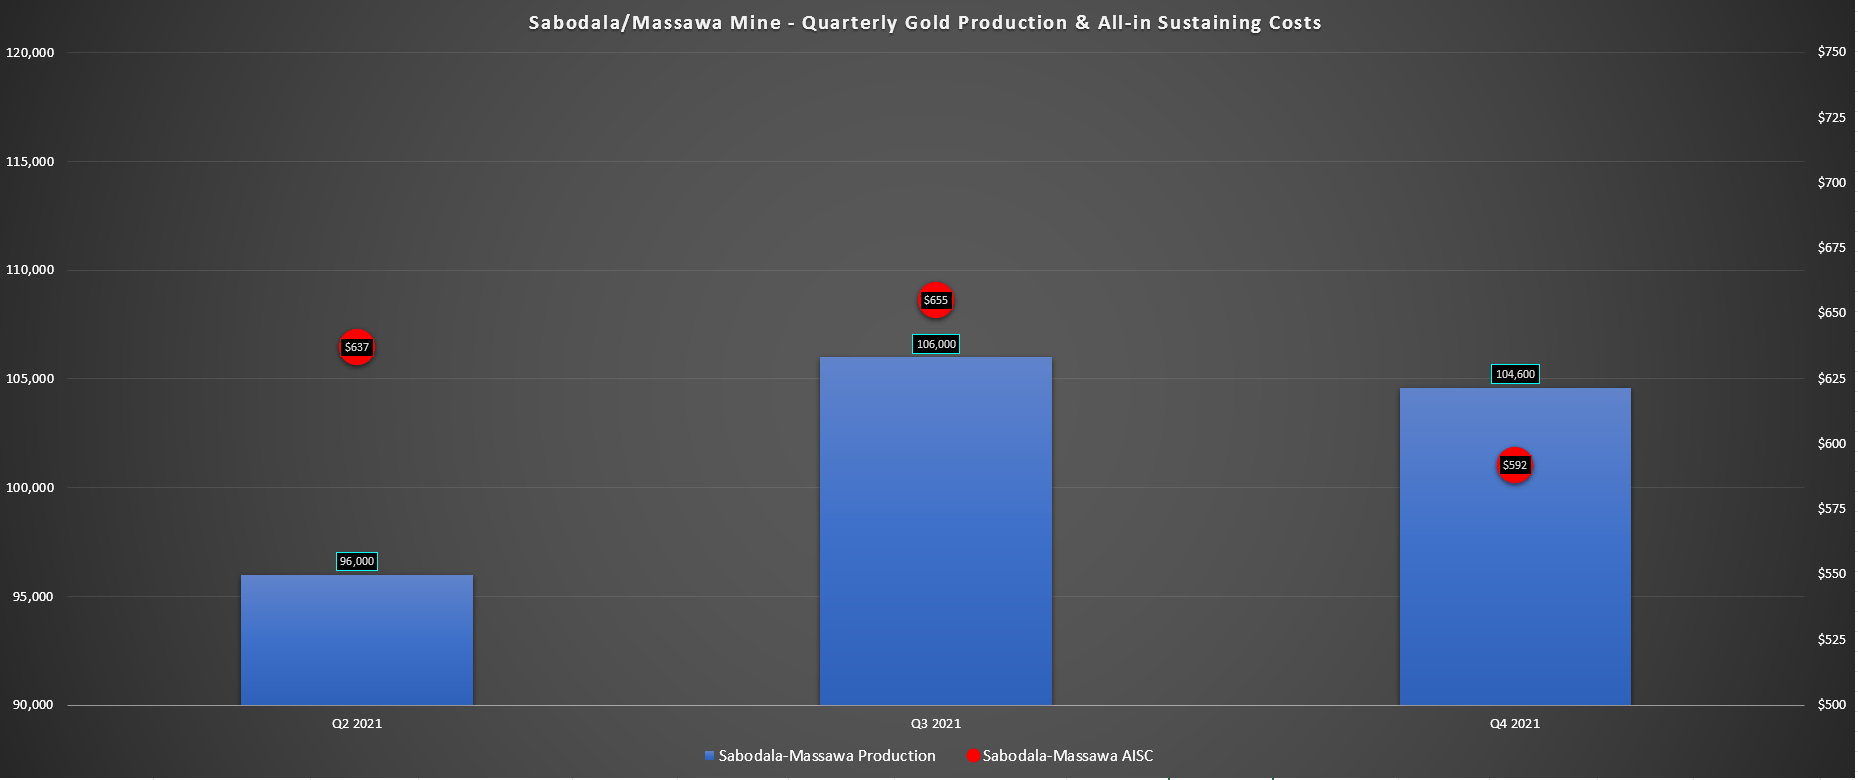
While the production figures were impressive and easily beat the top end of FY2021 guidance (330,000 ounces), it was the margins that stood out the most. During Q4, Sabodala-Massawa processed ~1.08 million tons at an average grade of 3.41 grams per ton gold and reported all-in sustaining costs [AISC] of $592/oz. These costs are more than 45% below the estimated FY2022 industry average (~$1,150/oz.), and FY2021 costs came in at an impressive $645/oz. So, this asset certainly helped to keep Endeavour’s costs well below the industry average.
The great news about Sabodala-Massawa is that investors have visibility into well over a decade of production, with a life mine extending out to 2034 with average production of more than 300,000 ounces per annum (13 years). Over the next five years, production is expected to come in at ~373,000 ounces per annum at industry-leading costs of $745/oz. This makes Sabodala-Massawa one of the most impressive assets in Africa, and the boost to NPV (5%) from the Phase 2 Study (BIOX Plant) mostly offsets the recent write-down at Boungou. Let’s take a look at Endeavour’s financial results below:
Financial Results
Moving over to Endeavour’s financials, we can see that the company had a solid Q4, reporting revenue of $697.2 million, up more than 26% year-over-year. This was driven by increased gold sales due to the addition of Sabodala-Massawa and Wahgnion and was despite a headwind related to a lower average realized gold price. During Q4, Endeavour’s average realized gold price came in at $1,787/oz., a $54/oz. headwind vs. the much higher price enjoyed in Q4 2020.
Endeavour – Quarterly Revenue (Company Filings, Author’s Chart)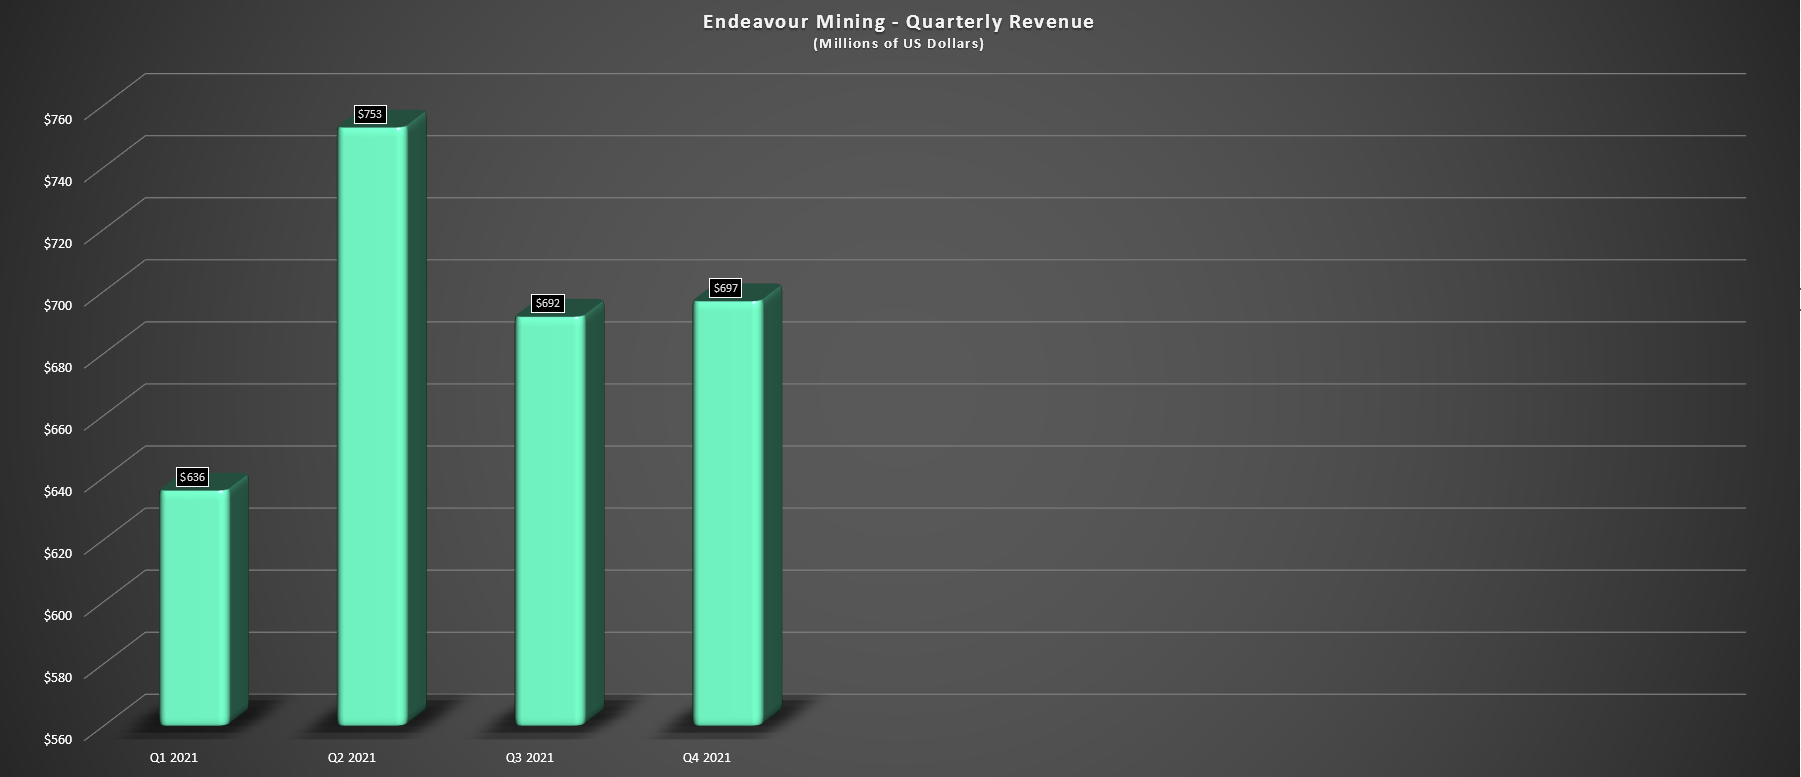
On a full-year basis, revenue soared to ~$2.77 billion, up 95% year-over-year helped by the inclusion of Teranga’s assets into the portfolio. This increase in revenue led to a significant increase in operating cash flow, which ended the year at ~$1.17 billion. Given the increased free cash flow generation, Endeavour finished the year with ~$900 million in cash, and a net cash position, a massive improvement from where the company stood just over two years ago (~$600 million in net debt) after completing the construction of its new Ity CIL Project.
Endeavour – Quarterly AISC Margins (Company Filings, Author’s Chart)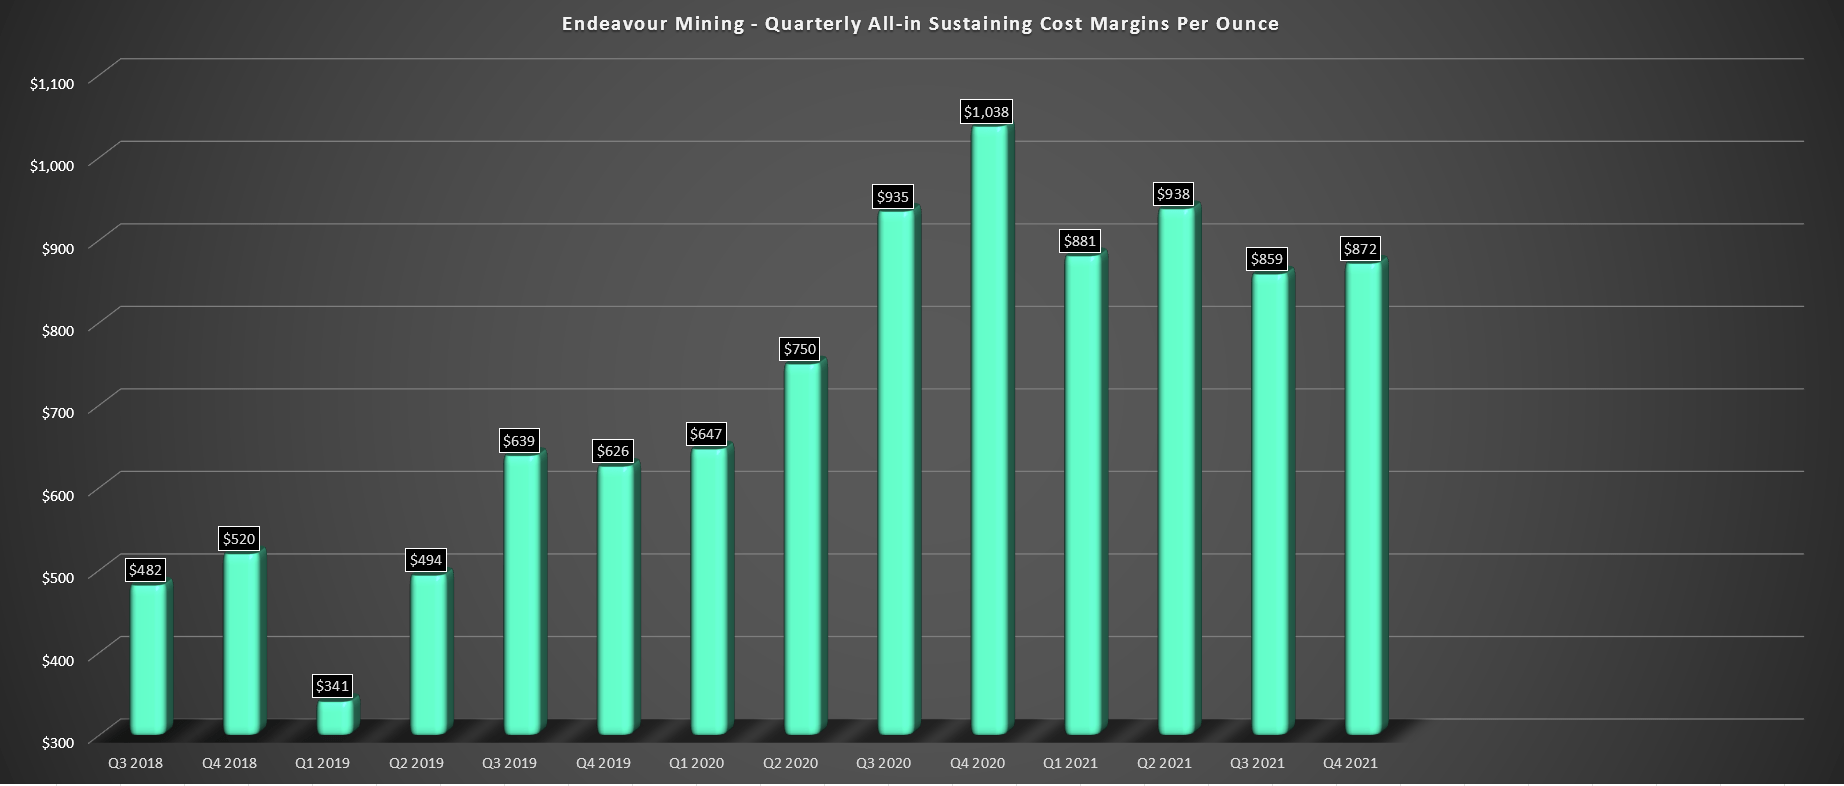
Looking at Endeavour’s margins, we can see that they have declined sharply from Q4 2020 levels ($872/oz. vs. $1,038/oz.), though this was partially due to the headwind from the higher gold price in the period. However, on a full-year basis, AISC margins held up very well, coming in at $890/oz. vs. $908/oz. in FY2020. This was despite a ~90% growth rate in the period. The significant growth while maintaining robust margins is a key differentiator for Endeavour vs. most of its peers, given that much of the growth in this sector comes at the cost of margins, and is often growth simply for the sake of growth.
Endeavour Mining – Annual Production & 2022 Estimates (Company Filings, Author’s Chart & Estimates)
Finally, if we look at Endeavour’s FY2022 guidance, some investors might be disappointed in the outlook, but I don’t see any reason to get hung up on the decline in production. The reason is that much of this decline in production is related to the sale of the company’s non-core Karma Mine which contributed ~88,000 ounces of gold last year. If we adjust Karma and assume that production comes in just above the guidance mid-point (~1.36 million ounces), production is only expected to be down slightly on a year-over-year basis.
Besides, while production is important, costs are even more important, and in this department, Endeavour is expected to see very similar costs on a year-over-year basis. This is based on the company’s guidance mid-point of $905/oz. which places Endeavour’s projected AISC approximately $250/oz. below the FY2022 industry average. It also suggests only a ~2% increase in costs year-over-year which is well below the “5% plus cost inflation” that we’re hearing from many companies sector-wide in recent conference calls and guidance. So, based on recent gold price strength and even after factoring in hedges, Endeavour is set up to report 50% plus AISC margins this year.
Valuation
Based on ~250 million shares and a share price of US$25.00, Endeavour trades at a market cap of ~$6.25 billion. This is a very reasonable valuation for a ~1.40 million-ounce producer with a pathway to a ~1.85 million-ounce per annum production profile with Kalana and Fetekro, which are both quite advanced assets. Notably, the company gets minimal value for earlier stage assets (Nabanga, Bantou) and several other greenfields opportunities and Afema, which could also contribute to production growth post-2030. Despite this, Endeavour trades at a single-digit PE ratio, and below 1.0x P/NAV, well below that of its peers.
Endeavour Mining – AISC vs. Peers (Company Filings, Author’s Chart) Endeavour Mining AISC vs. Peer Group (Company Filings, Author’s Chart)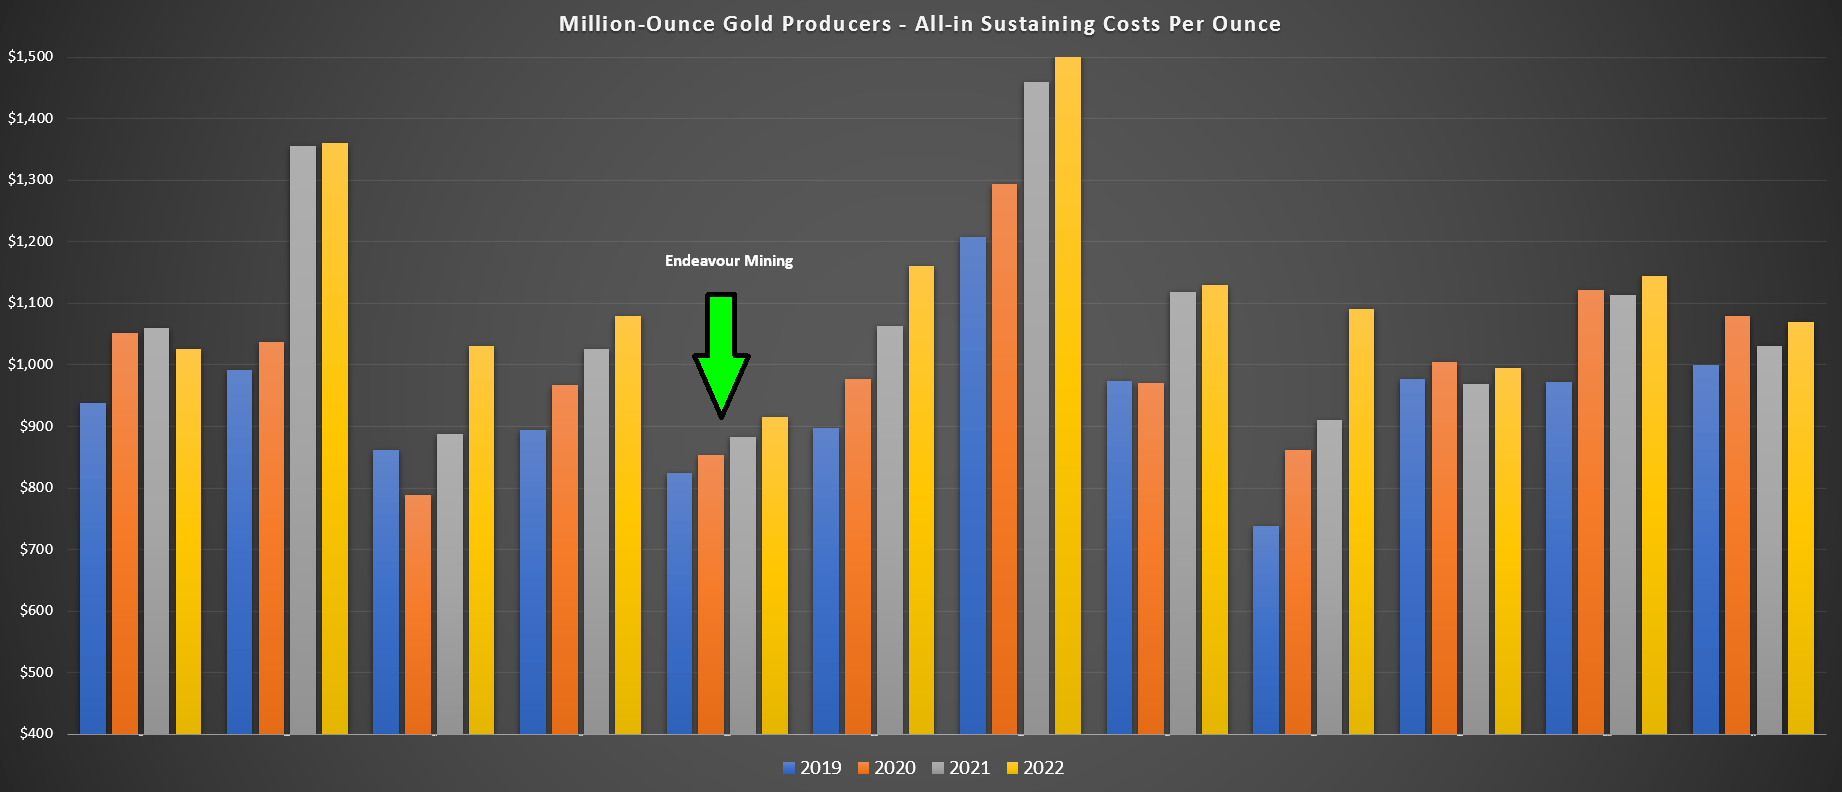
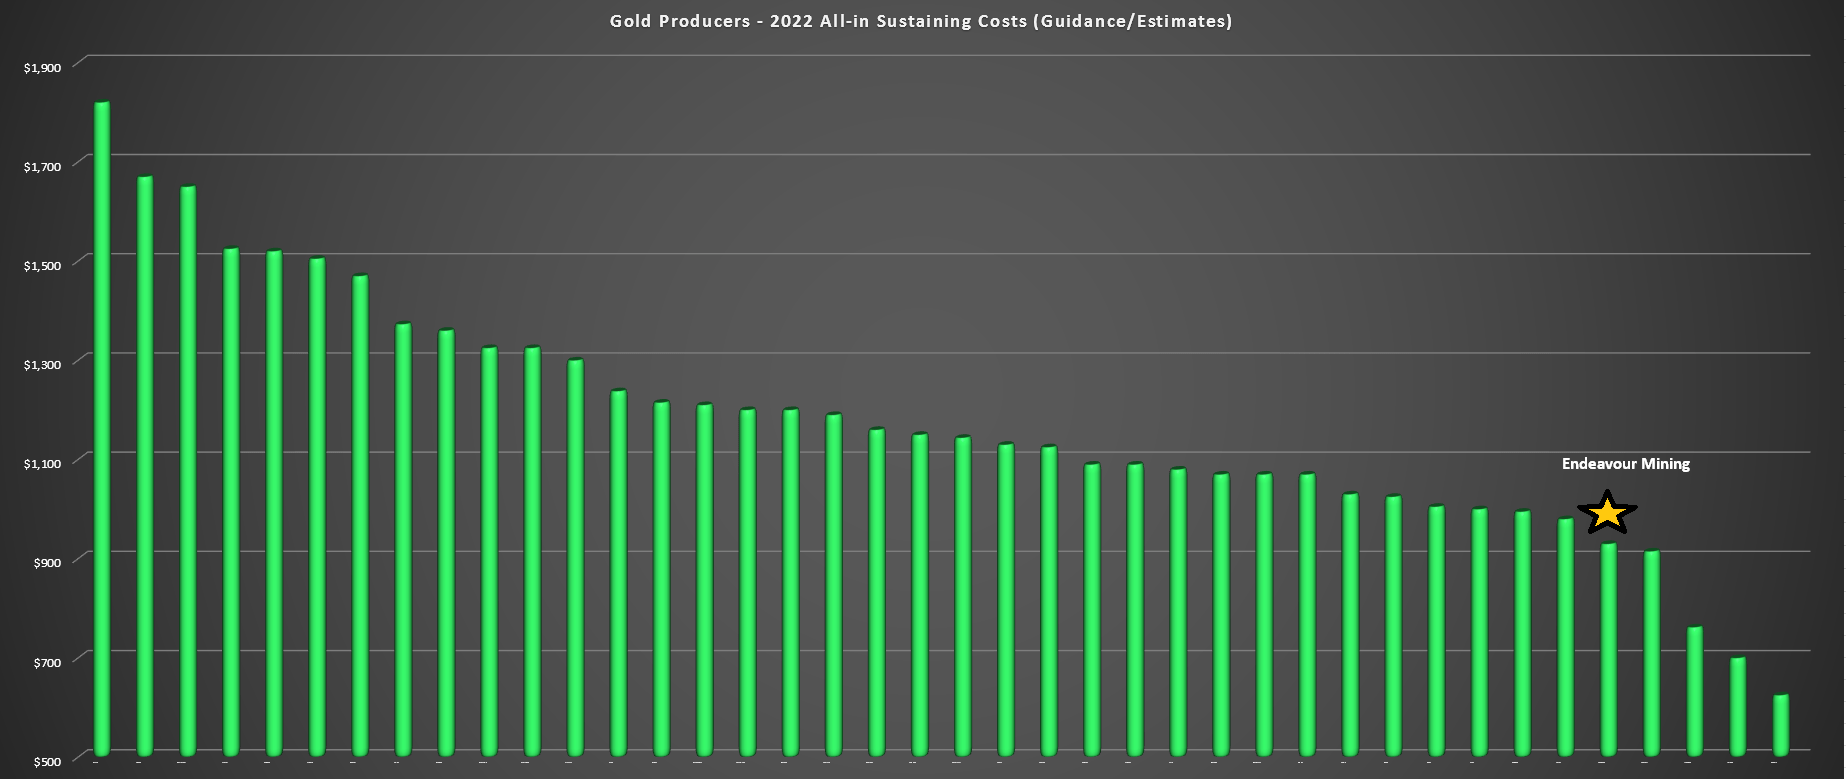
Endeavour’s other key distinction, which should not be understated, is its industry-leading margin profile, with the company boasting some of the best margins sector-wide. This is highlighted by the two charts above, which show that Endeavour has some of the lowest costs both among its peer group (million-ounce producers) and sector-wide, making it a great buy-the-dip candidate given that it’s still managing to report 50% plus AISC margins at current gold prices even with the cost creep we’ve seen over the past year due to inflationary pressures.
Ity Operations (Company Presentation)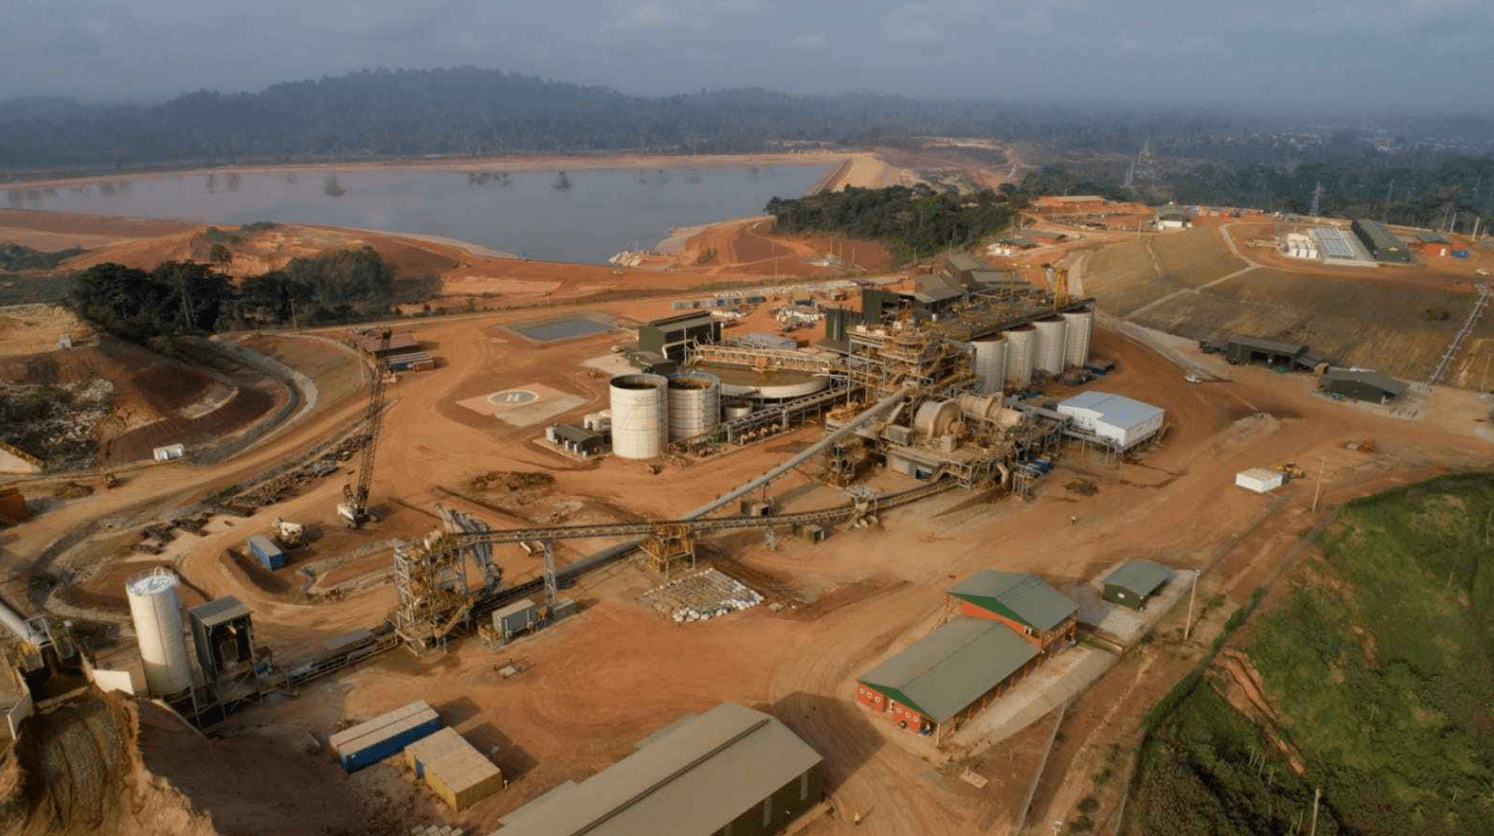
Endeavour Mining had another solid year in FY2021, and while production will slip on a year-over-year basis, this is mostly related to divestments and has little to do with the quality of its portfolio. In fact, as the cost progression chart above shows, Endeavour has grown at a torrid pace without sacrificing its margins, seeing only a slight increase in costs since FY2019 despite more than doubling its production profile.
This model of growth that’s not just for the sake of growth, its track record of continuously under-promising and over-delivering, and its generous capital return program make Endeavour a top-10 producer sector-wide. So, for investors looking for a high-margin producer with moderate growth in the million-ounce producer space that are comfy with Tier-3 jurisdictions, I see Endeavour as a name worth keeping a close eye on. For now, I remain Neutral, given the sharp rally in the stock since March. However, I would view sharp pullbacks as buying opportunities.
Be the first to comment