

USD/ZAR ANALYSIS
- Short-term technical pattern unfolding
- Rand remains heavily influenced by U.S. Dollar and global sentiment
RAND FUNDAMENTAL BACKDROP
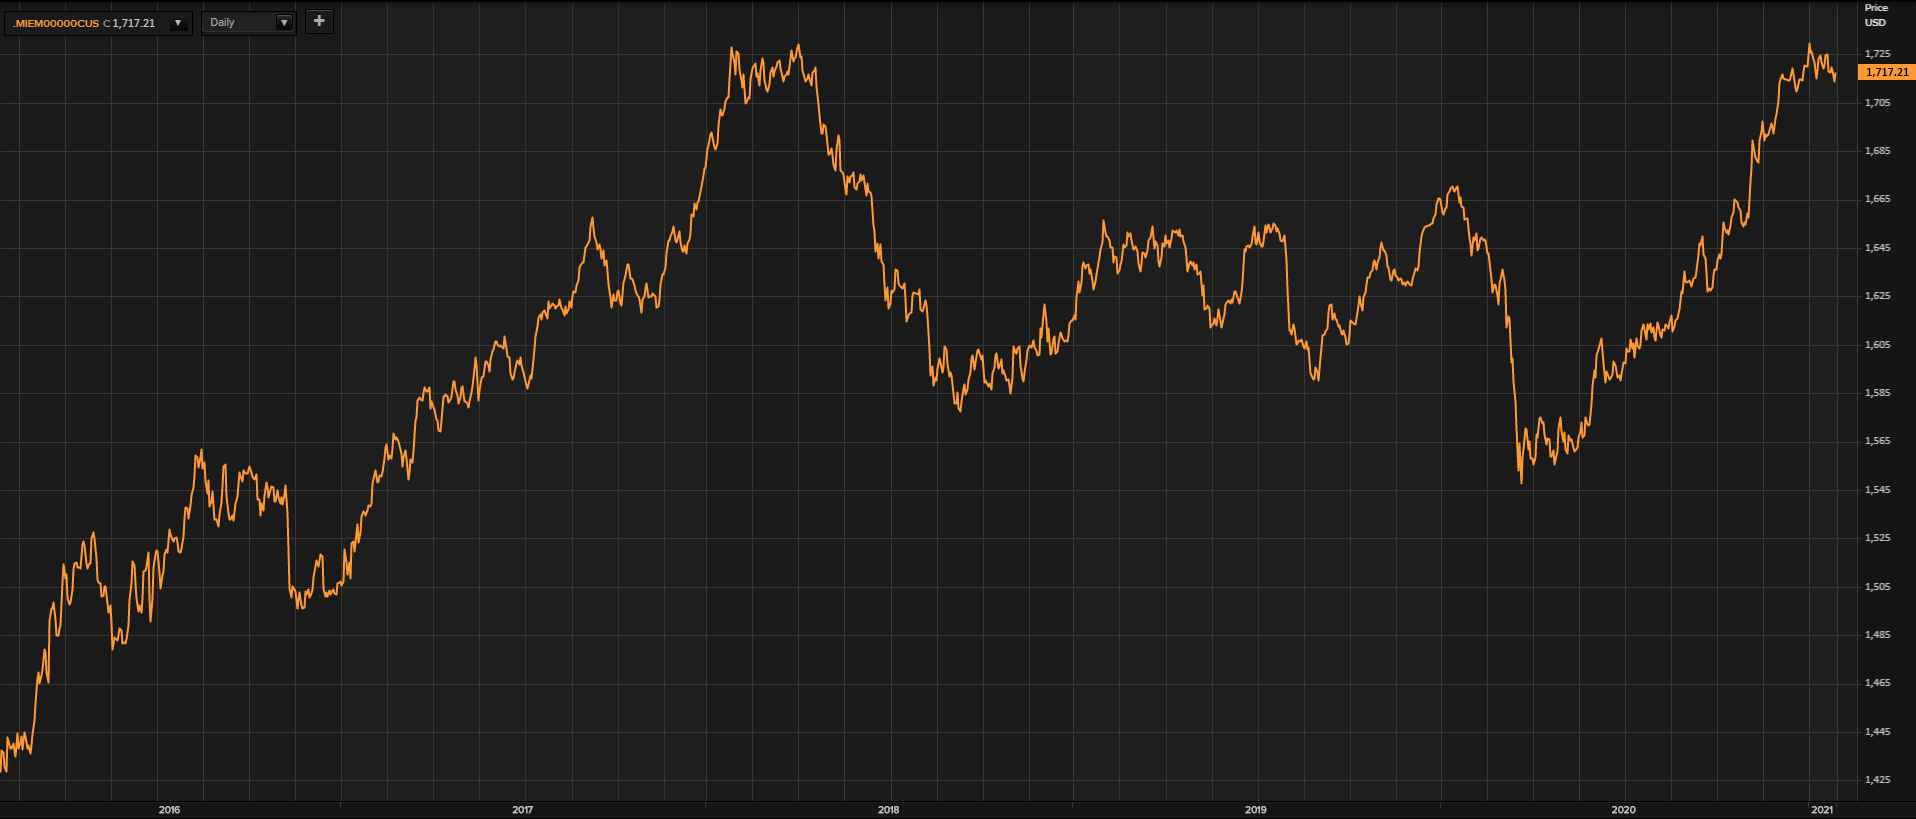
The Rand continues to dance to the global tune as ‘risk off’ and ‘risk on’ reactions vary on a regular basis. This has been the tale of most Emerging Market (EM) currencies throughout 2020 and now 2021. The greenback has also played an important role in global risk sentiment being the worlds reserve currency. The MSCI Emerging Market Index below shows EMs gaining favor in since the end of March 2020 coinciding with persistent Dollar weakness. The MSCI Emerging Market Currency Index in USD measures the total return of 25 emerging market currencies relative to the U.S. Dollar where the weight of each currency is equal to its country weight in the MSCI Emerging Markets Index
The index reached multi-year highs in early January 2021 which is expected to continue if the global economic recovery and U.S. stimulus unfolds as anticipated. It will be interesting to monitor whether this long standing index resistance zone can reach all-time highs in 2021.
MSCI Emerging Market Currency Index:
Chart prepared by Warren Venketas, Refinitiv
The ZAR is one of the top performing EMs against the Dollar and with thoughtful government policies in 2021, the Rand could climb further up the ladder as the leading EM currency as investors continue to seek alpha in the form of high yielding and beta markets such as South Africa. As it stands, the Rand is down 2.71% against the Dollar YTD.
TECHNICAL ANALYSIS
Starts in:
Live now:
Feb 02
( 13:02 GMT )

Keep up to date with price action setups!
Trading Price Action
USD/ZAR DAILY CHART
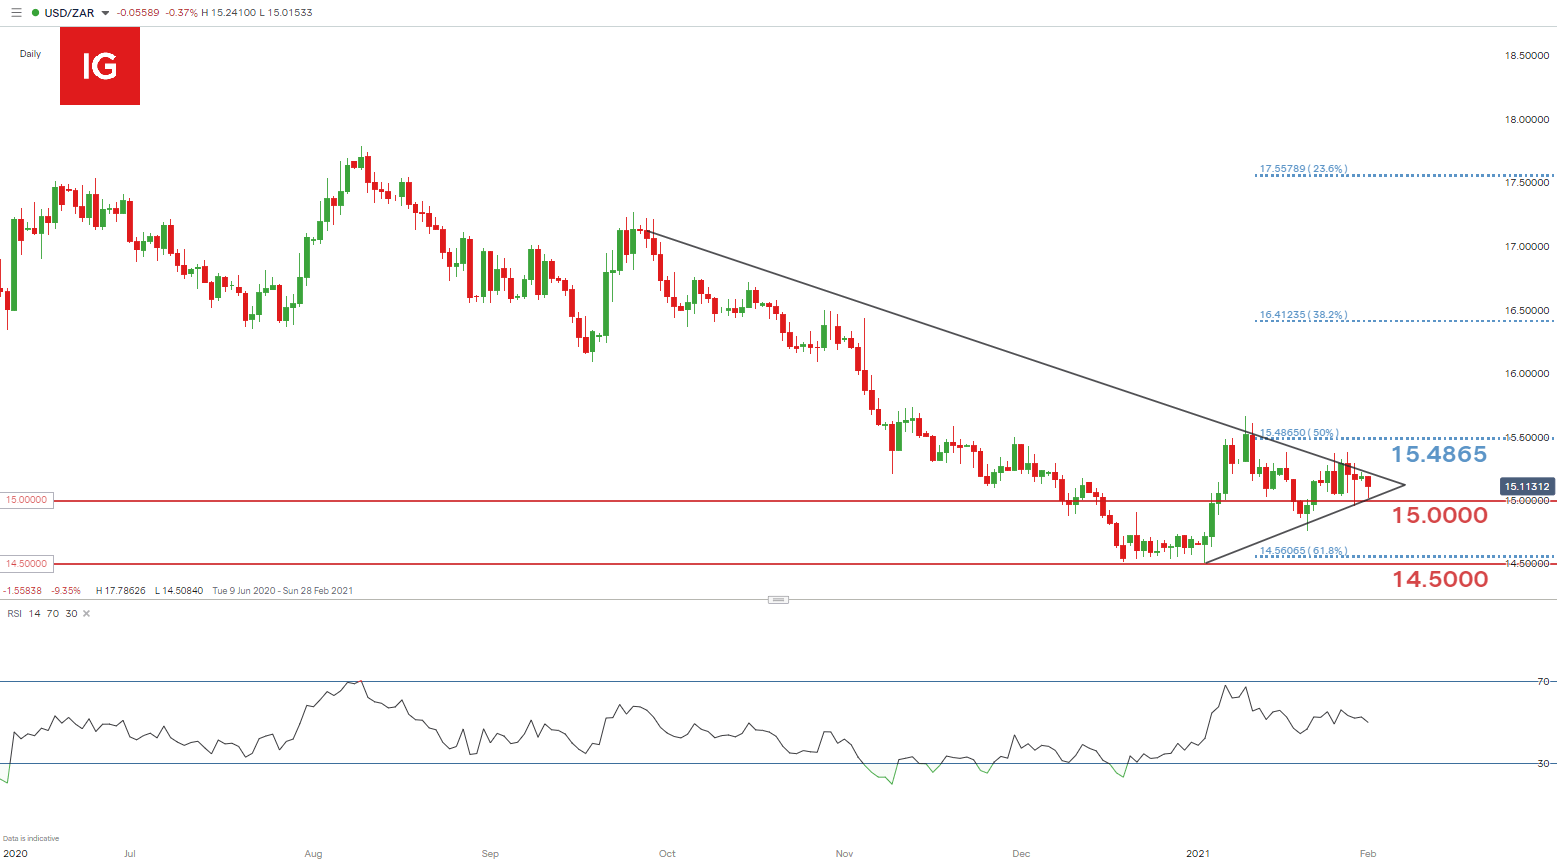
Chart prepared by Warren Venketas, IG
The Rand opened forcefully on Monday as it trades up 0.62% against the Dollar (at the time of writing) despite the cautious approach by investors following the recent equity market mania and uncertainty around the U.S. stimulus package.
Topside trendline resistance holds firm as bulls fervently tested the zone last week. Three daily candles now form a support trendline which has allowed for the formation of a near term symmetrical triangle pattern. Generally, a symmetrical triangle pattern is followed by a break in the direction of the preceding trend which in this case points to further downside.
Further downside will bring the 15.0000 psychological level into consideration while a break above resistance should see USD/ZAR bulls targeting the 15.4865 Fibonacci level (Fibonacci taken from February 2018 lows – April 2020 highs).
The Relative Strength Index (RSI) is currently hovering around the 50 mark which indicates uncertainty between bulls and bears. Although the RSI suggests neither bullish nor bearish momentum at present (short-term), the longer term downtrend is preferred.
USD/ZAR: KEY TECHNICAL POINTS TO CONSIDER
- 15.00000 support
- 15.4865 resistance
- Symmetrical triangle breakout
U.S. PMI DATA SCHEDULED LATER TODAY
Manufacturing PMI data is listed later today with both readings expected above 50 which suggests an expansion (general rule) in the service economy. While IHS Markit PMI forecasts an increase from previous figures, ISM PMI supposes a contraction. This discrepancy is not unusual however, any significant deviation from expectations should be monitored as this may result in significant price fluctuations.
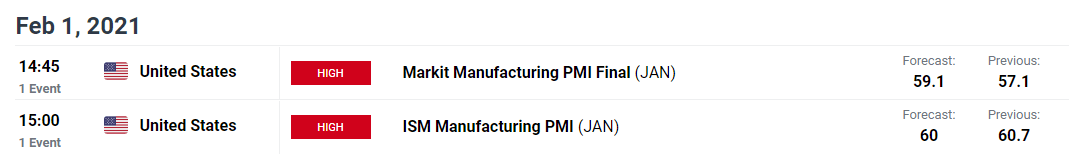
Source: DailyFX economic calendar

Recommended by Warren Venketas
Trading Forex News: The Strategy
— Written by Warren Venketas for DailyFX.com
Contact and follow Warren on Twitter: @WVenketas
Be the first to comment