

Igor Kutyaev/iStock via Getty Images
By Jill Mislinski
This morning, we got the latest Empire State Manufacturing Survey. The diffusion index for General Business Conditions at -9.1 was a decrease of 7.6 from the previous month’s -1.5. The Investing.com forecast was for a reading of -4.0.
The Empire State Manufacturing Index rates the relative level of general business conditions in New York state. A level above 0.0 indicates improving conditions, below indicates worsening conditions. The reading is compiled from a survey of about 200 manufacturers in New York state.
Here is the opening paragraph from the report.
Business activity declined modestly in New York State, according to firms responding to the October 2022 Empire State Manufacturing Survey. The headline general business conditions index fell eight points to -9.1. New orders, unfilled orders, and shipments were all little changed from last month. Delivery times held steady, and inventories inched higher. Labor market indicators pointed to a small increase in employment and the average workweek. Input price increases picked up, while the pace of selling price increases held steady. Looking ahead, firms do not expect business conditions to improve over the next six months. [Full report]
Here is a chart of the current conditions and its 3-month moving average, which helps clarify the trend for this extremely volatile indicator:
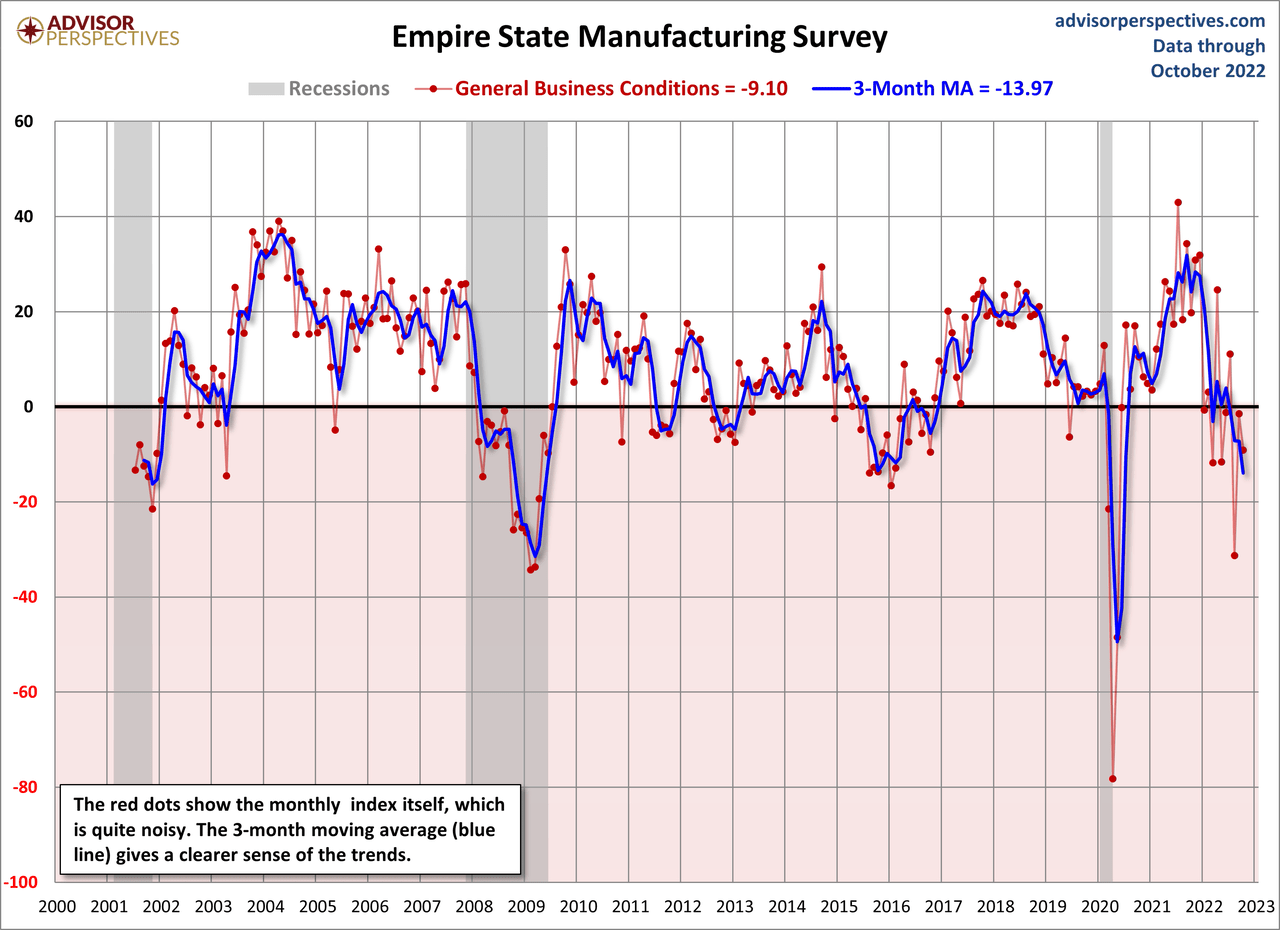
Since this survey only goes back to July of 2001, we only have two complete business cycles with which to evaluate its usefulness as an indicator for the broader economy. Following the Great Recession, the index has slipped into contraction multiple times, as the general trend slowed. We saw a gradual decline in 2015 that picked up in 2016, with a giant dip in 2020 due to COVID-19.
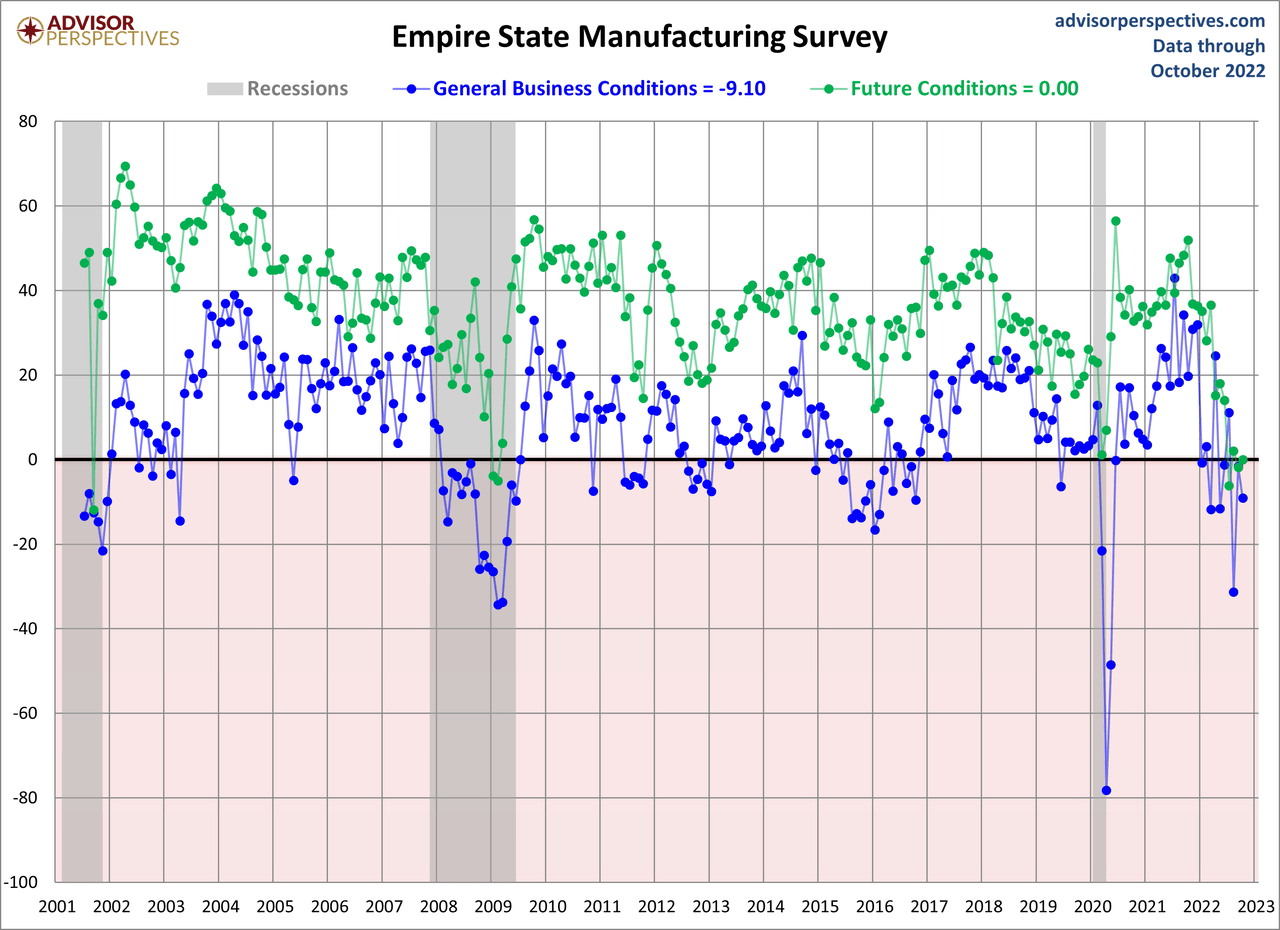
Here is an overlay of the current and future conditions (a six-month outlook).
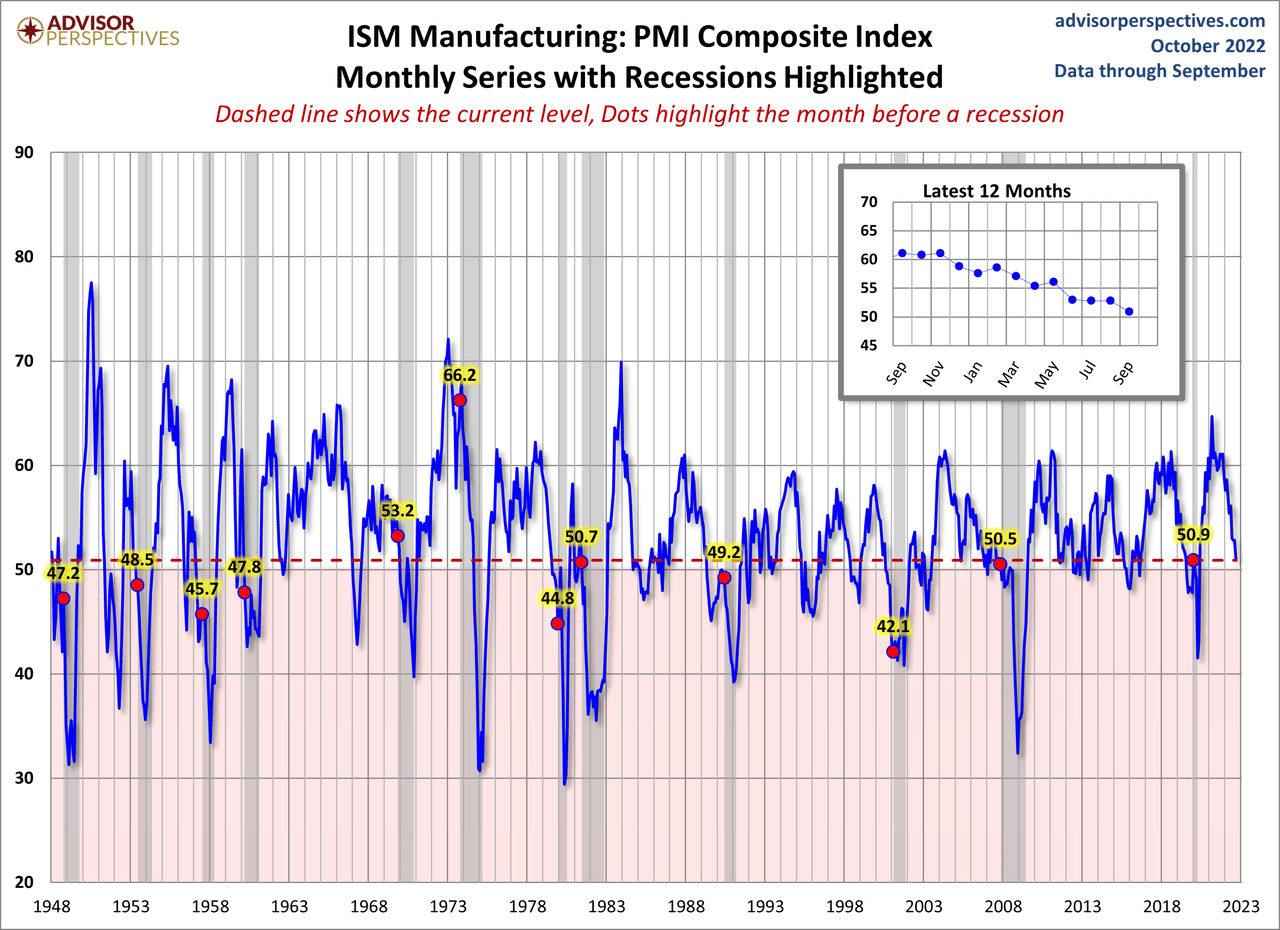
Meanwhile, here’s another look at the latest ISM Manufacturing Business Activity Index.
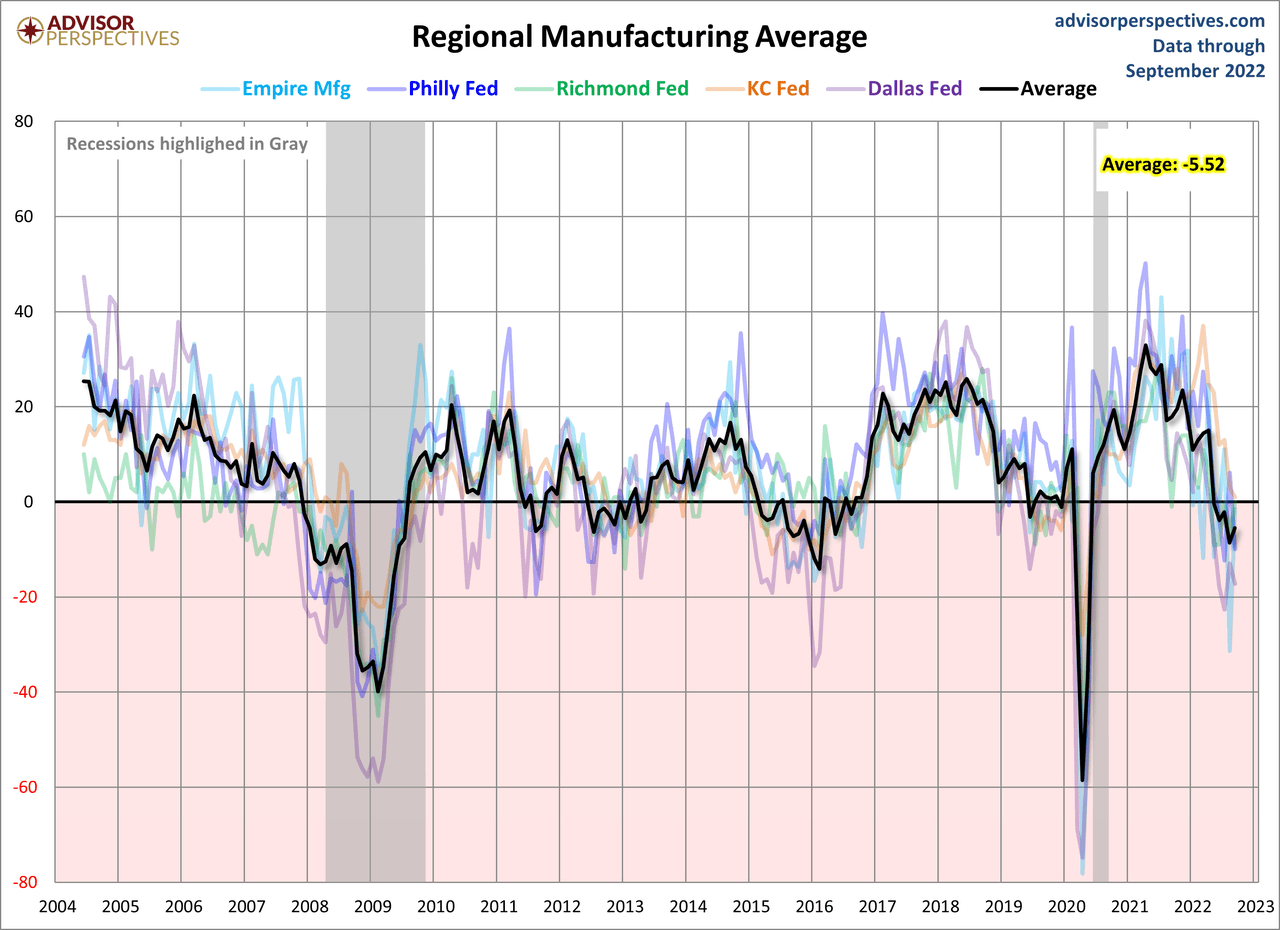
Let’s compare all five Regional Manufacturing indicators. Here is a three-month moving average overlay of each since 2001 (for those with data).
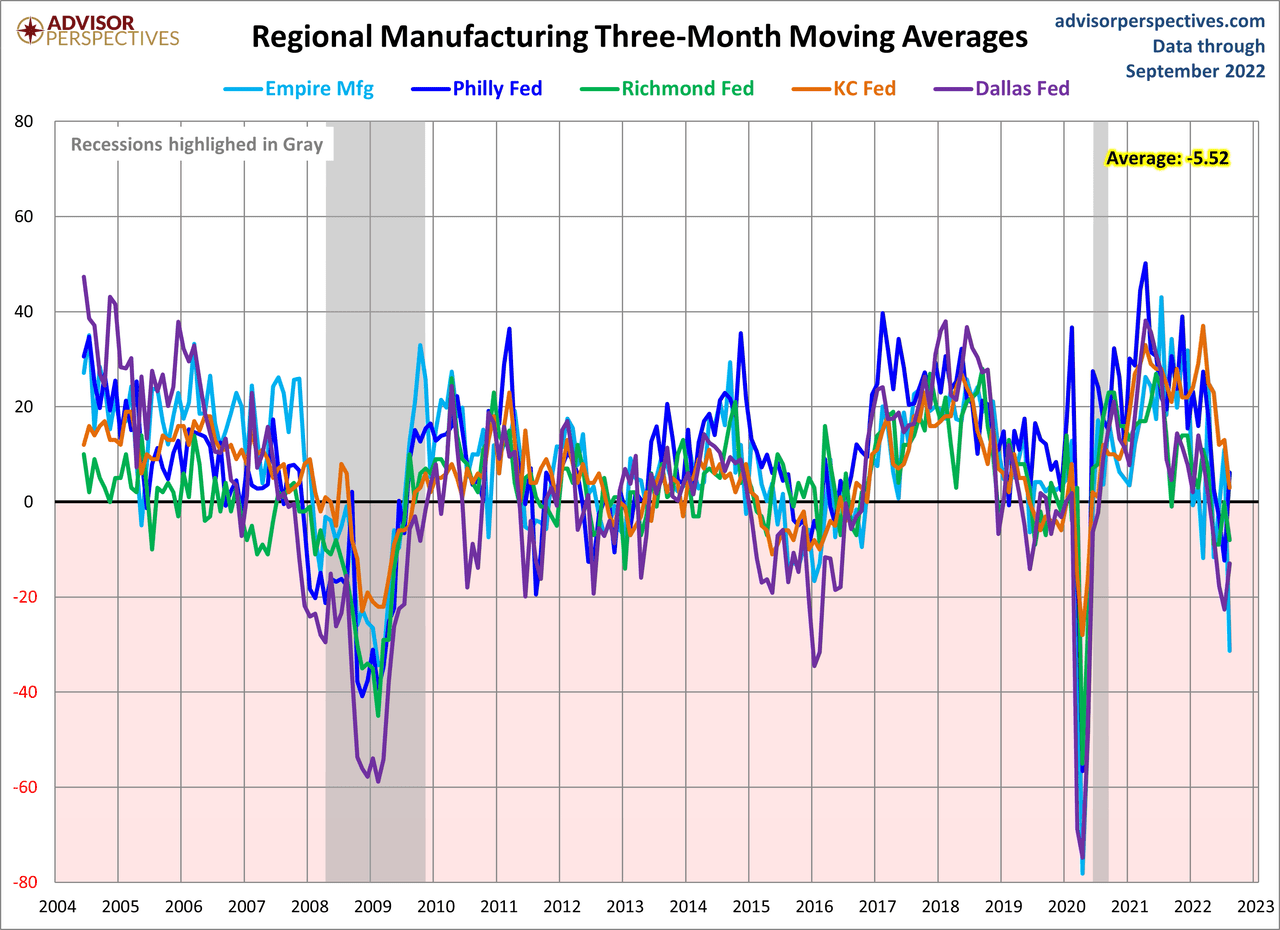
Here is the same chart, including the average of the five. Readers will notice the range in expansion and contraction between all regions.
Editor’s Note: The summary bullets for this article were chosen by Seeking Alpha editors.
Be the first to comment