


Hiroshi Watanabe
This week, we showcase the Kirkpatrick Growth stock screen strategy and give you a list of stocks that currently pass the AAII screen based on the approach. The Kirkpatrick Growth approach is a mechanical process that helps investors avoid their own biases that can ultimately cost them money. Our Kirkpatrick Growth screening model has shown impressive long-term performance, with an average annual gain since 1998 of 14.1%, versus 5.7% for the S&P 500 index in the same period.
Growth Potential With Charles Kirkpatrick
Charles Kirkpatrick’s book, “Beat the Market: Invest by Knowing What Stocks to Buy and What Stocks to Sell” (FT Press, 2008), outlines stock-picking and portfolio management strategies he believes individual investors can follow to outperform the market while reducing the risk of capital losses. After investing for over 45 years, Kirkpatrick came to believe that markets trade on facts, the anticipation of new facts and emotion.
Kirkpatrick was president of Kirkpatrick & Company Inc., which specialized in technical research and published the Kirkpatrick Market Strategist stock advisory newsletter. Kirkpatrick is a former board member of the CMT Association, former editor of the Journal of Technical Analysis and former board member of the Technical Analysis Educational Foundation, responsible for the development of courses in technical analysis at major business schools. He is also the only person to win the annual Charles H. Dow Award twice, for excellence in technical research.
As he puts it, the stock market is “the sum of all information known and anticipated, interpretation of that information, and emotional reactions to that information, right or wrong.”
Philosophy and Style
Kirkpatrick believes a mechanical approach to investing will help investors avoid their own biases that ultimately cost them money. He further believes that it is impossible to predict market movements. Instead, he follows the STRACT (setup, trigger, and action) technique that helps him react to individual stock movements. His growth methodology is based on one “relative” data element—price strength. His analysis led him to the growth investment model. By following his approach, Kirkpatrick feels that individual investors can outperform the market by investing in individual stocks with a minimal time commitment.
Prediction Versus Reaction
Kirkpatrick reiterates his opinion several times in “Beat the Market” that it is not possible to predict markets. Instead, he feels that a more successful alternative to predicting the markets is a strategy of “reaction.”
Reaction, for Kirkpatrick, means waiting for the market to indicate what it is going to do and then (re)act accordingly. Kirkpatrick reacts when his data—either fundamental or technical—show a pattern that has proven successful in the past. When he sees such a pattern, his reaction follows three steps, which he terms STRACT:
To illustrate the STRACT method, Kirkpatrick offers the following example: Say a study shows that when stocks advance to new 52-week highs, their chances of advancing an additional 10% are 70%. Any stock you are following that nears its 52-week high enters the setup stage. However, at this point, no action is taken as you wait for the trigger—in his example, the stock hitting a new 52-week high. Once the trigger is initiated, your action would be to buy the stock.
Meeting the Relatives
Kirkpatrick states that the first investment problems we face are deciding what to buy and how to do so without having to predict anything. The AAII Kirkpatrick Growth model approach uses two principal methods for selecting stocks:
Kirkpatrick begins his analysis by collecting data from the immediate past. Growth investing requires accurate fundamental data for each stock in his investing universe. His price strength analysis requires a history of prices for each stock; it measures how a stock price behaves against its immediate past—if a stock is high versus its immediate past, it is said to have price strength.
Relative Growth
When looking at growth factors, Kirkpatrick prefers to look at growth in reported operating earnings, not predicted earnings. While he admits that reported earnings are not error-free, Kirkpatrick does question the validity and accuracy of forecasted earnings.
In “Beat the Market,” Kirkpatrick describes how he calculates the reported operating earnings relative rankings for each stock: “I take the last four quarters of reported earnings for each company and calculate a ratio of this total to the four-quarter total one quarter earlier.”
Kirkpatrick’s goal is to avoid seasonality, which is why he uses reported earnings over a full four quarters. Also, by using operating earnings, he eliminates the impact of special charges or nonrecurring items.
He calculates the relative reported (operating) earnings growth for all companies with positive earnings over both four-quarter periods and then ranks them into percentiles, with the companies having the highest growth being in the highest percentile.
Kirkpatrick’s research suggests that reported earnings growth is an effective stock selection tool during advancing markets. During bear markets, he found no statistical relationship between reported earnings growth and price performance.
Relative Price Strength
Kirkpatrick’s research indicates that relative price strength is the most reliable short-term stock selection technique. There are a number of ways to calculate relative price strength. Some calculations compare the percentage change in stock price over a defined period to the percentage change in a stock index, such as the S&P 500, over the same period. However, these measures do not necessarily protect you in a down market, as a stock can be falling and still have “strong” relative strength if it is not falling as rapidly as the index.
Kirkpatrick is concerned about capital loss, so his relative strength calculation involves dividing the current weekly closing price by the 26-week moving average of closing prices. He adds up the week-ending closing prices for each of the last 26 weeks and divides this total by 26. For each subsequent week, the oldest price is dropped and the latest weekly close is added to calculate the moving average. He then ranks all the stocks so that those with the highest relative strength are in the highest percentile rank.
To attempt to capture the essence of Kirkpatrick’s measure, AAII calculates the ratio of the current stock price to the average of the last six monthly closing prices.
Once again, Kirkpatrick found that there is a very strong positive relationship between relative price strength and forward price performance. As Kirkpatrick writes in his book: “Relative strength seems to breed more relative strength.” However, over time, this relationship gradually deteriorates. Eventually, moving forward 12 months, the relationship between 26-week relative strength and subsequent price performance all but evaporates. During both advancing and declining markets, Kirkpatrick found that relative price strength should be your primary selection criterion.
Growth Model
The AAII Kirkpatrick Growth strategy uses the best triggers found in his testing of relative earnings growth and relative price strength.
Reported Earnings Growth
Kirkpatrick uses a non-standard calculation for earnings growth, which compares operating earnings over the last four fiscal quarters to the total in operating earnings for the four-quarter period ending one quarter earlier. His goal is to eliminate the impact of seasonality on a company’s earnings.
Kirkpatrick uses operating income to avoid the special charges or adjustments to earnings. Furthermore, since Kirkpatrick only considers companies with positive trailing earnings, our approach eliminates those firms with negative operating earnings over either four-quarter period.
Relative Price Strength
The AAII Kirkpatrick Growth model approach selects stocks with relative price strength in the 90th percentile or higher.
Price and Market Cap
Lastly, AAII’s Kirkpatrick Growth model strategy seeks companies with market capitalizations of at least $1 billion and share prices of at least $10.
Conclusion
Kirkpatrick attempts to take emotion out of investing by using a mechanical approach to selecting stocks. Stocks to him are merely symbols. He allows his data analysis to dictate when to buy and sell stocks, by basing his selection process on relative variables that have tested very well over an extended period of time. Kirkpatrick believes he has found a strategy to identify growth stocks that will perform well in advancing markets and will alert you to sell in time to avoid large capital losses.
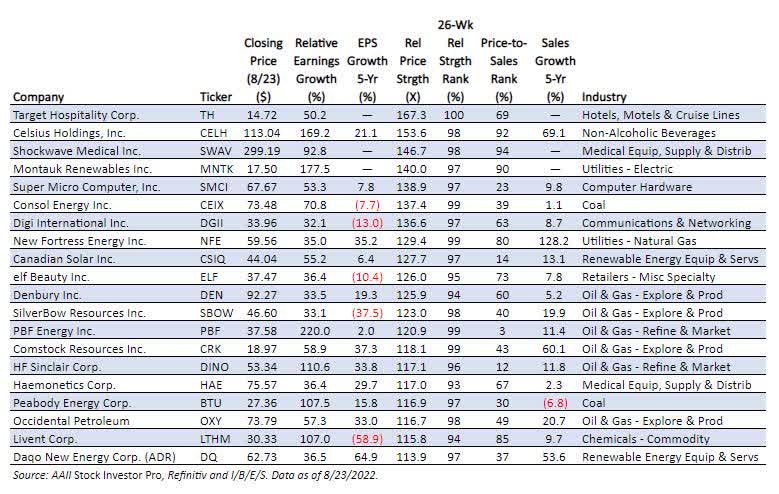
20 Stocks Passing the Kirkpatrick Growth Screen (Ranked by Relative Price Strength)
American Association of Individual Investors
Be the first to comment