

Oat_Phawat
Introduction
The Vancouver-based Eldorado Gold Corporation (NYSE:EGO) released its third quarter 2022 results on October 28, 2022.
Note: This article is an update of my article published on October 20, 2022. I have followed EGO’s quarterly Seeking Alpha results since January 2015.
EGO Assets map presentation (EGO Presentation)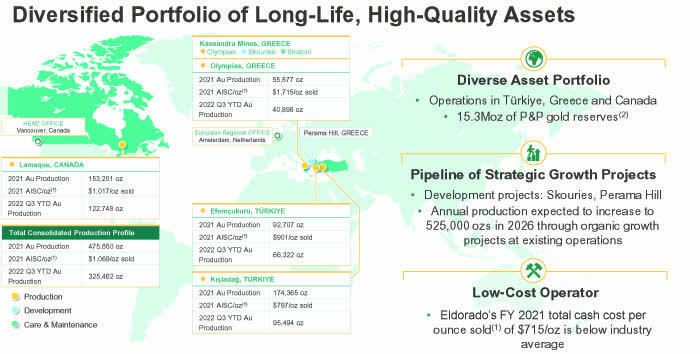
1 – 3Q22 Results Snapshot
Gold production came in at 118,791 Oz, up from 125,459 Oz produced in 3Q21 and up from 113,462 Oz delivered the preceding quarter.
The revenue for the second quarter of 2022 was $213.447 million on gold sales of 107,631 Oz. Net Income was a loss of $50.49 million in 3Q22, with cash operating costs of $803 per ounce sold.
Kisladag production returned to a healthy level this quarter, as shown in the chart below:
EGO Quarterly Production 2Q22 versus 3Q22 (Fun Trading)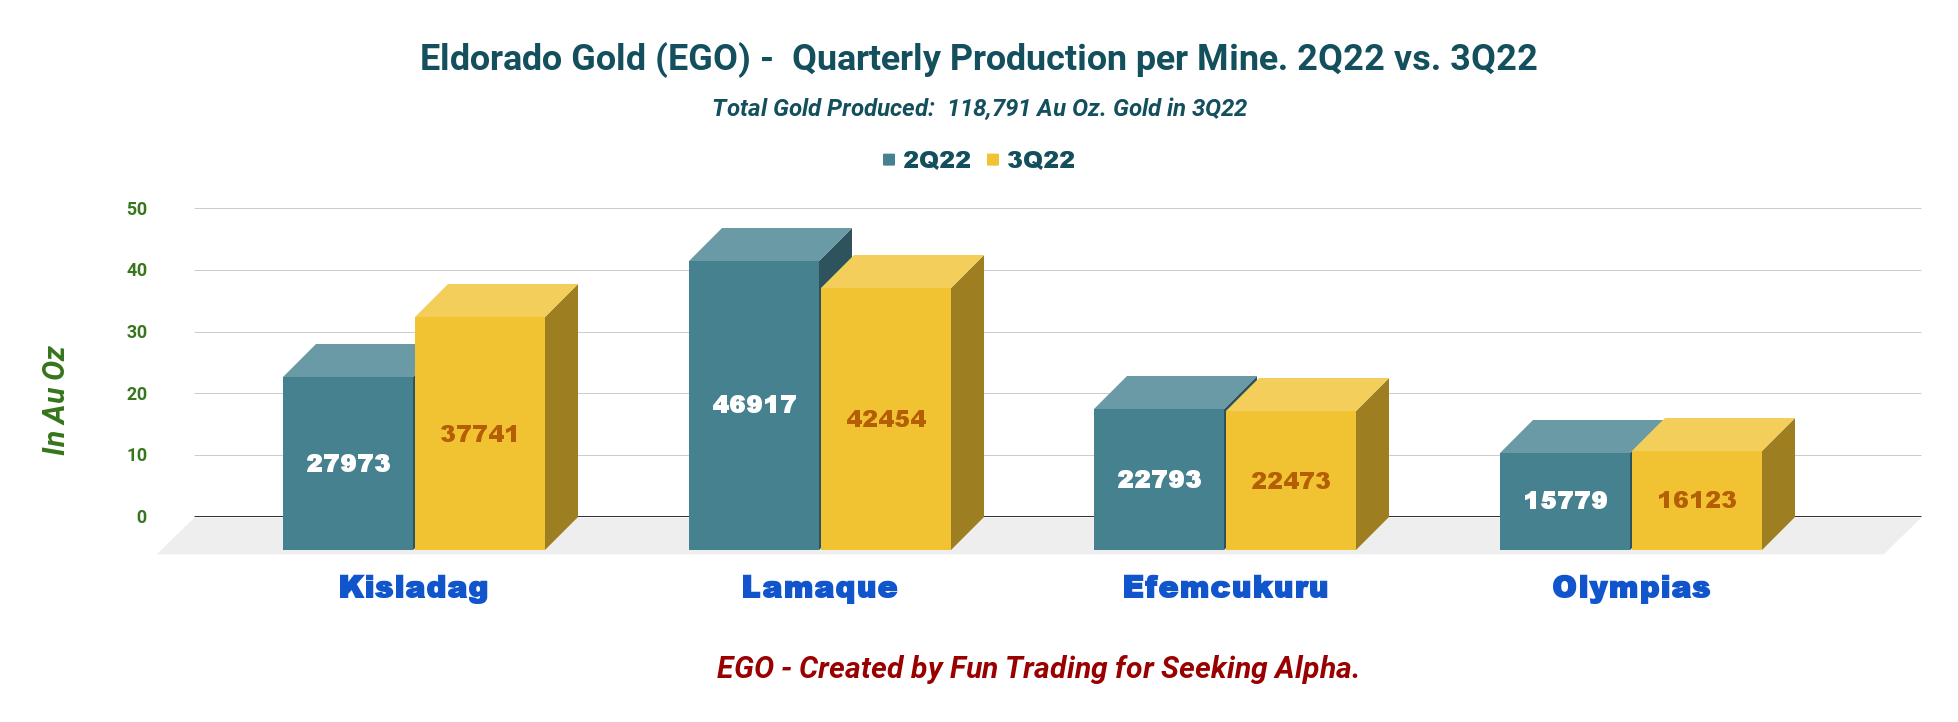
CEO, Georges Burns, said in the conference call:
After a challenging start to the year, our site teams have been able to deliver sequential improvements, and I’m pleased to report that our production results again improved in the third quarter. We continue to see operating trends improve throughout the year and expect strong production in the fourth quarter. Eldorado remains on track to achieve full-year production of 460,000 ounces which is at the low end of our consolidated guidance range.
2 – Investment Thesis
The investment thesis continues to be a problematic task for this mid-cap gold miner due to the coming development stage of its Greek assets. Eldorado Gold is trading at a reasonable valuation of 0.4x P/NAV with a cash position now at $306.50 million.
EGO is about to develop Skouries with secured financing, which will be a strong catalyst.
EGO Skouries feasibility (EGO Presentation)
I am not very enthusiastic about the management, which I find weak and not up to the task. However, the company owns some good-producing assets and should be accumulated on any weakness now.
One positive step: The signing of a mandate letter with Greek Banks for a credit committee approved €680 million credit facility representing 80% of the total funding requirement expected.
Next step: Signing the definitive agreement with the Bank and getting the green light for Skouries construction, expected at the end of 2022.
Possible issue: Due to inflationary pressures and despite management confidence, I believe the Capital cost of $845 million will go up and potentially above $1 billion.
EGO Greek assets financing (EGO Presentation)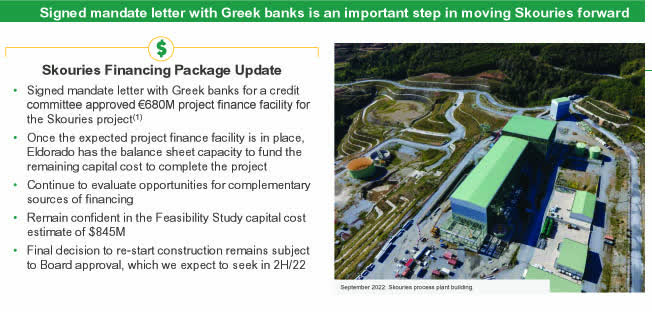
CEO Georges Burns said in the conference call:
We are making progress on negotiating definitive binding loan documents and advancing other approvals and conditions. And the final decision to restart full construction and the project financing facility remains subject to Board approval, which we expect to see before the end of the year.
Thus, I believe it is an excellent time to take advantage of the low stock price and start a slow long-term accumulation. But, because a highly volatile environment characterizes the gold sector, short-term trading using the LIFO method is vital to make this investment worthwhile.
The solution is to trade EGO short-term LIFO using at least 50% of your entire position while keeping a core long-term position. This two-level strategy has prevailed in my marketplace, “The Gold And Oil Corner,” and I believe it is the most rewarding.
3 – Stock Performance
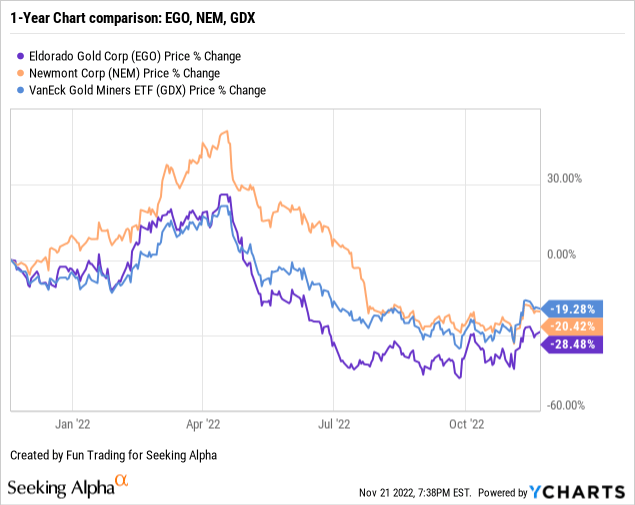
The stock has underperformed the VanEck Vectors Gold Miners ETF (GDX) and Newmont Corp. (NEM) and is now up 28% on a one-year basis. After early April, the entire sector dropped precipitously when the Fed started to hike interest.
Eldorado Gold – 3Q22 Balance Sheet And Gold Production: The Raw Numbers
| Eldorado Gold | 3Q21 | 4Q21 | 1Q22 | 2Q22 | 3Q22 |
| Total Revenues (metals sales) In $ Million | 238.44 | 244.64 | 194.67 | 213.45 | 217.7 |
| Net Income in $ Million | -52.22 | -40.00 | -316.82 | -22.72 | -50.49 |
| EBITDA $ Million | 106.81 | 107.82 | -319.26 | 74.91 | 43.73 |
| EPS diluted in $/share | -0.29 | -0.22 | -1.74 | -0.12 | -0.27 |
| Cash from Operating Activities in $ Million | 105.80 | 113.17 | 35.24 | 26.94 | 52.51 |
| Capital Expenditure in $ Million | 76.41 | 90.33 | 63.13 | 90.26 | 80.04 |
| Free Cash Flow in $ Million | 29.39 | 22.83 | -27.89 | -63.33 | -27.52 |
| Total Cash $ Million | 461.20 | 481.49 | 434.87 | 370.11 | 306.50 |
| Long-term Debt in $ Million | 497.73 | 497.87 | 497.92 | 497.98 | 498.03 |
| Shares outstanding (diluted) in Million | 183.95 | 182.52 | 182.36 | 183.76 | 183.78 |
| Eldorado Gold Production Au Oz | 3Q21 | 4Q21 | 1Q22 | 2Q22 | 3Q22 |
| Production gold Au Oz | 125,459 | 122,582 | 93,209 | 113,462 | 118,791 |
| AISC in $/ounce sold | 1,133 | 1,077 | 1,347 | 1,270 | 1,259 |
| Gold Price in $/ounce sold | 1,769 | 1,776 | 1,889 | 1,849 | 1,688 |
Source: Company filing and Fun Trading files.
* Revenues include “Gain on revaluation of derivatives in trade receivables in gold and other metals,” and total revenues from metals sales were $222.07 million.
Note: More data are available to subscribers only.
Part I – Balance Sheet And Production Discussion
1 – Revenues for 3Q22 were $217.7 million
EGO quarterly Revenues history (Fun Trading)
Revenues were $217.7 million, down from $238.44 million the same quarter a year earlier and up 2% QoQ.
The company recorded a net loss to shareholders in the third quarter of $50.49 million, or $0.27 per diluted share.
Gold sold this quarter was 118,791 Au ounces. The company sold its gold at $1,688 per ounce. The adjusted net earnings for the quarter were a loss of $8.0 million, or $0.04 per share.
EGO Quarterly Gold price history (Fun Trading)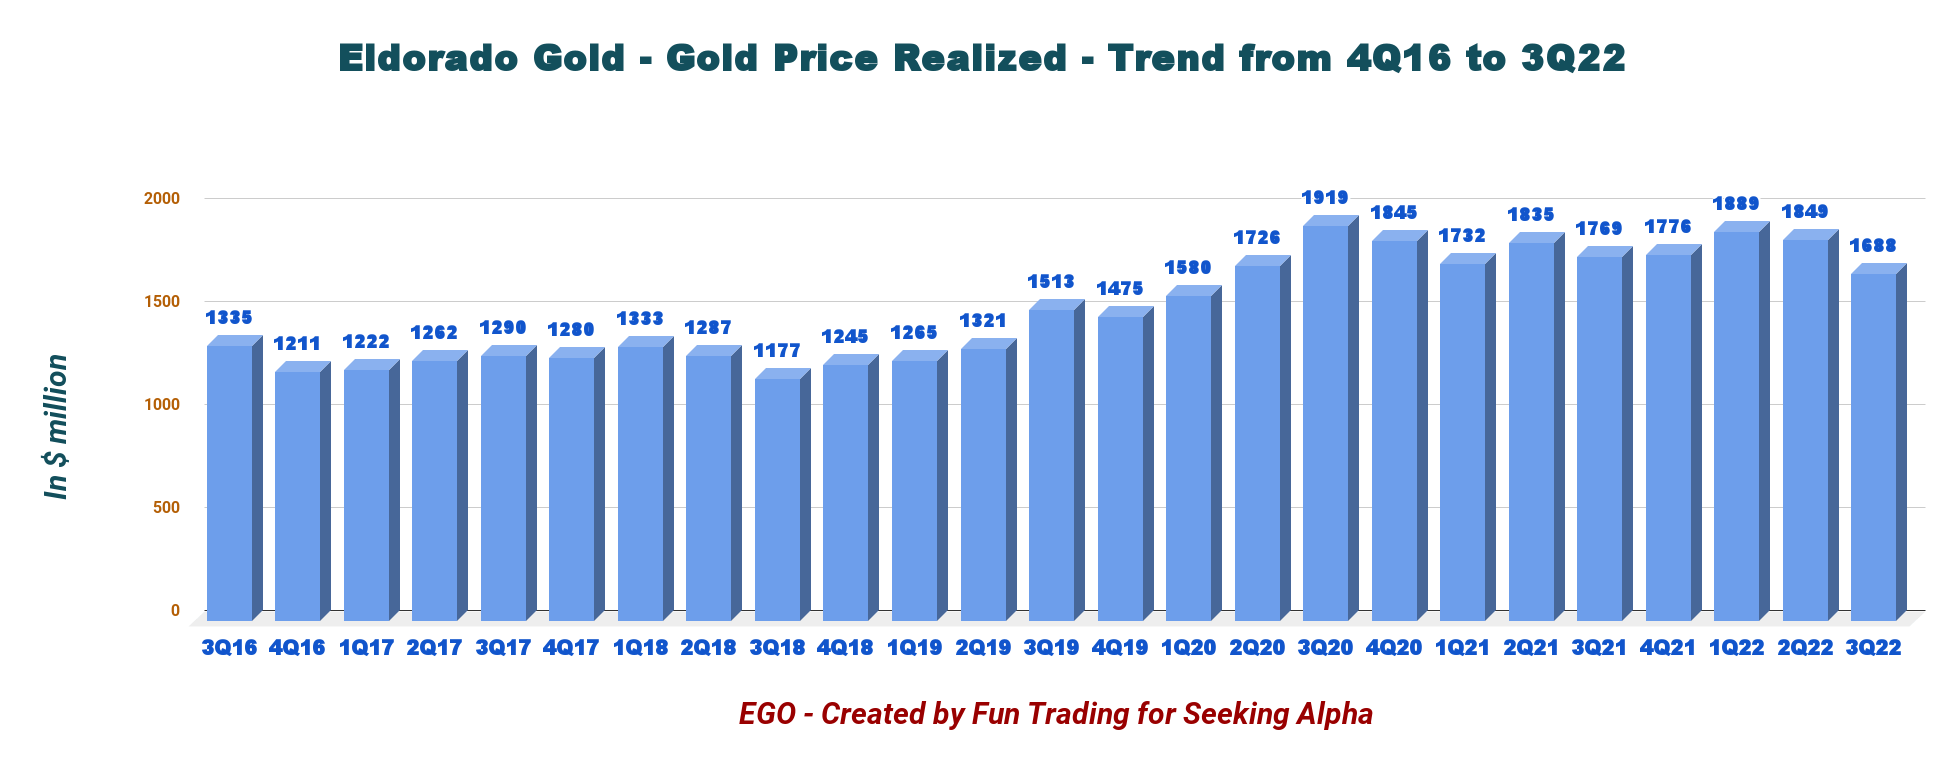
2 – Eldorado Gold’s net debt increased to $191.53 million in 3Q22
EGO Quarterly Cash versus Debt history (Fun Trading)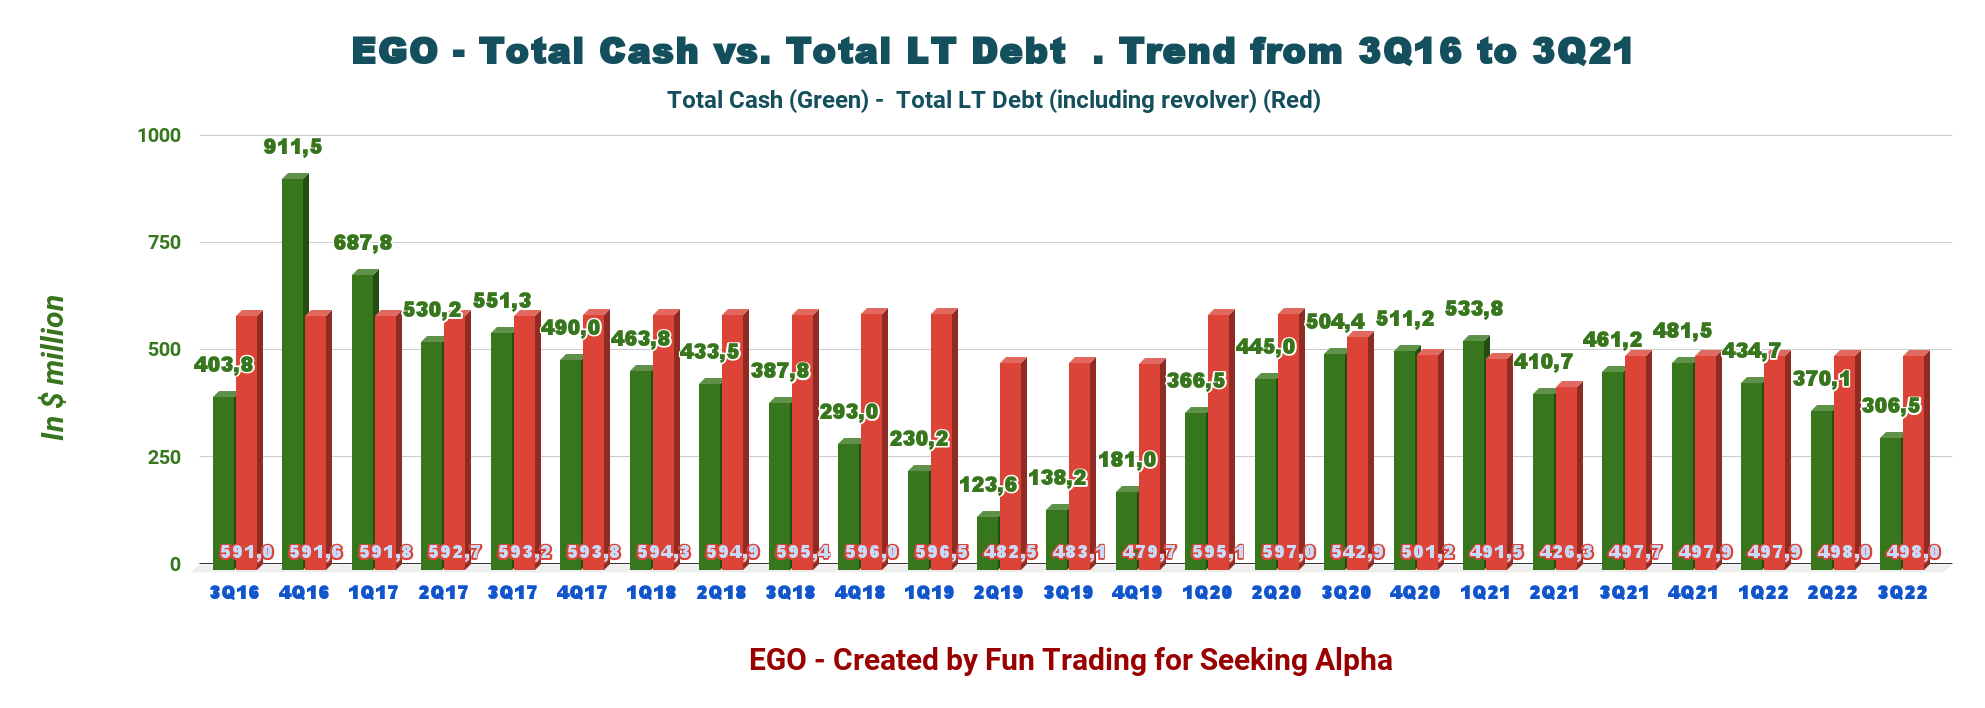
Total cash this quarter stands at $306.50 million, down from $370.11 million in the previous quarter. Total debt, including current, stands at $498.03 million. Total liquidity is $556 million.
Total cash is weakening rapidly, and it is a going concern.
EGO Quarterly Total Cash history (Fun Trading) Below is a balance sheet presentation as of September 30, 2022: EGO Balance sheet (EGO Presentation November)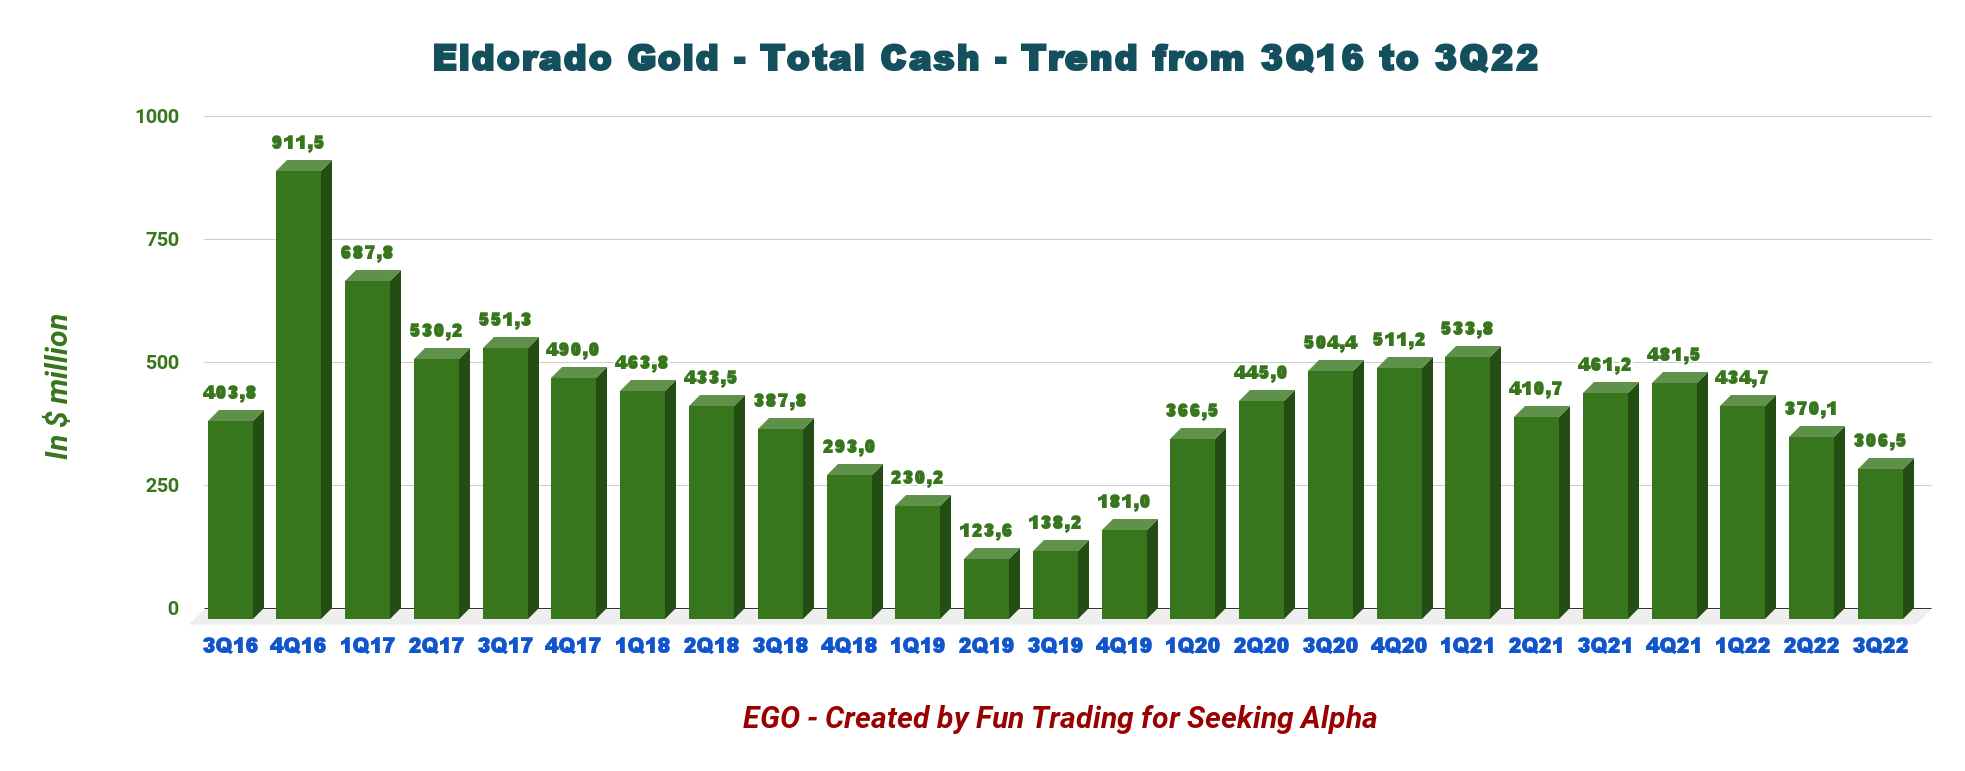

3 – The free cash flow was a loss of $27.52 million for the third quarter of 2022
EGO Quarterly Free cash flow history (Fun Trading)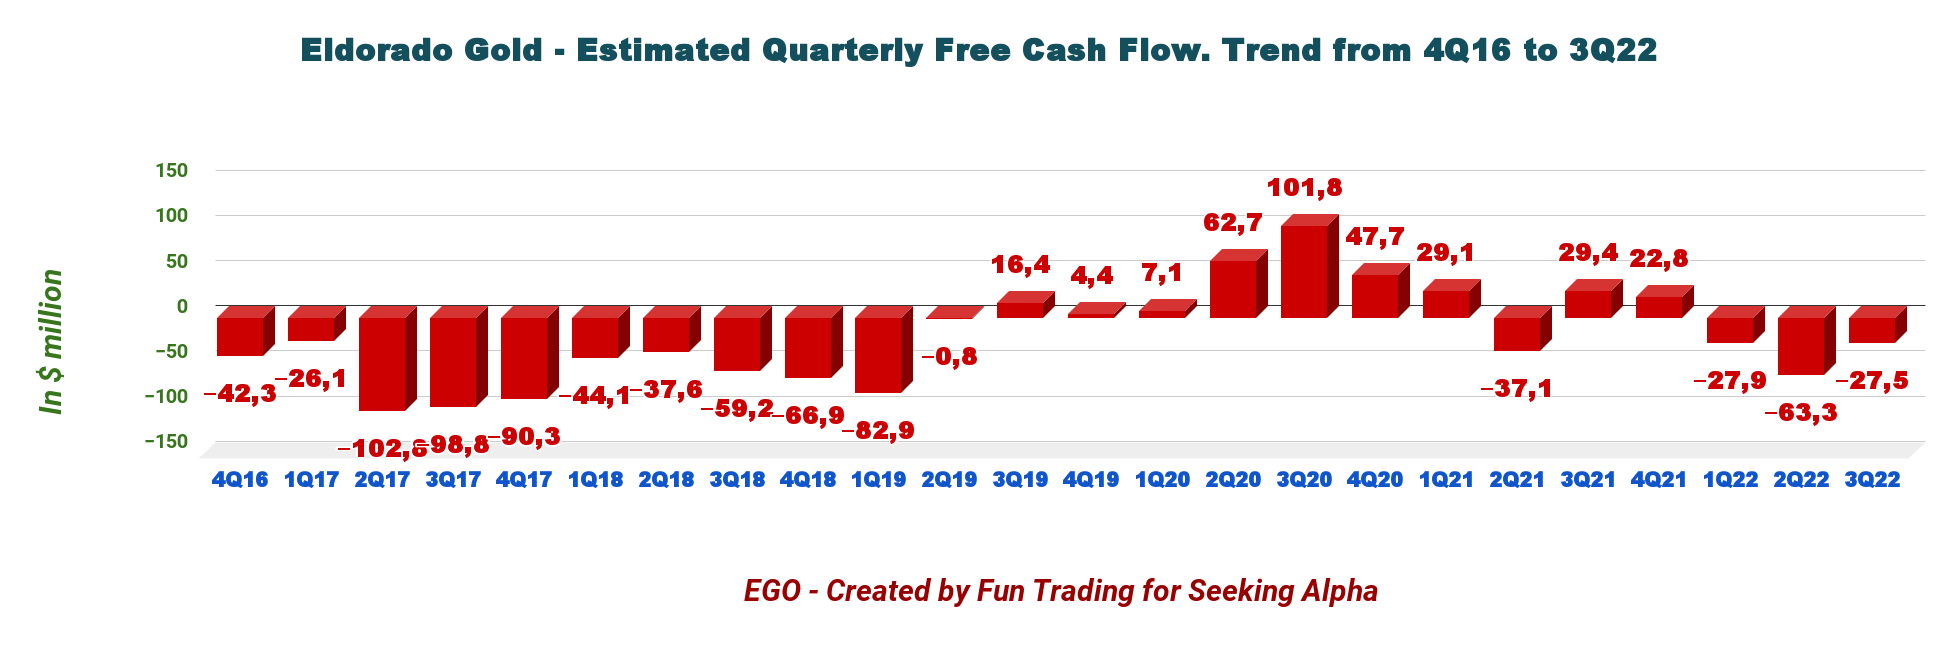
EGO shows a trailing 12-month free cash flow loss of $95.91 million, with a loss of $27.52 million for the third quarter of 2022.
A recurring negative free cash flow is not a good sign. CapEx seems too high compared to cash flow from operations and should be reduced quickly. The excess CapEx is not producing a positive effect on free cash flow.
Part II – Gold Production Details For 3Q22
On October 12, 2022, the company announced the initial gold production for the third quarter of 2022. This is an update of my article published on October 20, 2022.
EGO Quarterly Gold production history (Fun Trading)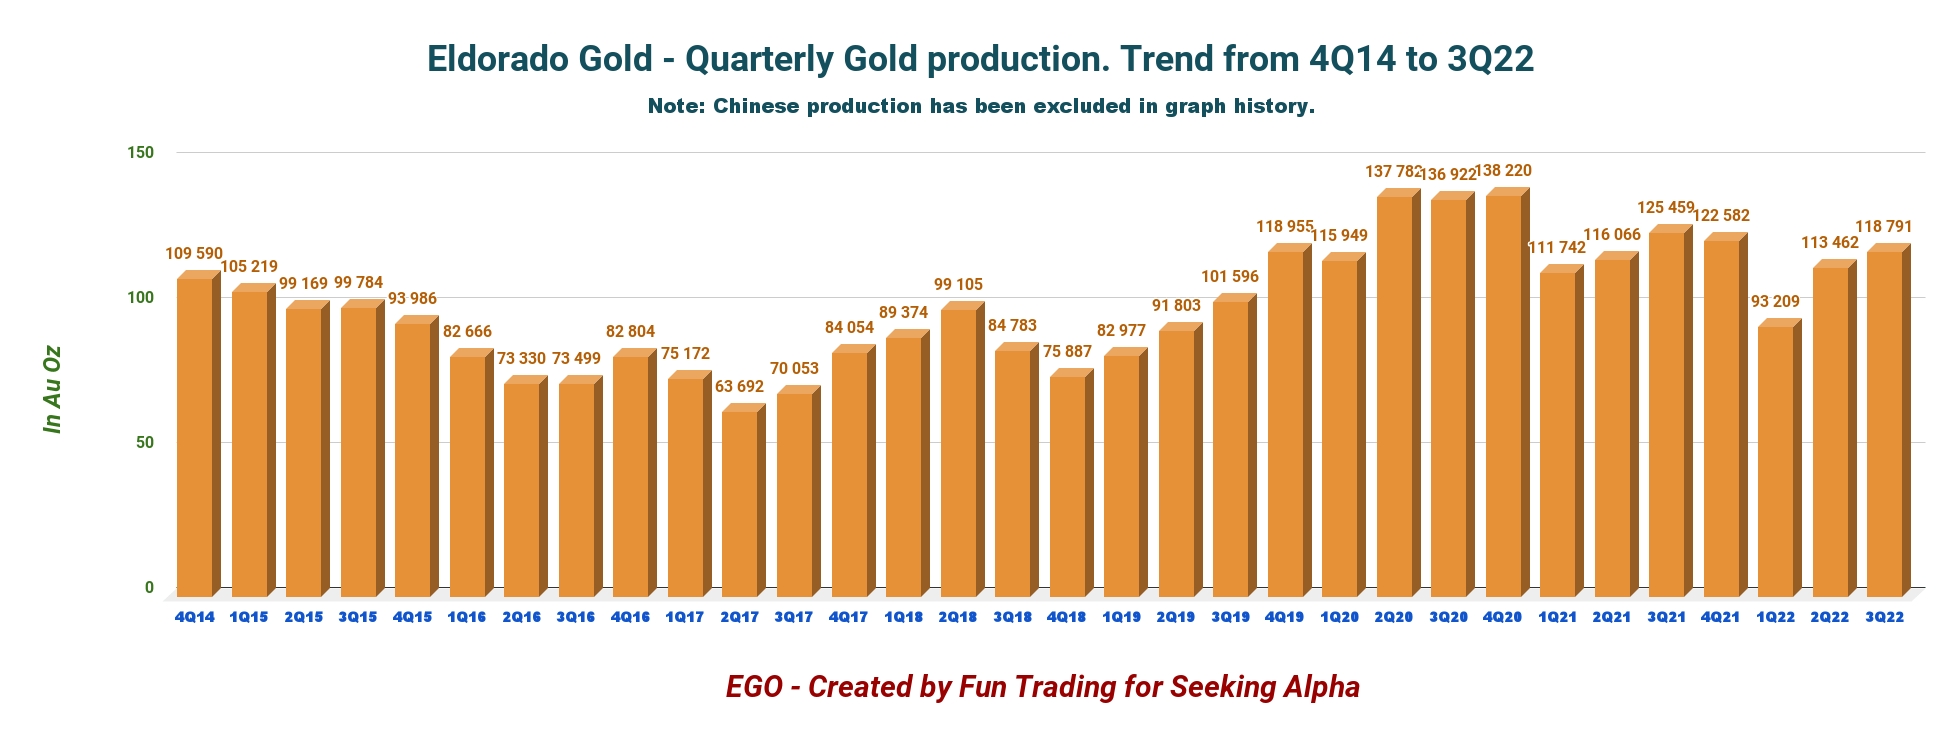
The third quarter of 2022 production came in at 118,791 Au Oz, down 5.3% year-over-year and up 4.7% sequentially.
1 – Olympias Mine
Olympias had steady production and solid grade control, evidence of the progressive transformation in action. The company said that other transformation initiatives continue at pace as the mine ramps up productivity. However, full-year 2022 production at Olympias is expected to be lower than planned.
Production came in at 16,123 ounces compared to 15,779 ounces produced in 2Q22 and 13,745 ounces in 3Q21.
EGO Olympias Quarterly Gold production history (Fun Trading)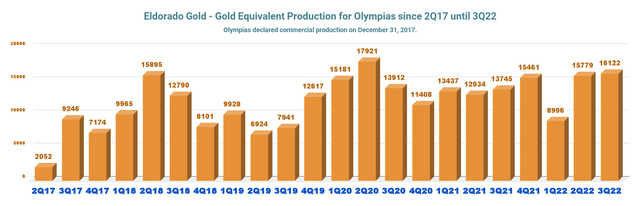
2 – Lamaque Mine
At Lamaque, third-quarter production was slightly below plan due to lower throughput. Underground development of high-grade stopes progressed well during the quarter and should help output in 4Q22.
Production came in at 42,454 ounces, up from 37,369 ounces in 3Q21 and down 9.5% sequentially. It was a slight disappointment here.
EGO Lamaque Quarterly Production history (Fun Trading)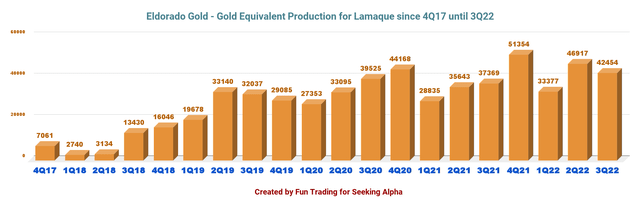
3 – Kisladag Mine
Third-quarter gold production at Kisladag increased by 27% and 35% over the first and second quarters, respectively. However, production was still well below the 3Q21.
The sequential increase in gold production was due to the rise in tonnes placed on the pad during the second quarter.
The on-belt agglomeration continues to perform as expected. As part of the North heap leach pad project, larger conveyors will be installed on schedule in the fourth quarter, further improving materials handling capabilities in the belt agglomeration circuit and throughput rates.
Thus, Eldorado expects production at Kisladag to be weighted to the year’s second half.
Production came in at 37,741 ounces, down from 51,040 ounces in 3Q21 and 297,973 ounces produced in 2Q22.
EGO Kisladag production (Fun Trading)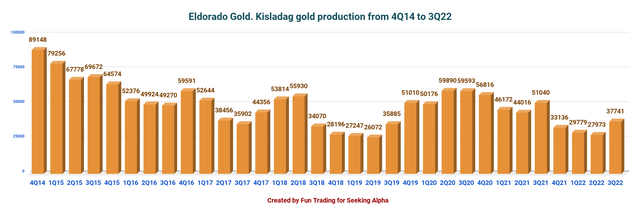
4 – Efemcukuru Mine
Production was in line with expectations. Gold production was 22,473 ounces compared to 23,305 ounces in the same quarter last year.
Gold production, throughput, and average gold grade aligned with expectations.
EGO Efemcukuru Production (Fun Trading)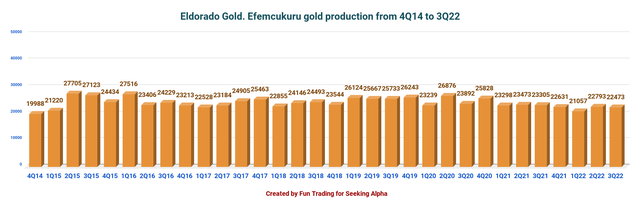
5 – AISC is now $1,259 per ounce
Inflationary pressures are still hurting.
EGO Quarterly AISC history (Fun Trading)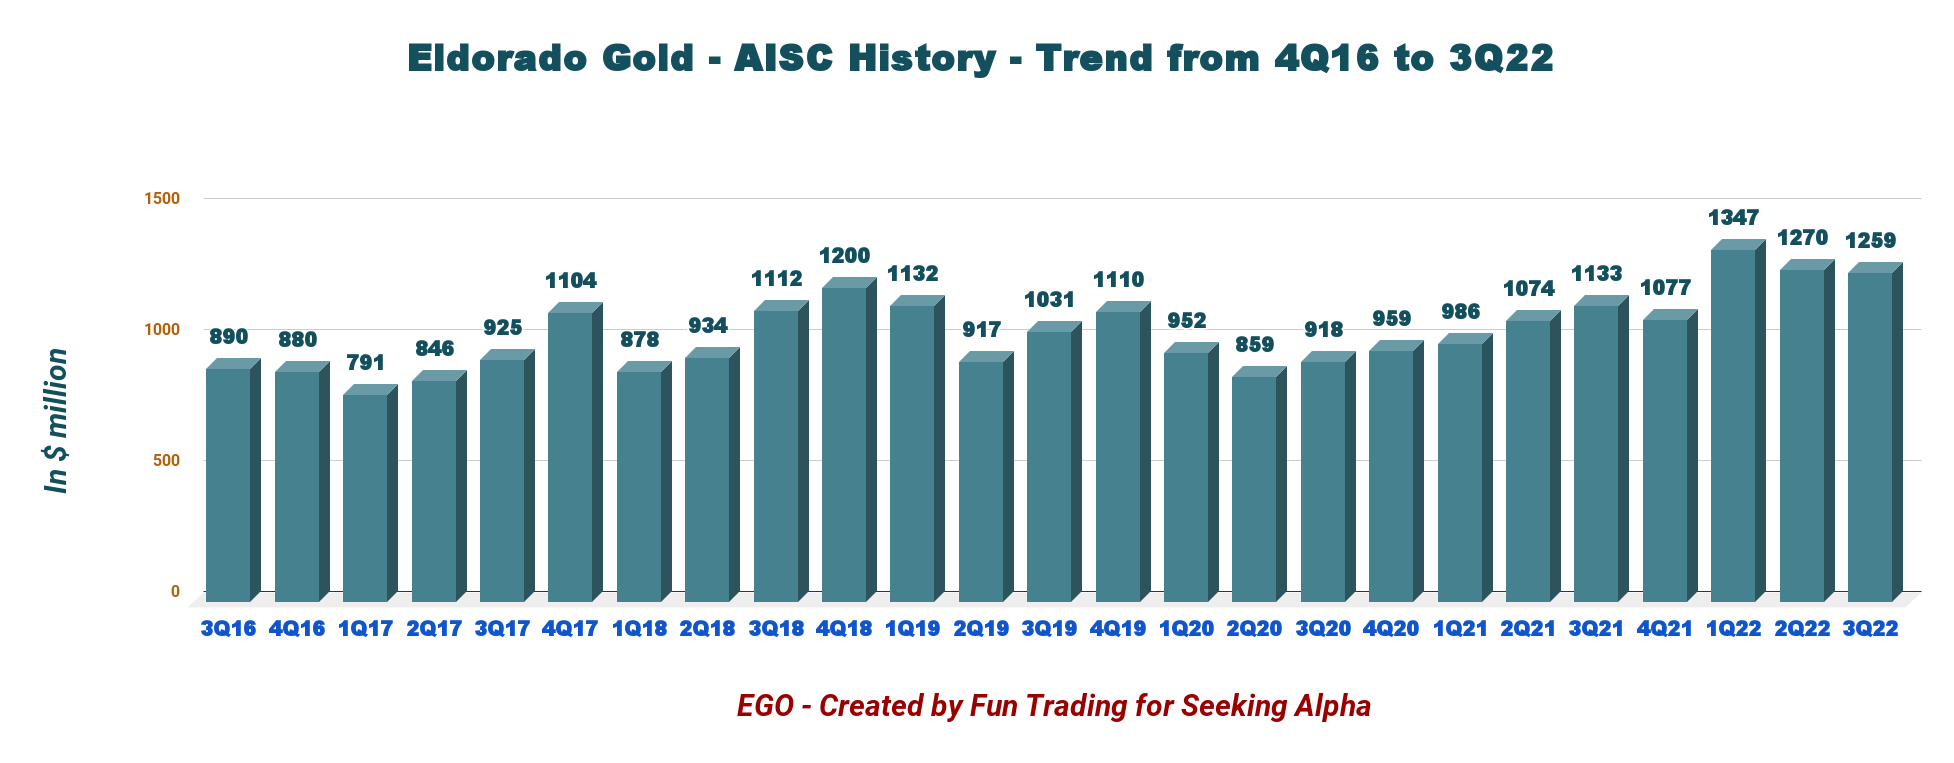
6 – Eldorado Gold maintained full-year consolidated production guidance of 460K to 490K ounces and increased AISC to $1,180 to $1,280 per ounce sold
However, 2022 guidance for consolidated cash operating costs are $700 to $750 per ounce sold, total cash costs to $790 to $840 per ounce sold, and AISC to $1,180 to $1,280 per ounce sold.
Gold production guidance is still between 460K to 490K ounces, with production increasing by 10% over 5 years, not including Skouries.
EGO 2022 and beyond outlook (EGO Presentation)
Technical Analysis And Commentary
EGO TA Chart short-term (Fun Trading StockCharts)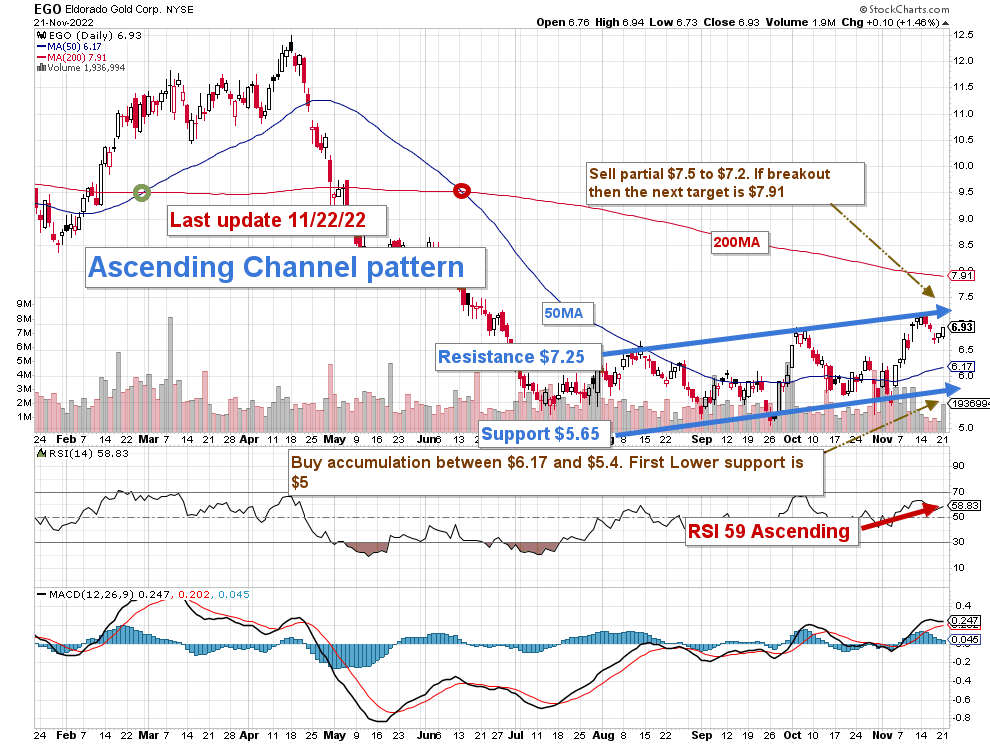
EGO forms an ascending channel pattern with resistance at $7.25 and support at $5.65. Ascending channel patterns are generally short-term bullish, moving higher within an ascending canal, but these patterns often form within longer-term downtrends as continuation patterns.
The short-term trading strategy is to sell between $7.2 and $7.5, about ~50% of your position, and buy between $6.17 (50MA) and $5.4 with potential lower support at $5.
The gold mining sector has experienced a significant drop triggered by the Fed’s action against inflation. The risk of recession later this year due to rampant inflation negatively affects the gold miners by strengthening the US dollar.
The next CPI number on December 13 will be a great indicator. I expect the Fed to raise the interest rate by another 75 points on December 14, which may hurt the gold price, which recovered a little last week. However, if the Fed decides to hike interest by 50 points, gold could eventually rally on the news and cross $1,800.
Watch the gold price and the Fed like a hawk.
Note: The LIFO method is prohibited under International Financial Reporting Standards (IFRS), though it is permitted in the United States by Generally Accepted Accounting Principles (GAAP). Therefore, only US traders can apply this method. Those who cannot trade LIFO can use an alternative by setting two different accounts for the same stock, one for the long term and one for short-term trading.
Warning: The TA chart must be updated frequently to be relevant. It is what I am doing in my stock tracker. The chart above has a possible validity of about a week. Remember, the TA chart is a tool only to help you adopt the right strategy. It is not a way to foresee the future. No one and nothing can.
Author’s note: If you find value in this article and would like to encourage such continued efforts, please click the “Like” button below as a vote of support. Thanks.
Be the first to comment