


Andrii Dodonov
Our recent takes on the Collateralized loan sector have been on the neutral to negative side. On one hand, we appreciate the large sources of income that are being dished out. On the other, we see a lot of weaknesses in the setup and this has been validated by total returns that are generally far below the stated distribution yield. These differences of course are dependent on the fund and some funds like Oxford Lane Capital (OXLC) have indeed done better than other funds like Eagle Point Credit Company Inc. (ECC). Today, we look at yet another fund in this area, Eagle Point Income Company Inc. (NYSE:EIC) and see if this has a better setup for investors.
EIC is sponsored by Eagle Point Credit Management and uses the same team as ECC.

CEF Connect
The fund is on the small side with both total assets and net assets looking remarkably small versus some of its brethren.
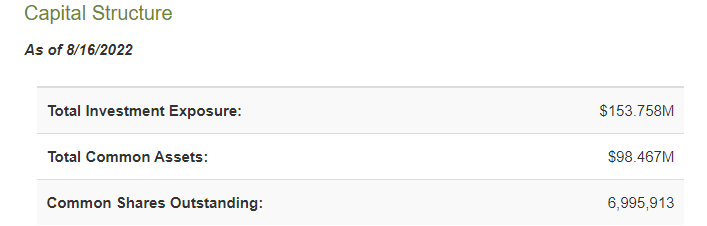
CEF Connect
As a comparative, we have shown the funds we mentioned earlier, alongside XAI Octagon Floating Rate & Alternative Income Term Trust (XFLT).
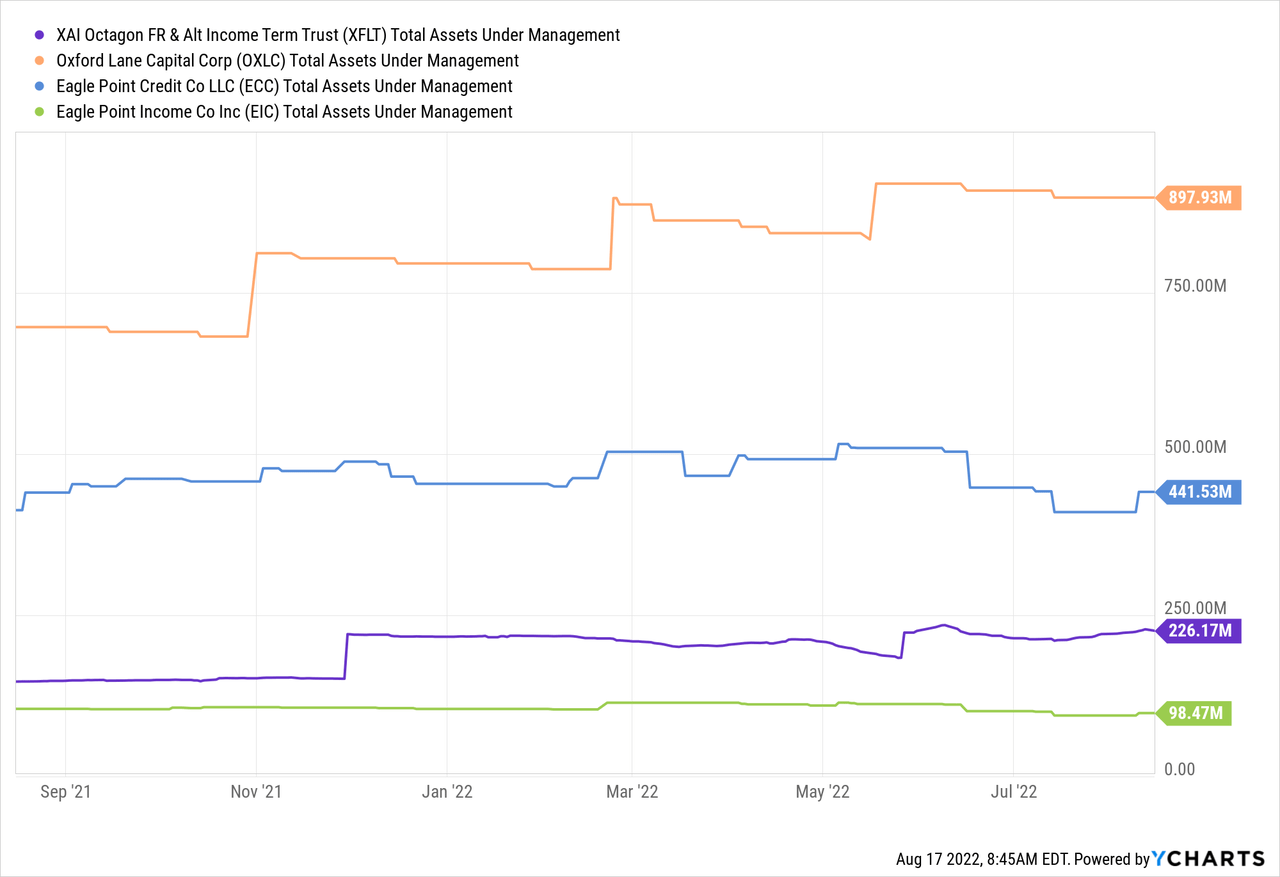
A smaller asset base comes with advantages in nimbleness and funds can enter and exit sizeable positions without moving the market. That said, none of the four funds shown above are particularly large in relation to the entire CLO market. New CLO issuance alone was over $184 billion in 2021 and total market size many multiples of that.
What’s The Hook?
The Company’s primary investment objective is to generate high current income, with a secondary objective to generate capital appreciation. We seek to achieve these objectives by investing primarily in junior debt tranches of collateralized loan obligations (“CLOs”) rated “BB” (e.g., BB+, BB or BB-, or their equivalent). In addition, the Company may invest up to 35% of its total assets (at the time of investment) in CLO equity securities and other securities and instruments that are consistent with our investment objectives.
Source: EIC Annual Report
That sums up the investment objectives and the hook here is the focus on the debt side of the CLO game. The equity portion is obviously riskier and EIC’s risk profile on an unleveraged basis is hence closer to XFLT vs either ECC or OXLC. That said, there is a lot of B-, CCC+, CCC and CCC- for our tastes.
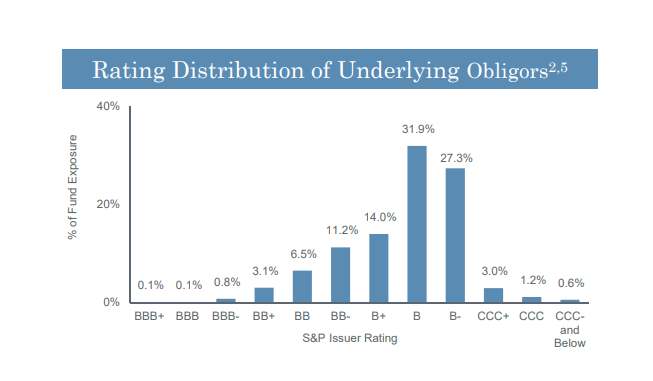
EIC
The distribution yield profile is also closer to XFLT. Note that different sites have different numbers for yields depending on whether the forward or trailing 12 months are used and whether or not special distributions are incorporated into the calculations.
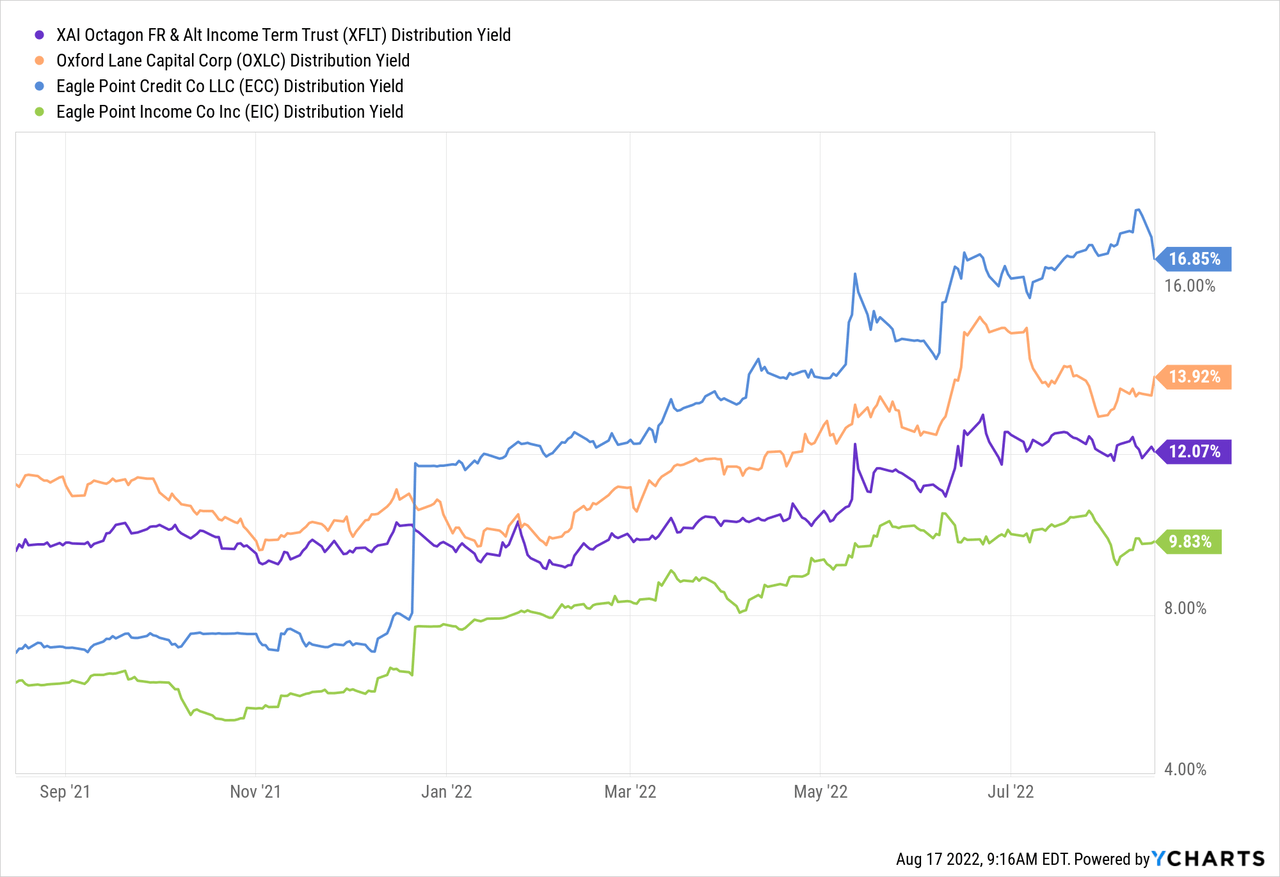
But the point will stand as long as we do an apples to apples comparison. EIC yields a lot less than other funds.
Performance
EIC has had an ok performance since inception. NAV changes have been just awful for all the funds mentioned and EIC has not been any different. EIC’s NAV has dropped from the $20.00 start point to $14.20. The first published NAV (which includes the fees related to the IPO) was $19.79.

EIC
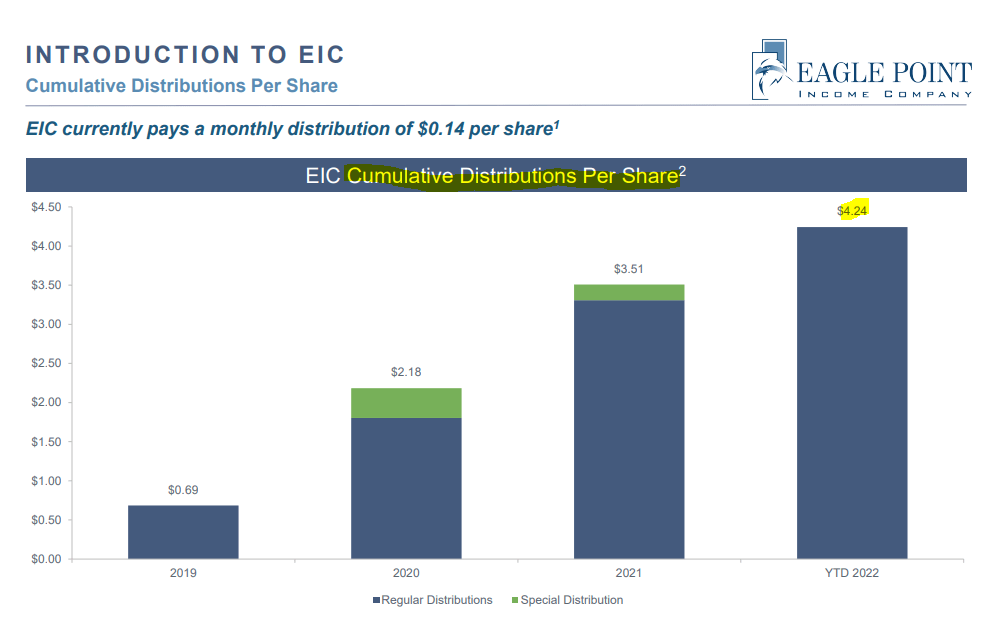
The cumulative distributions per share were $4.24 till June 30 ($4.38 including July 2022).
EIC
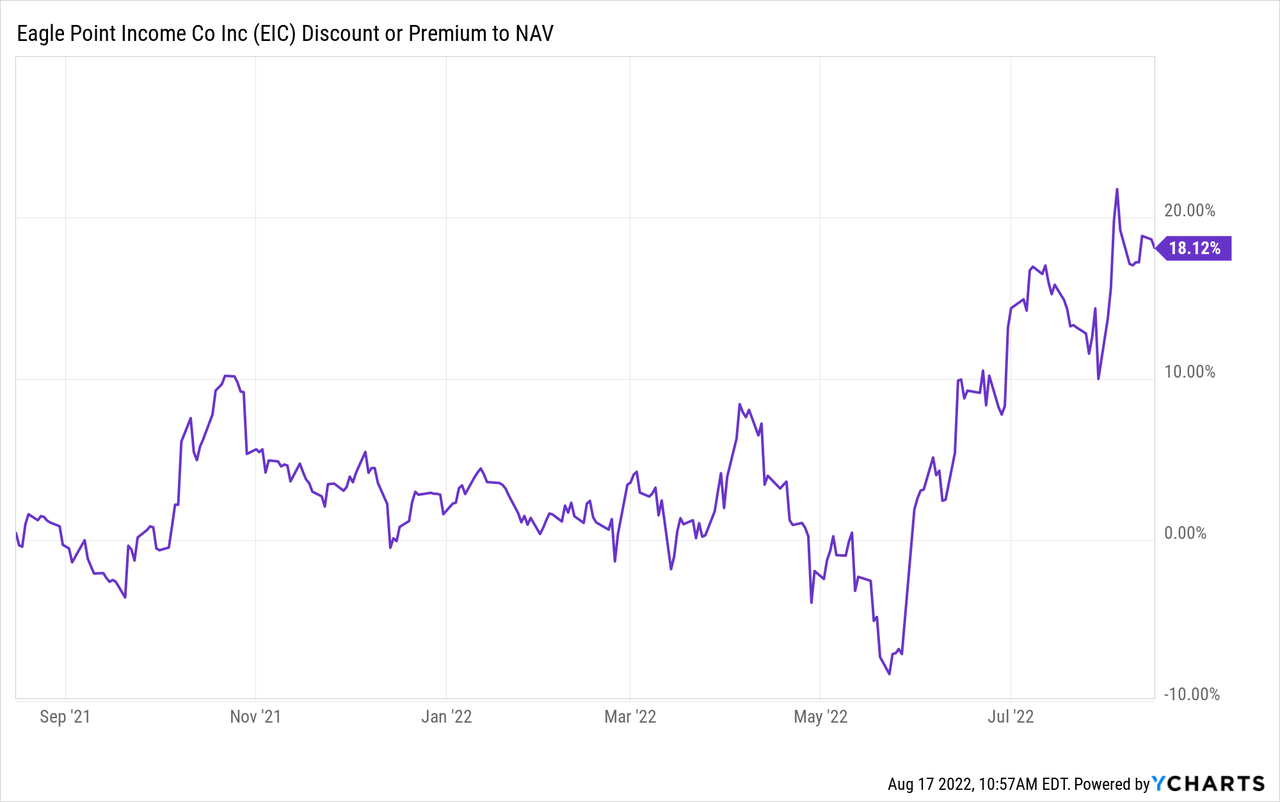
So some basic math will tell you that you lost more NAV over the last three years than you gained in distributions. If you do your total returns without dividend reinvestment you get a slight positive outcome, but that is driven by the fund trading at a decent premium.
What caused the poor performance? The bulk of it was driven by a rather bad 2020 where EIC did far worse than XFLT.
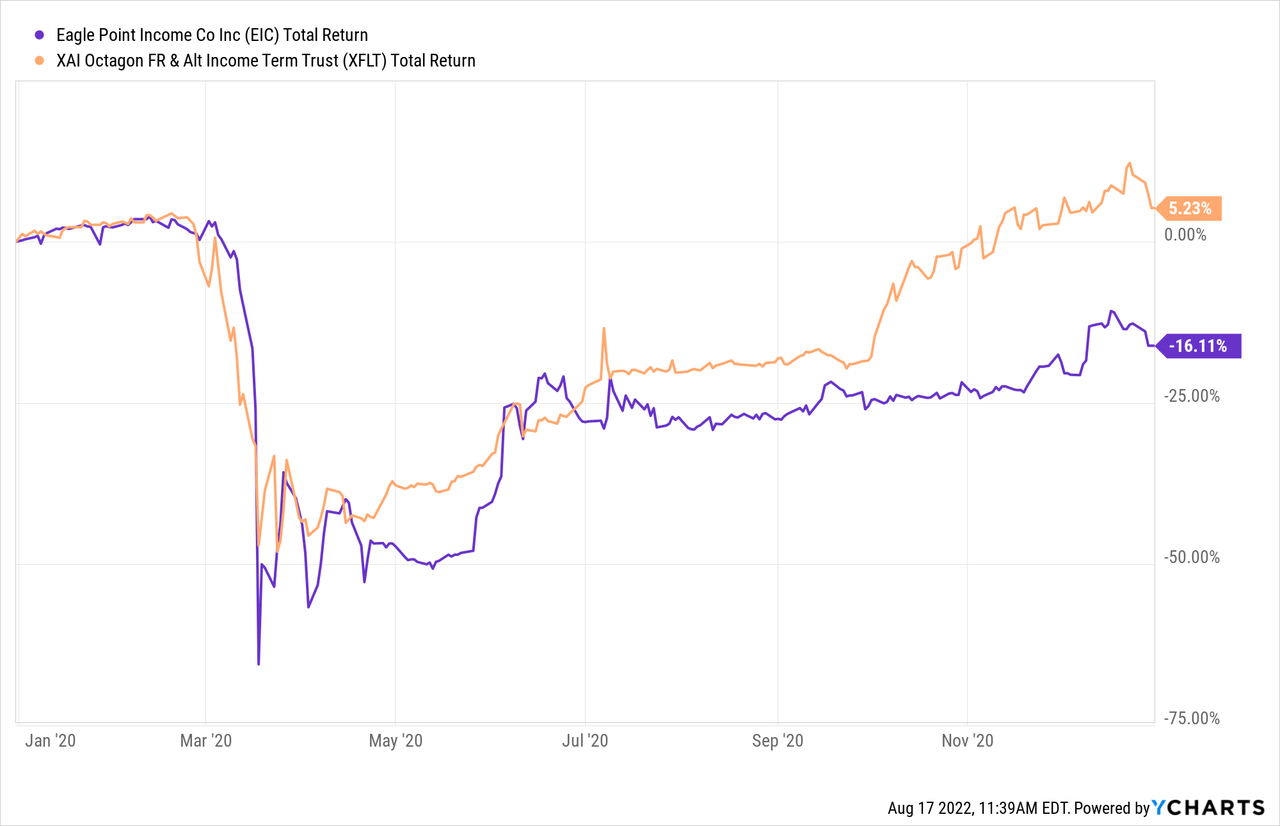
Since then it has done quite well relative to all four CLO funds and the initial jitters have given away to more steady performance.
Outlook
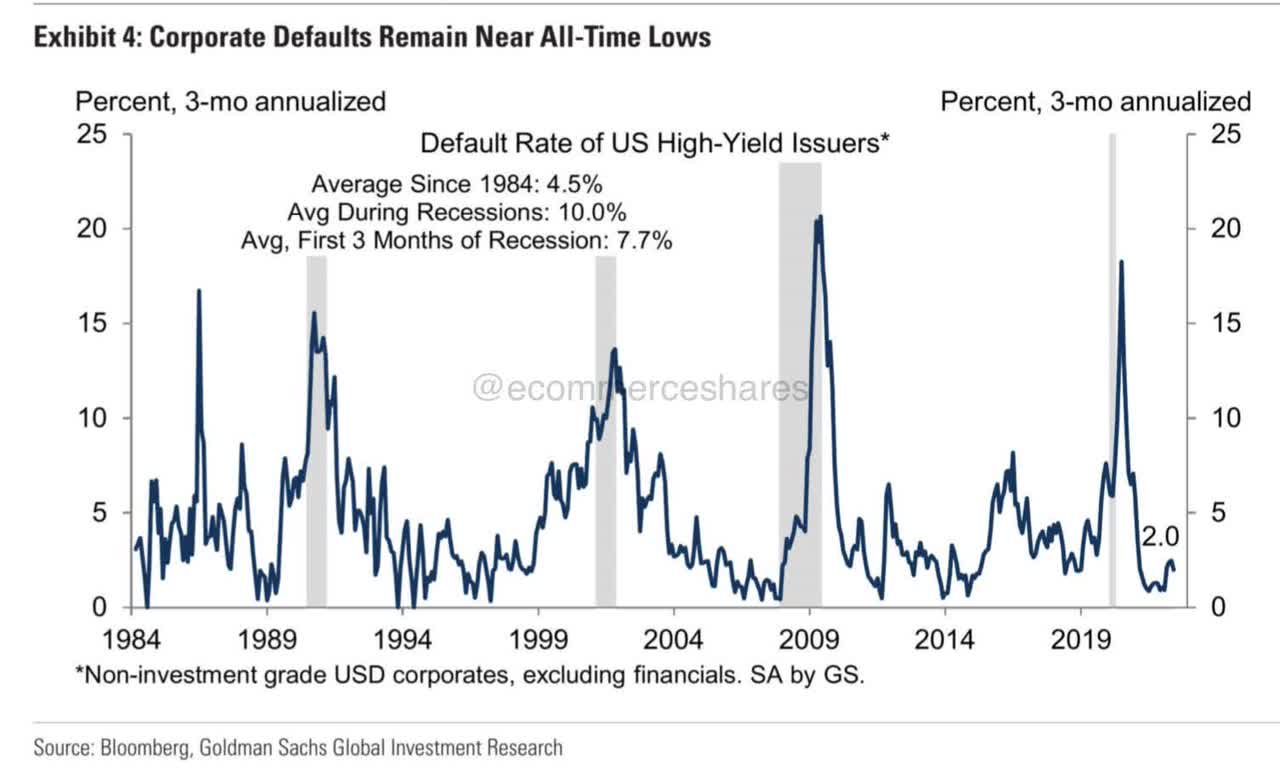
Our outlook here is that a recession is inevitable and CLO pricing has not fully reflected this. While pricing has improved (as in CLO prices have moved lower), they are not at levels we consider to be adequate. They look good relative to actual defaults, but defaults should rise substantially over the next 12 to 18 months.
Goldman Sachs
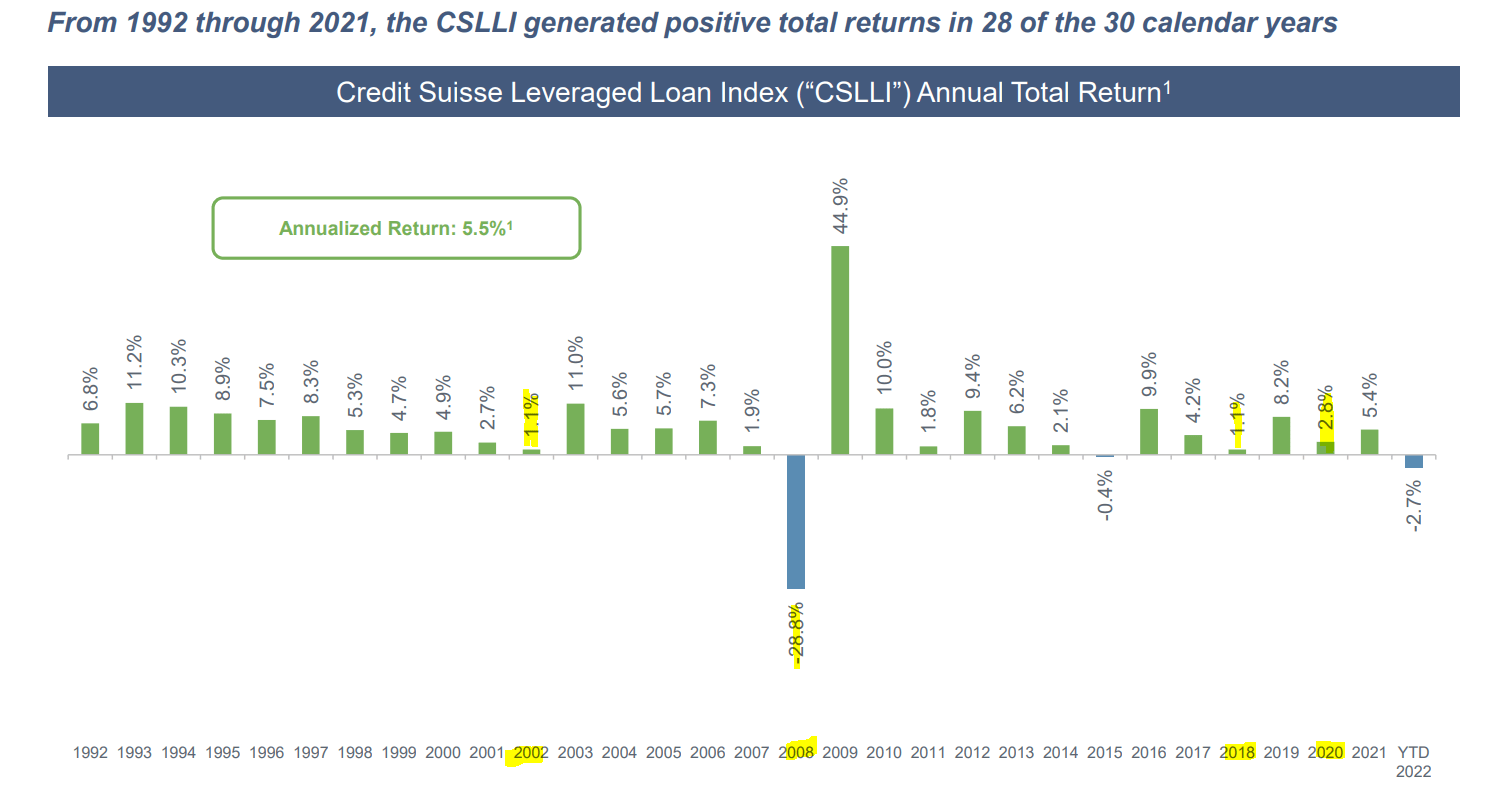
So when all is said and done we expect a difficult time ahead, with the fund struggling to preserve NAV while doling out the distribution. This is not remotely rocket science. The average total return for the leveraged loan index is 5.5% annually.
EIC
2002, 2008, 2018 (near recession), and 2020, if averaged, have produced negative returns. Even the best year out of those four, does not come close to the distribution yield of EIC. Of course the way EIC tries to make up for this is via leverage. This can work to a certain extent, but investors must keep in mind that it also increases risks. Your asset class, any asset class, is less safe when you apply leverage on it. The bigger problem is that the expense ratio is extremely unwieldy. The 2021 annual report captured this at 5.92% (page 42). We are least interested in working out the exact number today as the reality is that anywhere in the ballpark, is unacceptable at this stage of the game. Again, we draw your attention to the asset class and its average returns and we draw your attention to returns in recessions.
Verdict
EIC is finding its footing here versus its starting performance. It is also a bit safer than both ECC and OXLC. The interest rate hikes are flowing through its floating assets and we should see more cash flow for the CEF. The expense ratio though, alongside our outlook for a recession makes this a tough one to back. We expect CLO returns to be weak, and EIC could logically move to a discount down the line. Recoveries are also likely to be weak on CLOs versus historical averages.
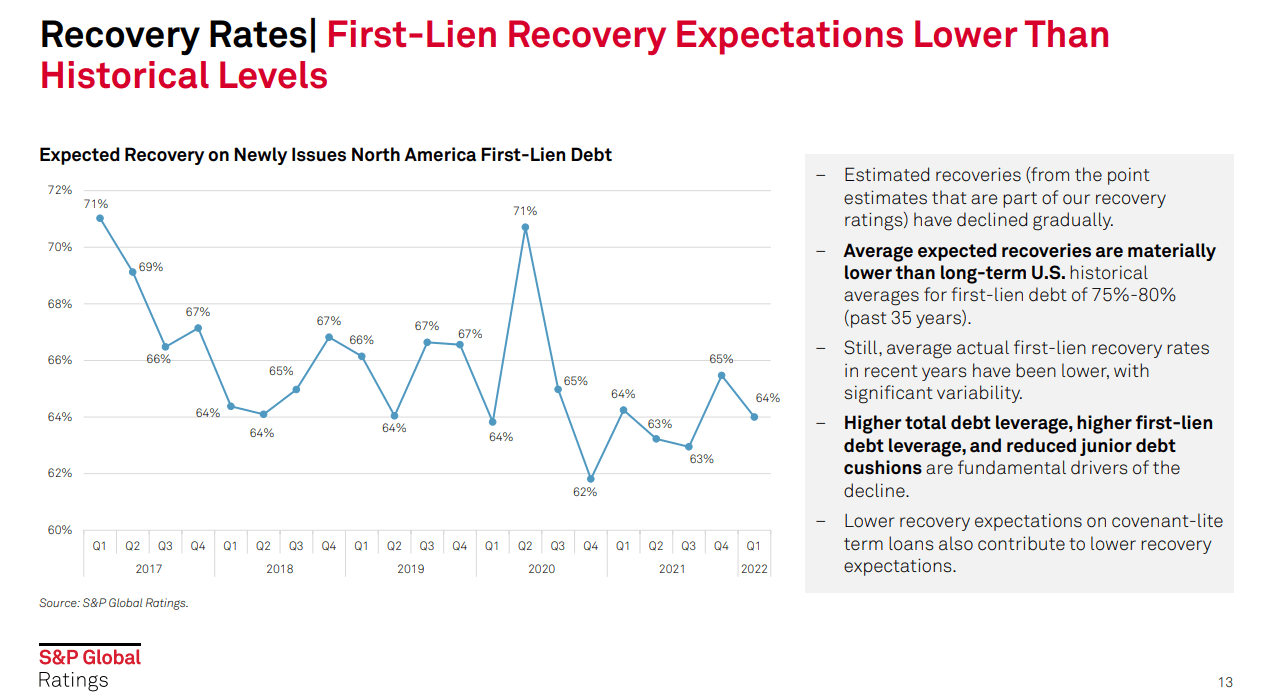
S&P Q2-2022
We are hence giving this a pass with a “hold” rating. We think EIC is the relatively safer option at the NAV level versus ECC and OXLC over the next 12-24 months though, as the CLO debt likely outperforms the CLO equity area. The three funds are currently at about the same premium to NAV and hence we can extrapolate EIC to be the relatively safest for price returns as well.
Please note that this is not financial advice. It may seem like it, sound like it, but surprisingly, it is not. Investors are expected to do their own due diligence and consult with a professional who knows their objectives and constraints.
Editor’s Note: This article discusses one or more securities that do not trade on a major U.S. exchange. Please be aware of the risks associated with these stocks.
Be the first to comment