da-kuk
iShares MSCI EAFE Value ETF (BATS:EFV) is an exchanged-traded fund that provides investors with exposure to mid- and large-cap stocks of companies based in Europe, Australia, Asia, and the Far East (i.e., “Developed Markets”, but excluding the United States and Canada).
The fund seeks to replicate the performance of its chosen benchmark index, the MSCI EAFE Value Index. EFV’s benchmark identifies stocks to include based on price/book ratios, 12-month forward earnings yields, and dividend yields. The fund carries an expense ratio of 0.35% and had net assets under management of $15.23 billion as of November 11, 2022, making the fund very popular.
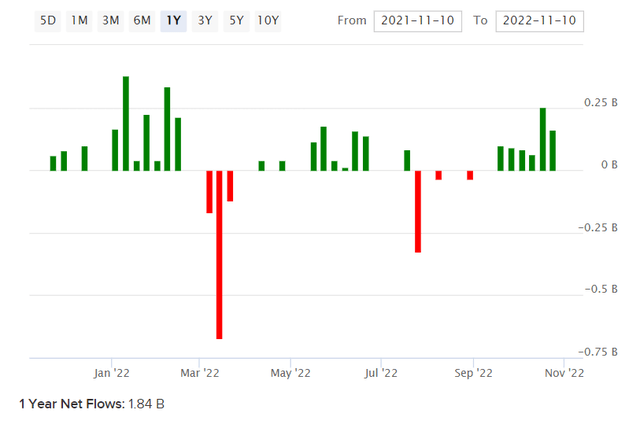
The chart below illustrates net fund flows for EFV over the past year or so. Evidently investors have been supporting the fund on balance, throughout most of 2022. Still, EFV has fallen in line with other equity funds and indices given risk-off moves this year; the price-only year-to-date return has been -11.70% through to the time of writing, as compared to the S&P 500 U.S. equity index’s descent of -16.75% over the same period.
So, the fund has actually out-performed U.S. stocks on average. My last article covering EFV was posted October 18, 2021, in which I was bullish on the basis of comparable undervaluation. Having said that, my timing was a little off, and the price-only change of -14.05% since then compares to the S&P 500’s move of -11.22%. Nevertheless, my view was that the fund’s underlying IRR potential was in the region of 10% over the next five years from then. With risk-off moves this year, this would suggest that the fund is even more undervalued, although of course changing portfolio composition, risk-free rates, equity risk premia, and earnings growth forecasts all affect implied value.
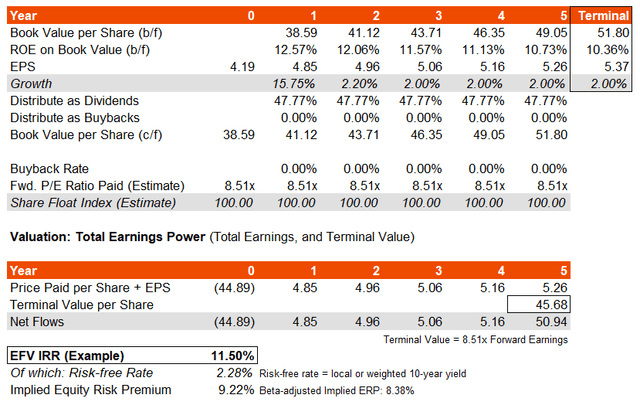
EFV’s portfolio is basically naturally driven toward “value stocks”. That does not mean stocks that are undervalued, but rather stocks priced at low price/book and price/earnings ratios. The fund’s benchmark’s index factsheet as of October 31, 2022 reports unsurprisingly low ratios: trailing and forward price/earnings ratios of 9.85x and 8.51x, respectively, with a price/book ratio of 1.07x (on average across the portfolio). The dividend yield of 4.85% would imply a dividend distribution rate of almost 50% (characteristically high for low-growth businesses, which are precisely the sorts of businesses that are assigned low earnings and book multiples). The underlying return on equity is a somewhat modest 12.57% on a forward basis.
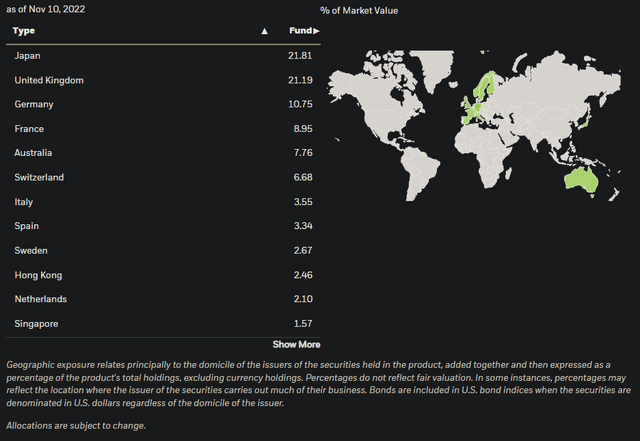
Assuming the return on equity falls to about 10% over the next few years, but fixing earnings growth at a minimum of 2%, would take our three- to five-year earnings growth estimate to 4.65-6.46%. That compares to a Morningstar consensus estimate of 8.30% at the time of writing. I am comfortable with assuming a lower underlying earnings growth rate for now. Before valuing the fund, I have also decided to build a weighted risk-free rate and weighted equity risk premium in line with the fund’s key geographic exposures, which (as illustrated below) include Japan (22% of the fund), the United Kingdom (21%), Germany (11%), France (9%), Australia (8%), and many others.
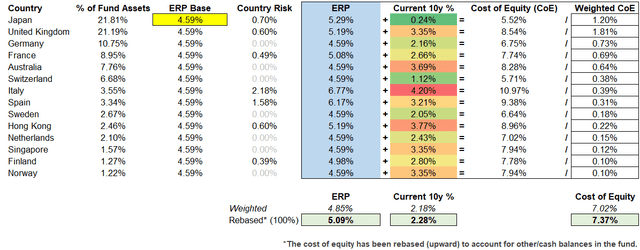
I calculate the fund’s weighted risk-free rate as being 2.28%, using 10-year bond yields, and using Professor Damodaran‘s workings for equity risk premia (including country risk premiums). The net result is a cost of equity of 7.37%.
Another way to calculate the equity risk premium component, on top of the weighted risk-free rate, would be to use EFV’s historical beta (in USD terms). The fund’s five-year beta is about 1.10x. Scaling our base ERP by 1.10x would take the ERP to 5.05%, which is about the same as my estimate above of 5.09% using country risk premiums.
Using my basic inputs and assumptions, I arrive at a model that would imply the potential for a forward long-term IRR of 11-12%, with an underlying equity risk premium of circa 9.22%, or 8.38% on a beta-adjusted basis. That is very high, implying under-valuation still, which follows my prior logic.
One caveat is that EFV is large and diversified, and the underlying ERP estimate (driven by forward earnings power) is helped by the fact that the fund’s largest exposure is Japan, which has very low local risk-free rates. Using a U.S. 10-year yield as the risk-free rate would take our implied ERP to 7.67%, or 6.97% adjusted for beta. That is still high, strengthening the case for under-valuation, but closer to the 4.2-5.5% range that I typically mention for mature equity markets.
We can assume EFV is still on the cheaper side, and handily the dividend distribution rate is quite high, so you get access to a lot of this forward IRR through actual cash generation. The fact that EFV carries a beta above 1.00x but has outperformed U.S. stocks this year even in spite of a strong U.S. dollar, helps to support the case that the market is adjusting EFV given its historical discounted price. Having said this, EFV is not cyclically attractive in any particular way; its portfolio is very balanced (see below).
Morningstar.com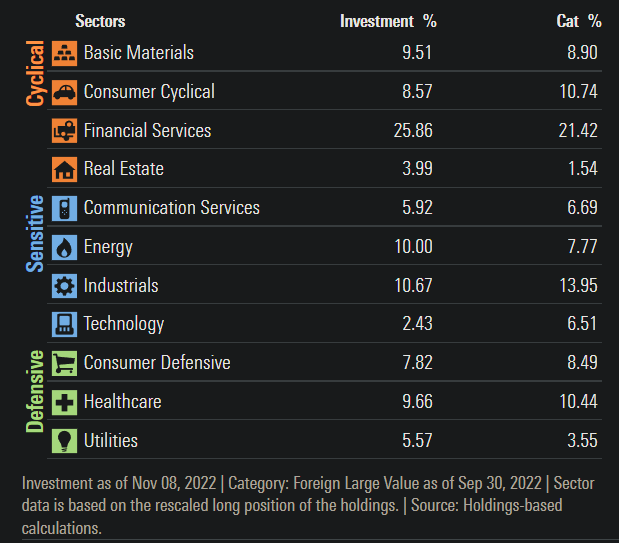
Therefore, I do not view EFV as a “trade idea” but more of an international diversification tool for more risk averse investors. The portfolio’s return on equity is modest and could tick down to 10% if we wanted to be a little conservative. The forward earnings yield is a little under 12%. Between these two figures, I would expect longer-term returns to fall in the 10-12% range. That is a good return, but a long-term hold for non-opportunistic investors, not an exciting play on a turn in the economic cycle.


Be the first to comment