

Alistair Berg
International developed market stocks have been on quite a tear. The iShares MSCI EAFE ETF (NYSEARCA:EFA) is still up nearly 30%, excluding dividends, from its October 2022 low even after a pullback off its year-to-date peak. The value trade’s comeback, along with a retreat in the U.S. dollar since September, has helped bring about a bullish view on this seemingly left-for-dead big group of global equities.
DXY Declines to 101 Support
StockCharts.com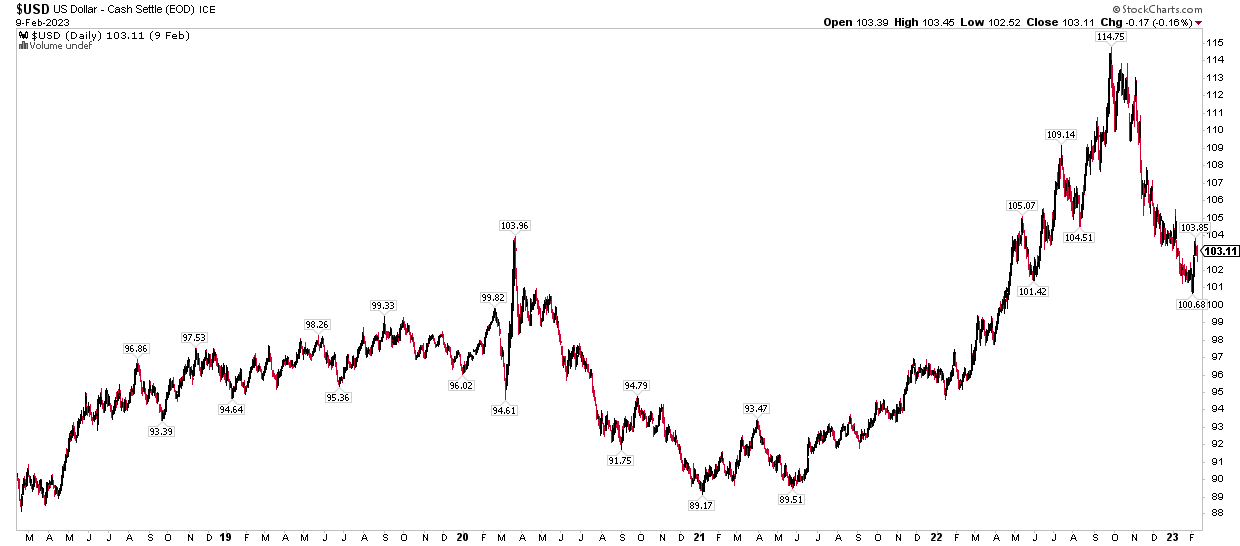
While many strategists and allocators have come around to the notion that now may be the time to finally re-position portfolios away from just large-cap U.S. stocks, there’s still uncertainty around key macro issues like the Russia/Ukraine situation and somewhat tepid growth prospects overall for foreign developed economies.
Ex-USA Still Quite Inexpensive
J.P. Morgan Asset Management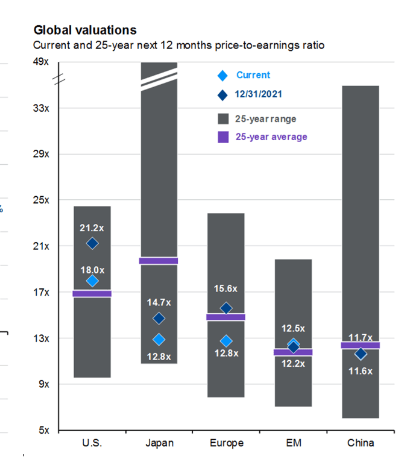
What everyone wants to know is if we are truly embarking on a new, prolonged regime of international stocks outpacing domestic names. History shows that these trends tend to last years, not just quarters. I’m generally on board with that narrative based on valuation and where investors are positioned. It contrasts with where things stood 15 years ago when folks were shying away from the S&P 500 to own high relative strength non-U.S. markets given the steep decline in the greenback and soaring energy prices driven by high global growth.
EAFE vs USA Outperformance Trends Over Time
J.P. Morgan Asset Management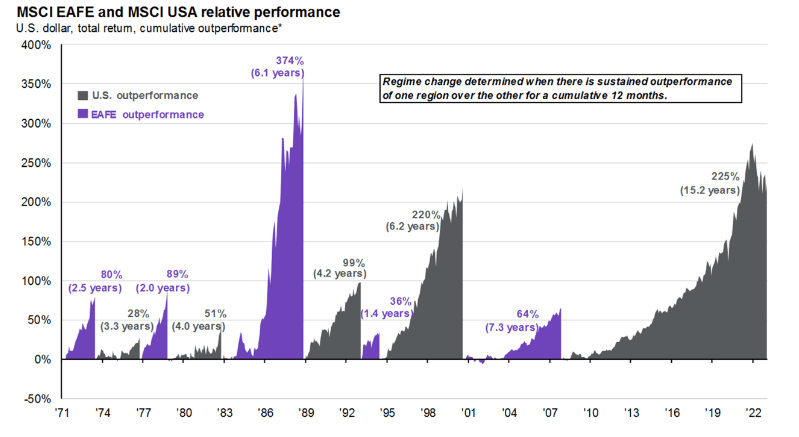
Digging into EFA itself, it’s an index fund that offers investors exposure to a broad range of companies in Europe, Australia, Asia, and the Far East, according to iShares. The fund seeks to track an index of large- and mid-sized equities in developed markets away from the U.S. and Canada. EFA can diversify a portfolio while offering long-term growth potential.
The ETF is liquid with a median 30-day bid/ask spread of just a single basis point and a 30-day average volume of nearly 20 million shares. EFA holds almost 800 stocks and features a yield near 2.5% – significantly higher than the dividend rate on the S&P 500. With a P/E ratio near 14 and a price-to-book ratio under 2.0, the fund is also cheaper than large-cap U.S. shares. Still, I urge investors to consider other cheaper alternatives since EFA will run you 0.33% annually in expenses. IEFA is a solid alternative.
What I like about non-U.S. markets is that they are generally more diversified as a whole compared to the S&P 500. Consider that the so-called “TMT” (tech/media/telecom) sectors effectively represent more than 40% of the SPX. Those growth sectors are just 20% or so (when including tech-driven consumer companies) in EFA. Value areas like Financials and Industrials are the top-2 sectors of the fund, so if we are indeed in a new regime less dependent on growth, then EFA should keep its alpha trend going.
EFA Sector Breakdown
iShares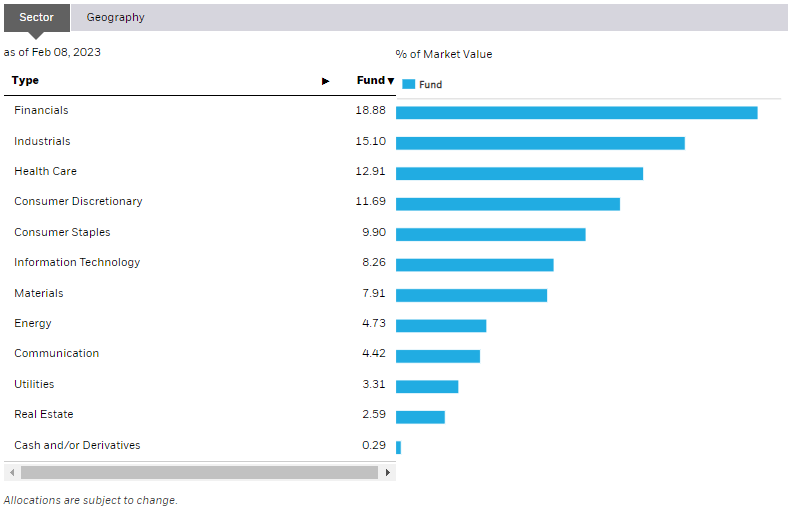
The Technical Take
With continued attractive valuations and diversification benefits to investors, how does the chart look? Notice in the graph below that EFA has broken its downtrend line that was in place from early 2022 through much of last year. With the price now solidly above the flattening 200-day moving average, I find the next possible point of trouble for the bulls would come near the 2021-range lows near $76, so there’s close to 10% more upside in the near term here.
On a pullback, look for support in the $66 to $67 range. What’s not encouraging for the bulls is that volume has been on the decline on this recent rally – I would like to see the price advance on more volume to confirm the uptrend. Still, the RSI momentum notched a fresh high along with the price in a recent rally – that’s a bullish confirmation. Overall, the technicals still look favorable.
EFA: Bullish Trend Reversal, $76 Resistance
StockCharts.com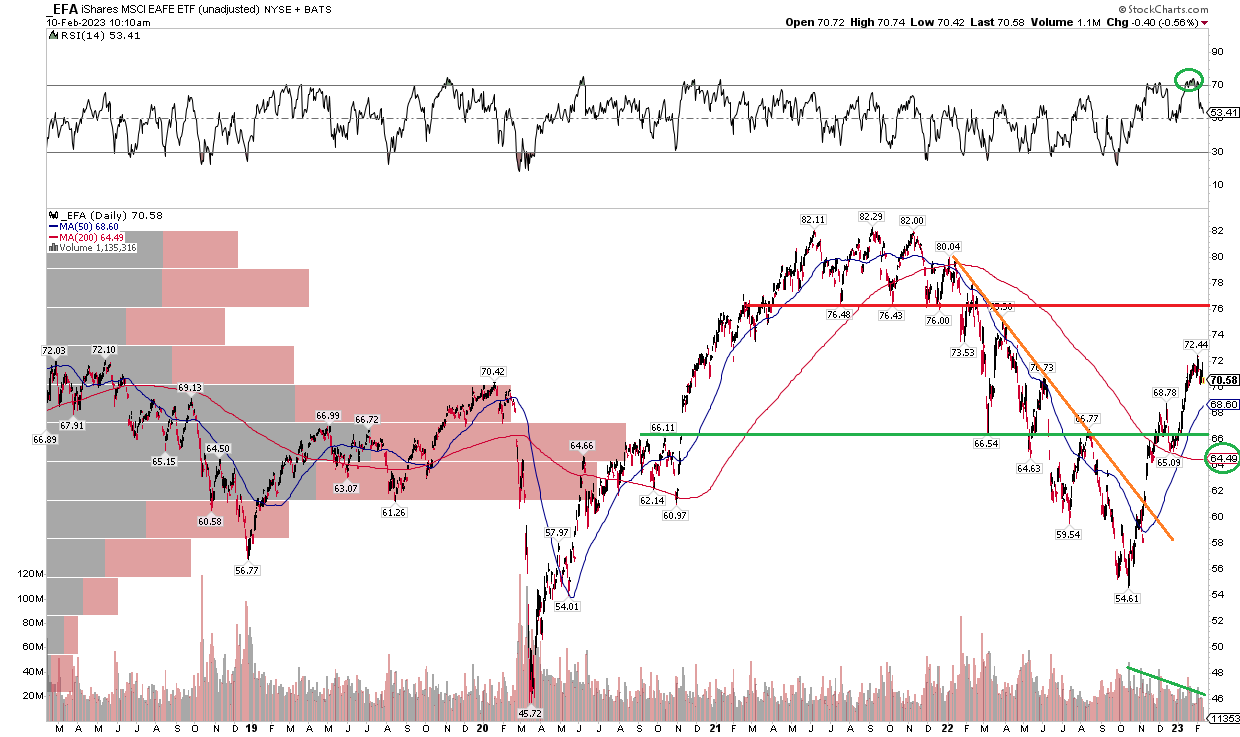
The Bottom Line
With a good valuation and decent technicals, I am a buy on EFA here. Look for possible resistance in the mid to upper $70s.
Be the first to comment