

akinbostanci/E+ via Getty Images
Written by Nick Ackerman, co-produced by Stanford Chemist. This article was originally published to members of the CEF/ETF Income Laboratory on December 2nd, 2022.
Ellsworth Fund (NYSE:ECF) has a portfolio heavily dedicated to convertible exposure. Common stock positions also make up a meaningful sleeve of their assets. ECF has been having a tough year, similar to most other investments.
With convertible securities, we’ve been seeing similar downside and volatility that we have been with equities. Convertibles have been performing worse than the overall market. This has to do with the fact that a lot of companies that issue convertibles rely on growth. And the expectation that their share prices will appreciate, making the convertible bond issued profitable for the holder.
When equity prices decline, they fall alongside them, but just like bonds, there is a face value that is expected to be paid out at maturity if the conversion doesn’t make sense. For that potential upside, investors receive a lower yield from the convertible bond.
During 2020 and 2021, convertibles were quite popular as rates were slashed to 0%. There were convertible bonds issued at 0% during this time. Meaning that the only upside would be from appreciation, if there were any.
Overall, ECF’s performance has been worse than both the market and the convertible space. One of the reasons for this is a widening discount; the other is that the fund is leveraged. That leads to the further downside when things are going against them. Of course, portfolio positioning is likely playing a role too.
We also see that net investment income, or NII, has slipped with the latest annual report. It wasn’t a significant amount on an absolute basis. Since the fund pays a managed distribution and it is very conservative, I don’t see a cut. However, it does mean that the fund is under more pressure to produce gains as income generation in the portfolio declined over the last year.
The Basics
- 1-Year Z-score: -1.39
- Discount: 14.16%
- Distribution Yield: 6.12%
- Expense Ratio: 0.95%
- Leverage: 30%
- Managed Assets: $182 million
- Structure: Perpetual
ECF’s objective is quite simple “…providing income and the potential for capital appreciation; which objectives the Fund considers to be relatively equal, over the long term, due to the nature of the securities in which it invests.” They attempt to achieve this by simply “primarily investing in convertible securities and common stocks.
The fund is quite small, and that brings its own risks. With smaller funds, daily trading volume tends to be lacking, and that can mean larger investors have a harder time entering or exiting a position.
At the same time, smaller funds generally have higher expense ratios. That isn’t the case with ECF, as it has a relatively low expense ratio for a closed-end fund.
The fund is leveraged. It wasn’t overly leveraged previously, but on July 1st, 2022, they issued another Series B 4.40% Cumulative Preferred Share series. This was to go with their already outstanding Series A 5.25% Preferred (ECF.PA).
ECF Assets (Gabelli)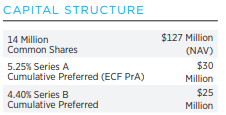
There are a couple of things to note with this leverage. First, it will add more costs. Anything they don’t earn over 4.40% would mean that common shareholders are net negative with this issuance.
At this point, with losses this year, that seems to be the case. It also hasn’t shown to provide any income upside as total investment income declined. Albeit, it was issued at the beginning of July, and their fiscal year-end is September 30th. They only had a quarter to reflect this new preferred issuance.
The second point that is a benefit for the fund is that this is fixed rate leverage. While other CEFs tend to rely on credit facilities with floating rates, this can be beneficial for ECF as their costs won’t rise.
Then the third point that I believe is important is that they raised this capital while things were depressed. That doesn’t mean that it ends up being a great time to buy, but I’m optimistic that 2022 will have proven to be a strong buying opportunity. At least that will be the case for longer-term investors that have years to invest and don’t have to watch this quarter to quarter.
Performance – Attractive Discount
The last article I published on ECF was an article comparing it to Gabelli Convertible & Income Securities Fund (GCV). I made the case that there was a clear choice to choose ECF over its cousin fund. The results have slightly favored ECF, but it definitely isn’t enough to take any victory lap. It is by a thin margin.
Ycharts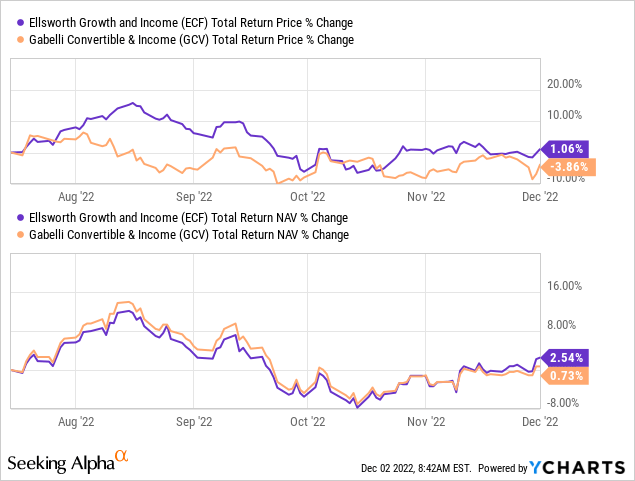
However, comparing the current ~14% discount of ECF to GCV’s premium of ~17% means there is still much more of this to play out. I would still be a seller of GCV today in favor of ECF.
Looking at the performance more broadly for the fund on a YTD basis, it would appear that ECF has been an underperformer. Below we can provide some context of ECF’s moves by looking at the SPDR S&P 500 (SPY) and iShares Convertible Bond ETF (ICVT).
We can see that ICVT has underperformed the broader U.S. market on its own, but ECF’s positioning and leverage seem to be playing to result in even deeper losses.
Ycharts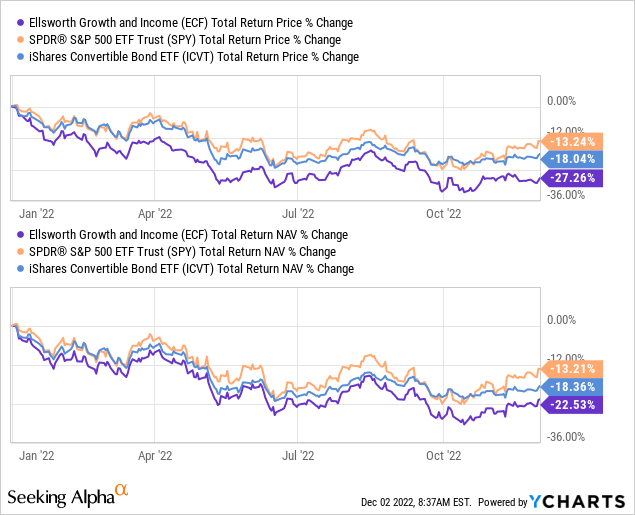
At the same time, the fund’s total share price return is weaker than its total NAV return. Therefore, we know the fund’s discount has been widening. Which I believe is the main attraction to the fund at this time. Compared to the last decade, the fund is trading at a wider discount.
It’s trading sharply lower than the premium it was flirting with just last year. Of course, that’s when convertibles were all the rage.
Ycharts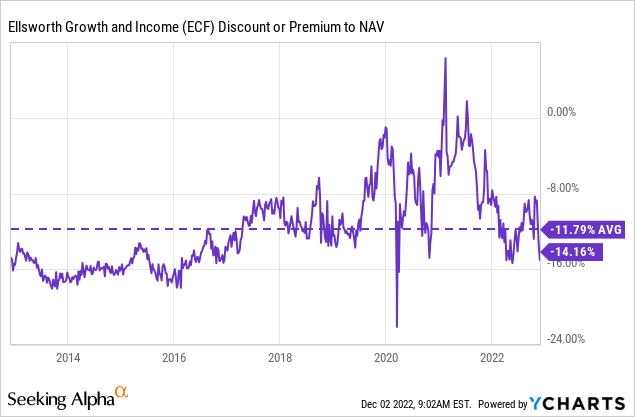
The fund’s discount is especially attractive when comparing it to several other convertible CEFs. Not only GCV but some of the Calamos funds as well, such as Calamos Convertible and High Income Fund (CHY) and Advent Claymore Convertible Securities and Income Fund (AVK).
Ycharts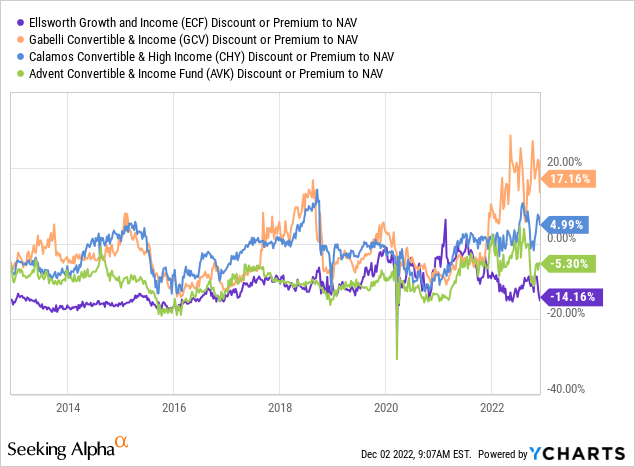
At the same time, it has been the best performing on a total NAV return basis in the last decade too. The big caveat here is that CHY and AVK mix in a sleeve of high yield and not equity positions with their convertibles, so they are not exactly the same. We know equities have performed incredibly well over the last decade, as most of it was in a bull market.
It isn’t quite an apple-to-oranges comparison, more like a Granny Smith to Honeycrisp apple comparison. Same fruit, but a slightly different taste.
Ycharts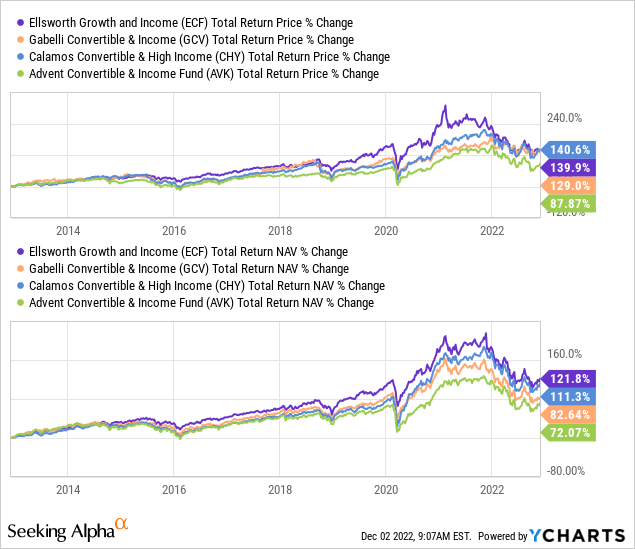
Distribution – Managed 5%
As mentioned previously, the fund pays a managed 5% distribution. This means that the actual distribution coverage really doesn’t matter in determining directly what the fund is paying. If it is being poorly covered and eroding capital, it does have an indirect impact by dragging the NAV down. However, at 5%, that’s really quite minimal and should be achievable for most investors.
To achieve the 5% minimum, if the fund is shy at the end of the year, they’ll pay out a year-end special. It is also important to note that this is only a minimum; it can be higher or lower when adjusting for the year-end. As they are a regulated investment company, to continue to qualify as a RIC, they have minimum payouts they need to meet to avoid paying taxes at the fund level.
ECF Distribution History (CEFConnect)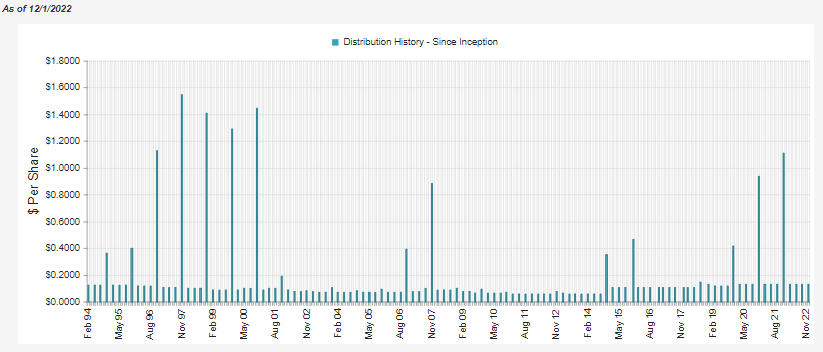
Given the current distribution rate on the NAV is 5.26%, we are above that minimum. The latest report also shows us that it wasn’t enough to support the distribution between NII and realized gains on the portfolio. Combining these two figures, the amount would come to around $6.086 million.
However, we can see that the fund paid $20,361,432 to investors in the last fiscal year. That includes the $0.98 special. That accounted for a significant $13.229 million based on the total outstanding shares outstanding at the end of September 30th, 2021. Factoring that out and the regular distributions should come to around $7.1 million. Against the amount of NII and capital gains, still a shortfall.
ECF Annual Report (Gabelli)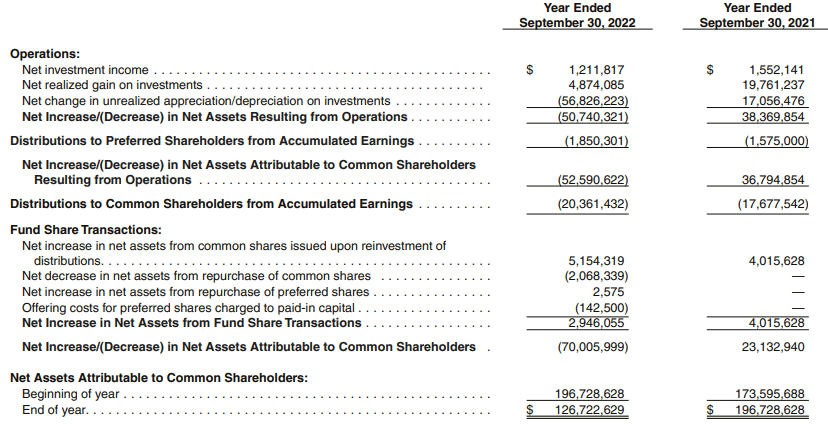
That could mean there is no special or a very minimal year-end special paid for this year. It has historically been announced in mid-November, so with only the regular $0.13 quarterly announced, it’s all but confirmed this is the case. I believe that is a good thing, as they can retain these assets to rebound when that happens.
Tax And CEFConnect Discussion
Here is an interesting point that can be brought up about taxes and CEFs. As we saw above, the fund didn’t earn enough NII or realized gains for the year to cover the distributions of $20,361,432 for investors.
Again, even when factoring out the special paid last year, the “coverage” wasn’t there. Yet, at the end of the fiscal year, they are classifying the distributions as all ordinary income or long-term capital gains.
ECF Tax Breakdown (Gabelli)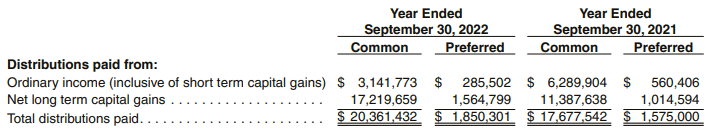
I think this is important to continue to point out that tax classifications do not equal distribution coverage for a closed-end fund. It can be close and often somewhat resemble the earnings of the underlying fund, but not always.
Confusion most often comes up when return of capital is characterized. Some investors think it is black and white; ROC = bad, and no ROC = good. Here’s a situation where ECF didn’t cover its distribution. Yet, there was still no ROC classified.
For a more thorough breakdown of their 2021 distribution classifications. Here we can see the portion that is income and short-term capital gains. For tax purposes, these get lumped together as it is the same tax rate.
ECF Tax Breakdown 2021 (Gabelli)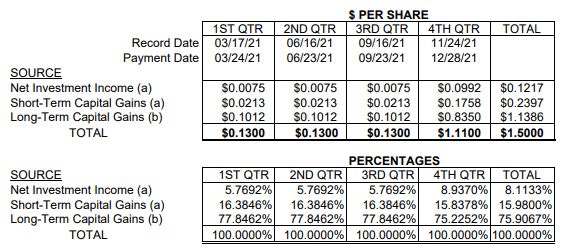
They list that 24.08% of the ordinary income is classified as qualified dividends, which means a reduced tax burden.
I’ll even take the opportunity to discuss one step further why looking at CEFConnect for the tax classifications isn’t great. I’ve pointed this out in the past, too.
Everything is listed as income if we look at the distribution classifications on CEFConnect for ECF. Well, we can clearly see from the official tax notice from the fund sponsor themselves that this is simply not true.
Highlighting Incorrect Distribution Breakdown for ECF (CEFConnect)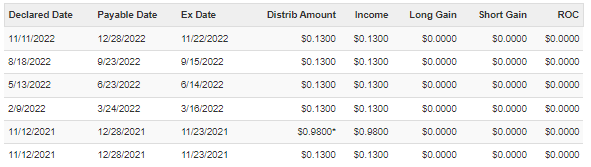
CEFConnect is a great resource for getting a feel for surface-level data. But we always need to go to official fund sources for any final determination.
This brings up another point; they also don’t have the new Series B Preferred that ECF issued reflected in their leverage either.
Showing Incorrect Leverage for ECF (CEFConnect)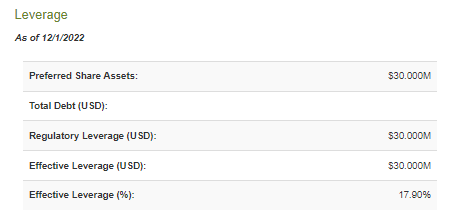
So while a person could stumble on this fund and think they are still utilizing a shallow amount of leverage, they might be shocked to find out that it is nearly double.
ECF’s Portfolio
At the end of September 30th, 2022, they listed a 62.6% weight in convertible corporate bonds. This was followed by 19.5% in common stocks and the remainder in other preferred and convertible securities making up another 4.6%.
However, another large piece of their pie is allocated to U.S. Government obligations at 13.3%. In particular, these are U.S. T-Bills earning between 2.272% and 3.297%. This makes up the second-largest allocation in terms of sector weighting of the fund at the end of the fiscal year.
ECF Industry Weighting (Gabelli)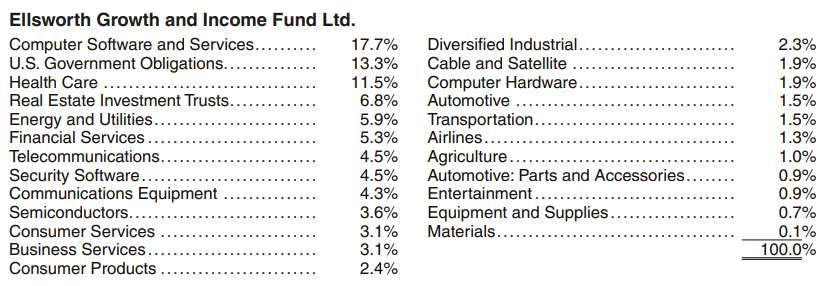
Essentially, this is a cash position, and thankfully, these cash positions pay something these days. Because the first thing I think of is $24.2 million is allocated to ‘cash,’ and they are paying 4.4% on a Series B they just issued. That math still doesn’t work out, but if they are waiting for a more opportune time to put this capital to work, then that is something I can understand.
Last year at the end of the fiscal year, they held 3.5% in T-Bills yielding between 0.014% and 0.054%. Earlier this year, at the end of March 31st, 2022, their portfolio held a 2.7% allocation to T-Bills. At that time, the rates were between 0.105% and 0.397%. That really helps provide some context on how much rates have risen in six months.
Anyway, the main point is all this helps indicate they aren’t going to be sitting in cash forever. Two months have already gone by as well. They could have put this to work already. It also could have simply been they were in transition at the reporting date.
When looking at the largest holdings, we see several well-known names. A couple of oddball things, but being under the Gabelli umbrella, that seems normal. Not to mention that convertible bonds are a bit of oddball security, too, so seeing some unusual names shouldn’t come as a shock.
ECF Top Ten (Gabelli)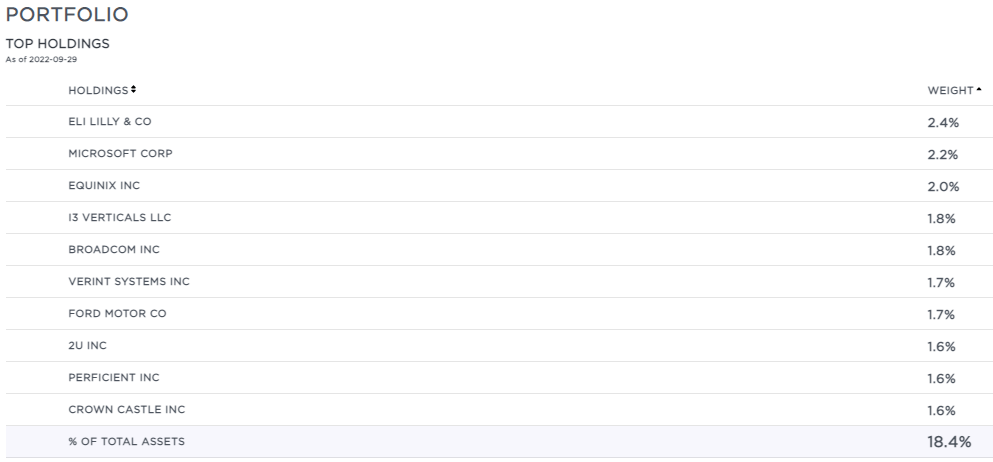
The top ten make up a fairly sizeable 18.4%, but I’d say that’s overall pretty well diversified. The largest three positions are well-known and financially stable companies/REIT.
i3 Verticals (IIIV), while being a very small company at around a market cap of $870.65 million, is producing positive earnings. They are in the tech sector and help small and medium-sized businesses with payments and software solutions.
The Eli Lilly (LLY), Microsoft (MSFT), and Equinix (EQIX) positions are holdings in the common shares of these companies.
When we get to IIIV, that represents one of the convertible bonds in the portfolio. It has a 1% yield and matures on February 15th, 2025. At the end of September, it is underwater, costing $3,013,687 and a market value of $2,663,194. The principal amount is $3,090,000.
So if they hold this position until 2025, they will see an upside in this position. This assumes that the company doesn’t go bust and can meet its obligation. They also bought it at a discount to the face value. Not a very large discount, but a discount, nonetheless. In a sense, we have ECF trading at a discount, and then some of its underlying holdings are also being carried at a discount from their face value too.
At the same time, the 1% represents the yield they can collect while waiting until it matures or makes sense to convert. It helps provide the context of just how little some convertible bonds can pay – which was especially true in the last couple of years.
Conclusion
ECF is attractively valued at a deep discount. The fund’s minimal yield likely keeps some investors away. However, it has been a strong performer over the long-term relative to peers. The NII in the last fiscal year slipped, even as they added more leverage. The added leverage was added in the latter half of the fiscal year, so it didn’t necessarily have time to kick in yet.
At the same time, they were carrying a significant position in U.S. T-Bills. While they pay something these days, it still wasn’t enough to cover the yield of the capital they just raised on their Series B Preferred of 4.4%. Assuming they can put this capital to work in some opportunities while prices are depressed, this isn’t necessarily a bad situation to be in. Yields are up, so NII could rise from current levels as they put it to work.
Be the first to comment