

anusorn nakdee
I am assigning Eastman Chemical Company (NYSE:EMN) a positive risk/reward rating based on the likelihood of it surpassing consensus earnings estimates through mid-decade, its deeply discounted valuation, and its well-above-average income growth potential. Finally, the high quality of Eastman’s business may be undervalued by the market, opening the door to additional multiple expansion opportunity.
Risk/Reward Rating: Positive
Eastman Chemical performed extraordinarily well following the bursting of the 2000 valuation and technology bubble. From the bottom in April 2003 near $15 to the cycle peak near $90 in June 2014, the annualized rate of return was roughly 18% before dividends. Of note, the dividend yield is an above-average 3.4% today alongside an active share buyback plan. In comparison, the S&P 500 (NYSE:SPY) returned 7% per year over the eleven-year Eastman upcycle. The following 20-year monthly chart captures this period and the subsequent stagnation of Eastman’s shares from 2014 through today.
Eastman Chemical 20-year monthly chart (Created by Brian Kapp using a chart from Barchart.com )
Since 2014, Eastman shares remain largely unchanged near the current price of $89. A similar period coincided with the late 1990’s technology and valuation bubble. Eastman shares were in a stagnant-to-bear market trend throughout the late 1990’s bubble until the bottom in April 2003. This prior period of underperformance lasted approximately seven years, from Q1 1996 through April 2003.
Growth Potential
The factors which led to the eleven years of outperformance beginning in April 2003 are largely present today. A similar bubble dynamic was at work into the recent speculative market peak in April 2021. At 9x the 2022 consensus earnings estimate, Eastman is trading at a deep discount to the general market indices, which are valued in the mid-20s PE range. Finally, forward growth expectations are quite low compared to the general economy and Eastman’s growth plans, opening the door to upside surprises.
The following table displays the consensus growth estimates for Eastman into mid-decade and its valuation at each estimate. The data was compiled from Seeking Alpha. The upper section of the table displays consensus earnings growth estimates while the lower portion of the table displays the same for sales. I have highlighted in blue the annual earnings growth estimates and in yellow the sales growth estimates.
Source: Seeking Alpha. Created by Brian Kapp, stoxdox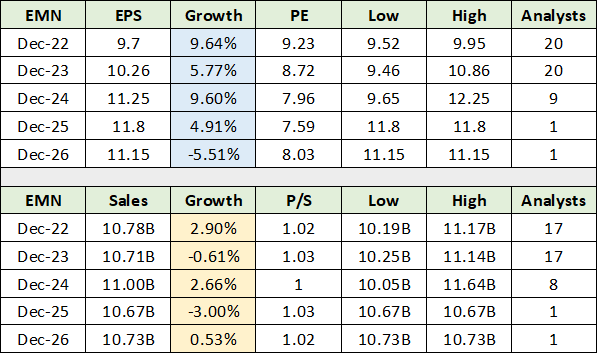
Beginning with consensus earnings growth estimates, the annual growth rate for the five years through 2026 is expected to be approximately 5%. The following image from Eastman’s December 2021 Investor Day Presentation points toward material upside surprise potential. All slides herein are from the same presentation unless otherwise noted.
Source: Eastman Chemical’s December 2021 Investor Day Presentation
Notice that Eastman is forecasting earnings growth of 8% to 12% annually through 2024, the first three years of the five-year consensus estimate period above. Consensus earnings growth estimates are roughly half of what the company is projecting.
Turning to sales (the yellow highlighted cells above), consensus sales growth estimates call for 0.4% per year, or roughly flat through 2026. Similar to the earnings estimates, consensus sales growth estimates appear quite low in relation to Eastman’s current growth projects and potential.
Circular Economy and GHG Reduction
Eastman Chemical has exceptional growth opportunities, especially for a specialty chemical manufacturer in the materials sector. The circular economy and greenhouse gas emission reductions are strong secular growth drivers. The following slides provide some color around Eastman’s active growth projects and large growth opportunity set, while the first slide sets the table for the circular opportunity.
Source: Eastman Chemical’s December 2021 Investor Day Presentation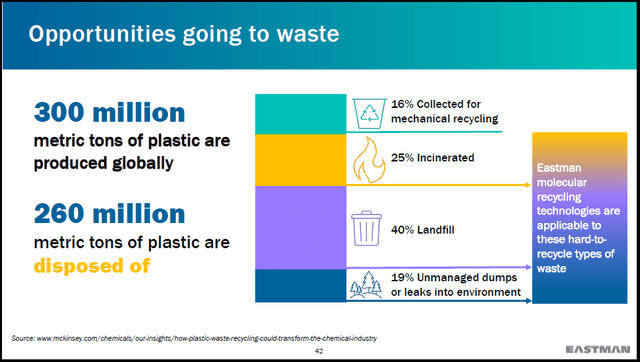
The images of plastic waste filling landfills and contaminating the ocean and waterways are familiar to us all and represent a global problem. Notice in the above slide that 260 million tons of plastic are added to waste each year, which equals roughly 87% of all plastic produced annually.
Eastman is solving the waste problem by enabling the recycling of the 85% of plastic waste which is not easily recyclable. Global policies are highly supportive of this growth vector as recycling reduces GHG emissions by 20% to 50%, depending on the application. The policy backdrop is creating meaningful growth opportunities for Eastman as can be seen on the following two slides.
Source: Eastman Chemical’s December 2021 Investor Day Presentation Source: Eastman Chemical’s December 2021 Investor Day Presentation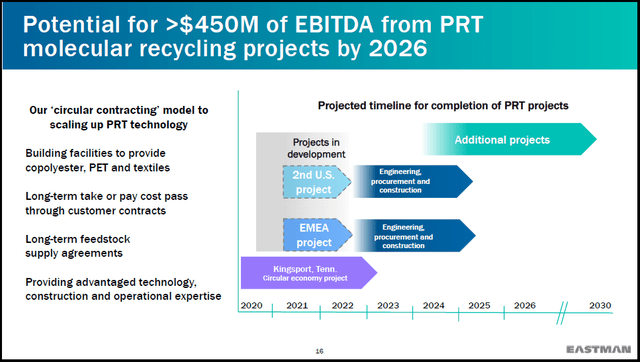
Eastman has a hand full of circular growth projects underway which are summarized in the above slides. They are projected to add $650 million of annual EBITDA in the mid-decade timeframe. I estimate that Eastman’s EBITDA will be roughly $2.2 billion in 2022. My estimates are summarized in the table below using data from Eastman’s Q2 2022 Earnings Presentation and Q4 2021 Earnings Presentation.
Created by Brian Kapp, stoxdox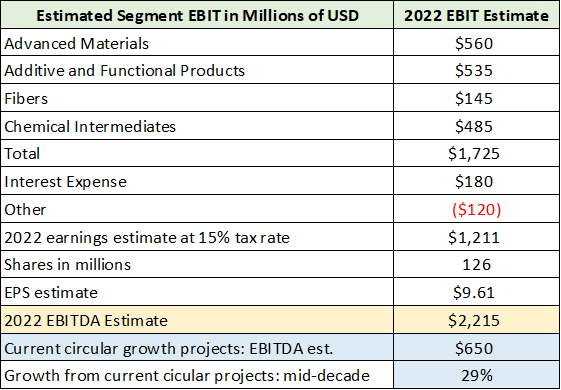
I have highlighted in blue the EBITDA growth estimate from the handful of existing circular projects and the 2022 EBITDA estimate is highlighted in yellow. As a result, the current handful of projects summarized in the above slides could add 5.4% to Eastman’s annual earnings growth rate and roughly the same to its sales growth rate into mid-decade. These growth projects represent total growth opportunities of 29% compared to Eastman’s current size.
Secular Growth
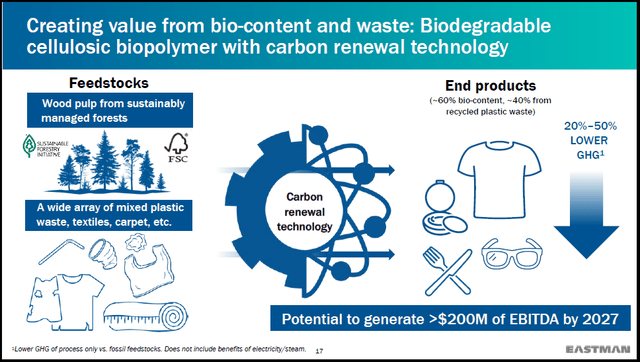
In fact, emissions reduction is one of the greatest secular growth opportunities of the coming decade and has an exceedingly high probability of materializing. No matter one’s beliefs in regard to these global policies, they are set in motion as can be seen in the following two images.
Source: Eastman Chemical’s December 2021 Investor Day Presentation Source: Eastman Chemical’s December 2021 Investor Day Presentation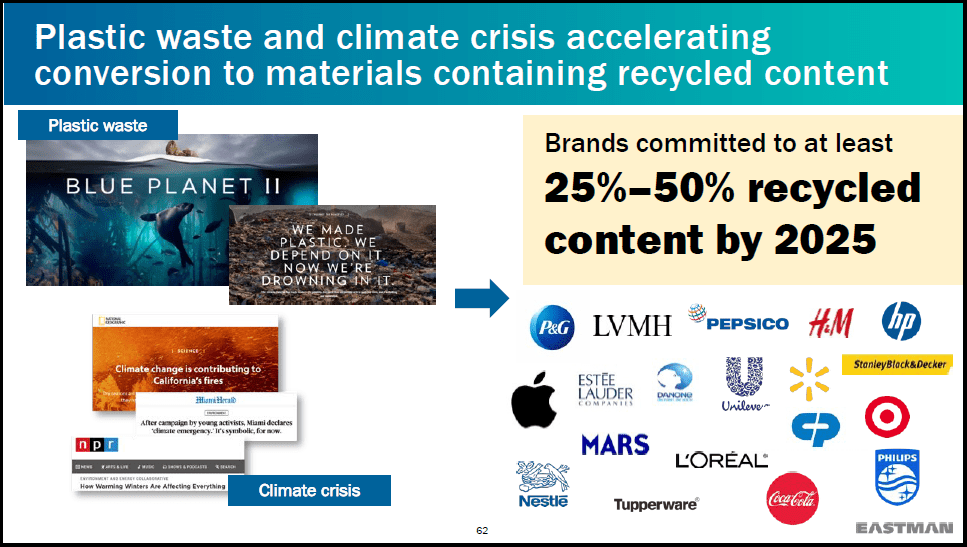
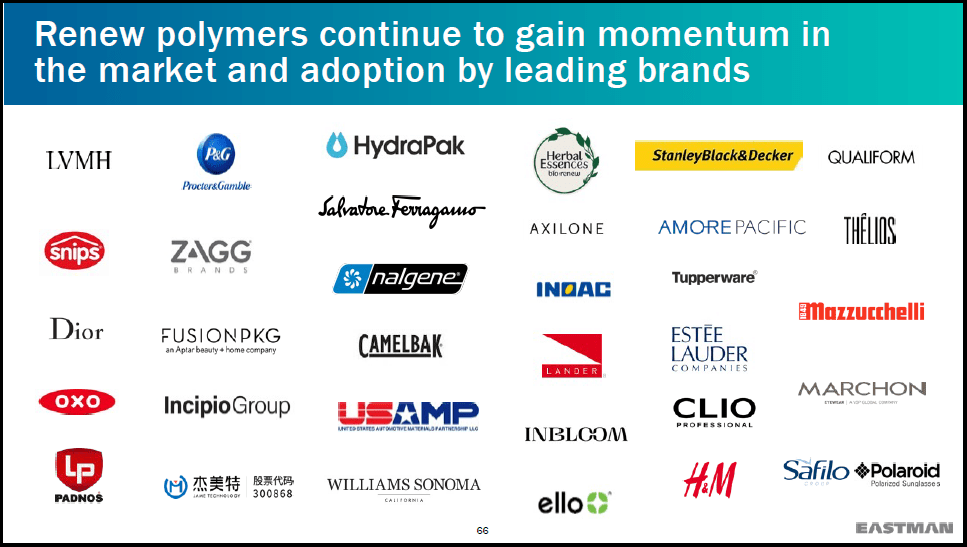
Most global brands are fully committed to GHG emissions reduction as it is now a requirement for corporate survival. Eastman Chemical stands out as a primary beneficiary of this secular growth trend. The growth potential from the recycling or the circular growth vector alone is extraordinary.
For example, Eastman is building a manufacturing plant in Tennessee that will have the capacity to recycle over 110,000 tons of waste annually. Globally, there is roughly 260 million tons of plastic waste per year. This one facility, using rough numbers, will process 0.04% of global plastic waste while targeting approximately $64 million of earnings at a 15% profit margin.
There is room for up to 2,364 of such facilities at a 100% recycling rate. While 100% is not realistic, a large percentage of plastic is likely to be recycled as time progresses and GHG emissions reduction targets come into effect. Theoretically, 19 such facilities could double Eastman’s earnings power while penetrating just 0.8% of the total recycling opportunity. This is just one growth vector.
Growth Strategy
With consensus sales estimates calling for stagnation into mid-decade and earnings growth of roughly 5% per year, there appears to be a substantial opportunity for Eastman to surpass consensus estimates. Eastman is implementing a four-pronged growth strategy for which the circular growth opportunities discussed above comprise one leg. The four prongs are: secular growth in the circular economy, organic growth opportunities, bolt-on acquisitions, and significant capital return to shareholders.
Organic Growth Opportunities
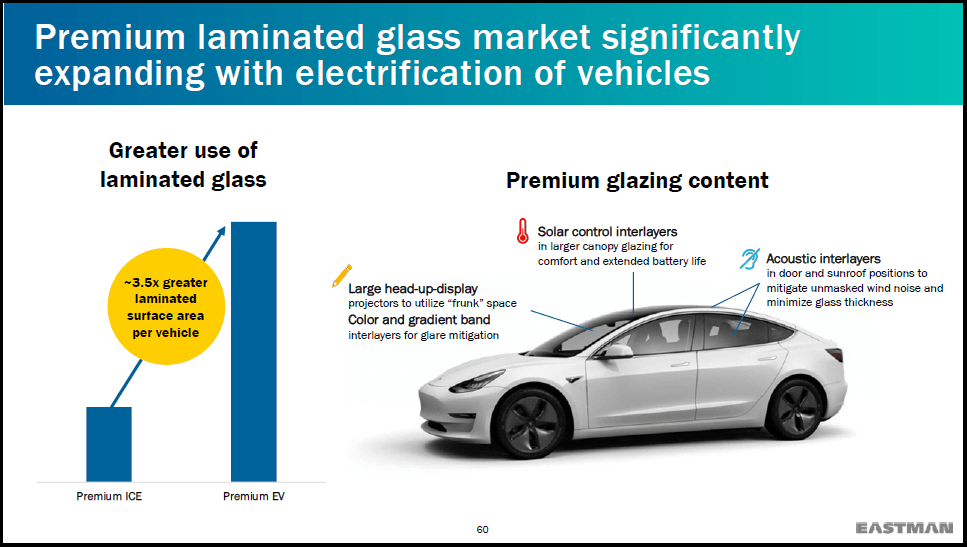
In addition to the secular growth opportunity in recycling, Eastman has a robust organic growth opportunity set. For example, in the company’s Advanced Materials segment, the energy transition and EVs in particular are driving substantial new growth potential. The transportation sector is the largest revenue contributor to the Advanced Materials business segment at 32% of sales. The following two slides offer a sampling of the organic growth opportunities in the transportation sector.
Source: Eastman Chemical’s December 2021 Investor Day Presentation Source: Eastman Chemical’s December 2021 Investor Day Presentation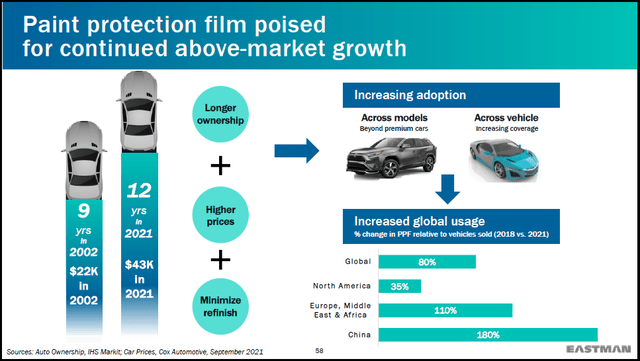
Like the transportation sector, growth opportunities for materials science are robust across most industries. The cosmetics industry is an excellent case in point. Similar to the general waste problems that Eastman solves, there are unique waste reduction opportunities in the cosmetics industry. Here, microplastics or microbeads are being banned across the globe. The following slide summarizes the opportunity.
Source: Eastman Chemical’s December 2021 Investor Day Presentation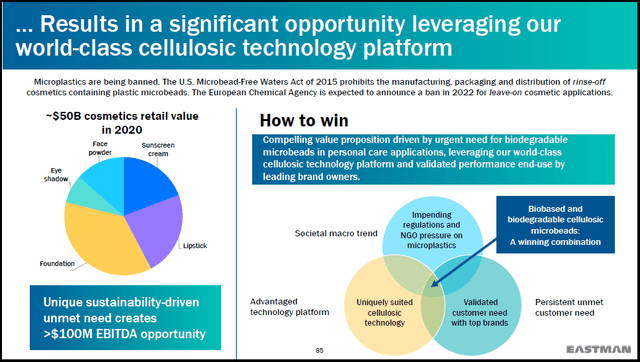
Eastman estimates a $100 million EBITDA opportunity in solving the microplastics problem. When added to the $650 million EBITDA circular growth opportunity discussed previously, total visible growth into mid-decade is near 34% for Eastman.
The agriculture and livestock industries provide a glimpse into the truly broad nature of Eastman’s growth opportunities. With global food insecurity increasingly front-page news, these businesses are robust today and offer strong growth outlooks. The following two slides offer insight into the agriculture and livestock opportunity set.
Source: Eastman Chemical’s December 2021 Investor Day Presentation Source: Eastman Chemical’s December 2021 Investor Day Presentation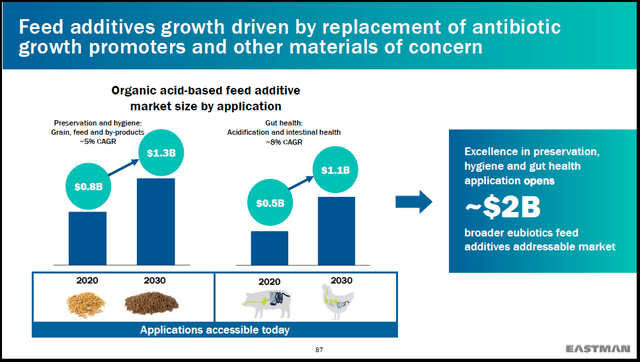
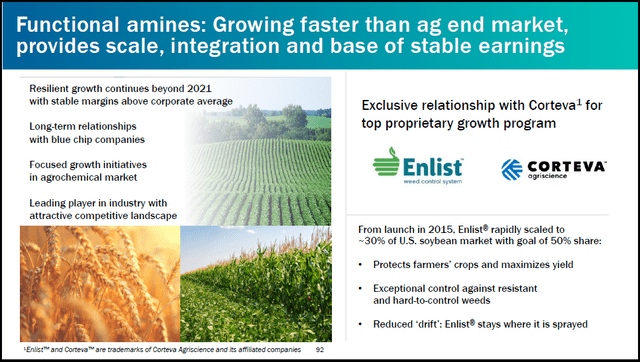
With global food supply being stressed, Eastman should have above-average growth opportunities well into the future.
More generally, Eastman is finding exceptional growth opportunities for its premium offerings. Essentially, the company is finding success in applying its technology platform to a rapidly growing set of opportunities. As a result, Eastman’s product mix strategy is a material organic growth driver.
The heightened growth potential from Eastman’s product mix upgrade strategy is summarized in the following slide. On the left, the underlying end-market growth rates are displayed for key industries, which look to remain quite healthy. In the middle, notice that Eastman projects 2x more sales volume potential for its premium products at an average price that is 3x that of the general industry.
Source: Eastman Chemical’s December 2021 Investor Day Presentation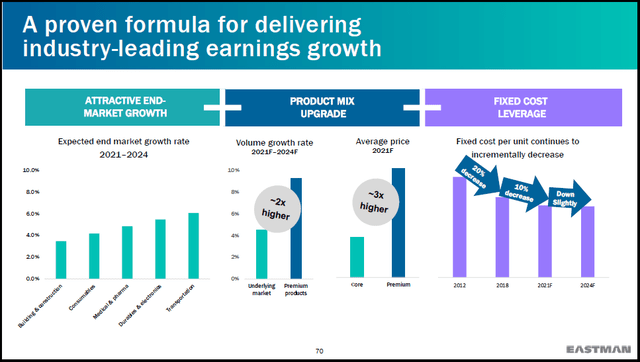
This is a recipe for above-average sales growth and margin expansion, which could amplify Eastman’s earnings growth potential. When the robust organic growth opportunities are combined with the secular growth opportunity in the circular economy, Eastman’s growth profile begins to look exceptional.
The company’s projection of 8% to 12% annual earnings growth through 2024 appears to be achievable. Consensus estimates calling for stagnating sales and roughly 5% earnings growth through mid-decade look exceedingly conservative in light of the above review. Eastman offers an opportunity for material upside earnings surprises into mid-decade, opening the door to enhanced return potential for the shares.
Shareholder Capital Returns
Adding further upside leverage is Eastman’s capital return program. In addition to the current 3.4% dividend yield, the company plans to repurchase $1 billion of its shares over the near term, as can be seen in the following slide.
Source: Eastman Chemical’s December 2021 Investor Day Presentation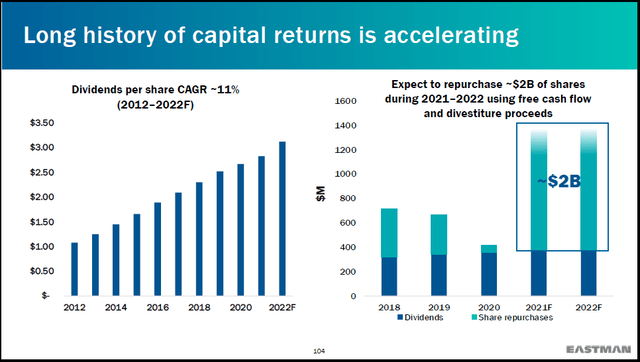
Notice the consistent dividend growth track record displayed on the left-hand side. The dividend payment offers substantial income growth potential as the payout is mild, near 34% currently. At today’s share price near $89, a $1 billion share repurchase program would add an additional 6% capital return via a reduced share count.
Eastman’s substantial cash flow generation, at roughly $1.5 billion per year, enables it to implement a strong capital return program in parallel with a robust growth capital strategy. The absolute level of Eastman’s growth capital strategy has reached a step change higher compared to recent years. This can be seen when comparing the light-blue shaded regions below.
Source: Eastman Chemical’s December 2021 Investor Day Presentation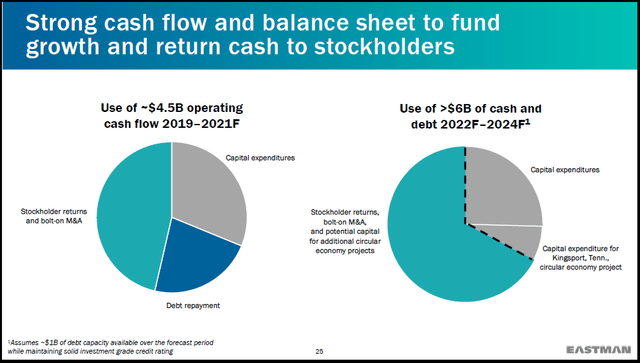
While making room for bolt-on acquisitions, I estimate that Eastman could generate excess cash in the $500 million per year range in the near term, after paying the 3.4% dividend. The company has an exceptional income growth profile as a result.
A Highly Diversified Business
The Eastman investment case receives a material boost from the diversification of its business mix. The following two images provide a breakdown by industry and product line for two of Eastman’s four primary business segments. The key data is summarized in the pie charts on the right-hand side of each slide. The key takeaway is that Eastman has an incredibly diversified business mix.
Source: Eastman Chemical’s December 2021 Investor Day Presentation Source: Eastman Chemical’s December 2021 Investor Day Presentation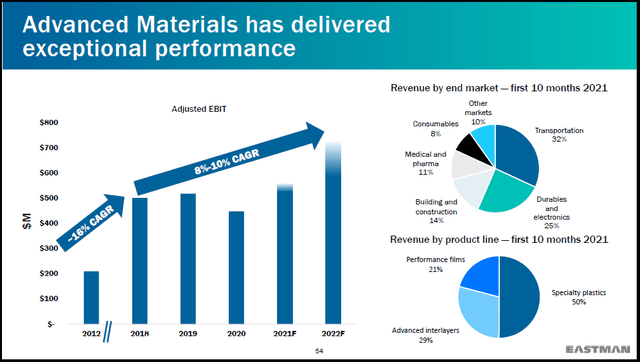
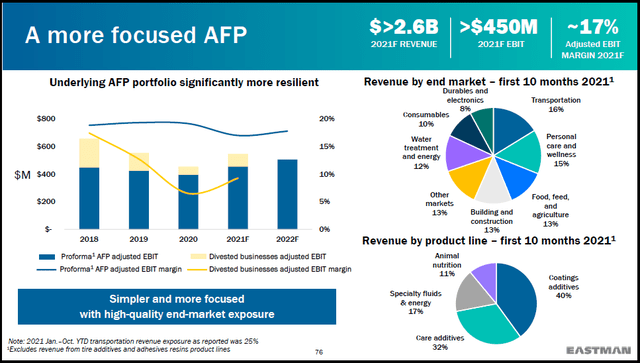
In addition to the above, the broad textiles industry is served by Eastman’s Fibers segment, and the Chemicals Intermediates segment offers agricultural and livestock diversification. Eastman Chemical ranks amongst the more diversified companies in the world, thereby fundamentally reducing the risk level and increasing Eastman’s overall safety.
Valuation and Upside Potential
With the Eastman investment case looking quite attractive, it is worthwhile to turn to the valuation and begin to estimate the potential return spectrum. In the following two tables, I compare consensus earnings and sales estimates for Eastman to those for DuPont (NYSE:DD). DuPont serves as a high-quality comparable as both companies are in the Specialty Chemicals industry within the Materials sector. I have highlighted in blue Eastman’s valuation in relation to earnings and sales, and in yellow DuPont’s.
Source: Seeking Alpha. Created by Brian Kapp, stoxdox Source: Seeking Alpha. Created by Brian Kapp, stoxdox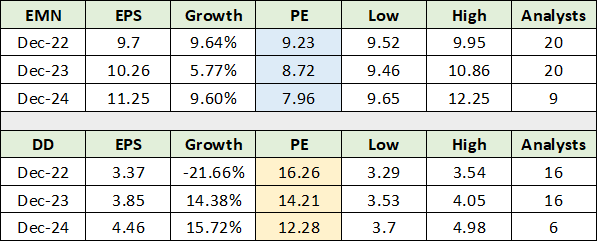
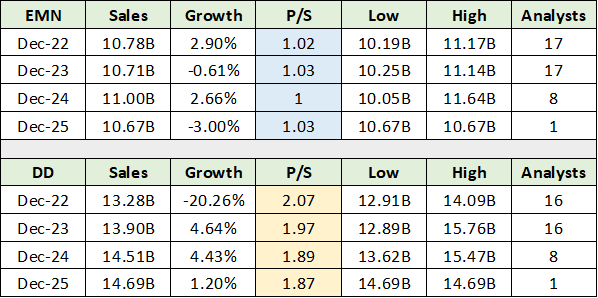
Notice that Eastman is valued at half the multiple of sales compared to DuPont’s valuation, or 1x sales compared to 2x sales. This valuation dispersion appears extreme given the similar margin profiles of Eastman and DuPont. For example, DuPont’s EBITDA margin is roughly 25% compared to Eastman’s target of 23%. The difference is largely immaterial while Eastman’s margins are trending higher with its premium product mix strategy.
On the earnings front, Eastman trades at a similar deep discount to DuPont as was the case when viewing the valuation multiple on sales. Eastman is trading at 9x the 2022 consensus earnings estimate compared to DuPont trading at 16x. Given the similar margin and growth profiles, this valuation discrepancy looks to be quite extreme.
The perceived safety of DuPont, with a history as a blue-chip stock, accounts for much of its valuation premium in relation to Eastman. While a quality difference between the two companies existed in the past, this gap looks to be largely in the rearview mirror. This is especially the case in light of Eastman’s broad diversification and enhanced safety level discussed above. In fact, the credit ratings for each company are nearly identical in the BBB to BBB+ investment grade range.
Given the similarity between the two companies, the question becomes whether Eastman can trade at a similar mid-teen valuation multiple as is the case for DuPont currently?
There is historical precedence for this. For example, during the final three years of Eastman’s outperformance into the 2014 peak, the company traded at an average PE multiple of 18x earnings. Interestingly, this is also Eastman’s average PE multiple over the past five years which is highlighted in yellow in the valuation table below. The data was compiled from Seeking Alpha.
Source: Seeking Alpha. Created by Brian Kapp, stoxdox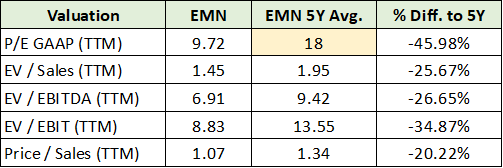
There is ample historical evidence for Eastman to trade at a mid-teen valuation multiple, similar to DuPont today. This also happens to be a historically normal valuation multiple for stocks broadly. Applying a 16x multiple to the consensus earnings estimates for Eastman into mid-decade results in a price target range of $150 to $190. This range represents upside appreciation potential of 69% to 113%.
Given the likelihood of Eastman surpassing earnings estimates into mid-decade, there is additional upside potential to this target range. For example, if the company can grow earnings at 10% per year into mid-decade, the upside return potential into mid-decade at 16x earnings is 155%. Given the robust set of growth opportunities and the company’s capital return strategy, there remains additional upside potential.
Technicals
The technical backdrop for Eastman is one of long-term support within a secular uptrend. The secular uptrend is visible on the 20-year monthly chart below and is delineated by the diagonal green line. Please keep in mind that the shares have been stagnant since 2014, which has reduced the upward slope of the long-term trendline.
Eastman Chemical 20-year monthly chart (Created by Brian Kapp using a chart from Barchart.com )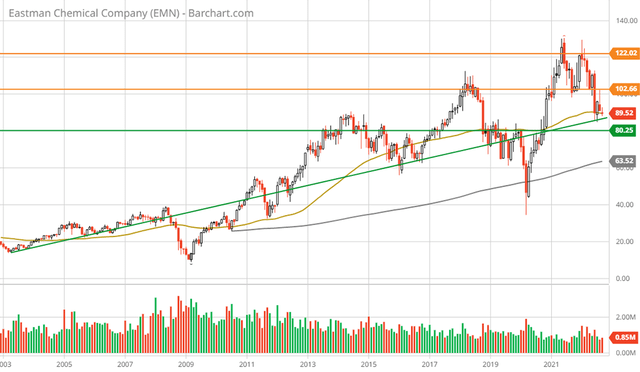
The orange lines represent key resistance levels and the green lines represent the primary support zone. Eastman is currently sitting on the green uptrend line and is 10% above the primary support zone near $80. The following 5-year weekly chart provides a closer look at the strong support nearby for Eastman’s shares.
Eastman Chemical 5-year weekly chart (Created by Brian Kapp using a chart from Barchart.com )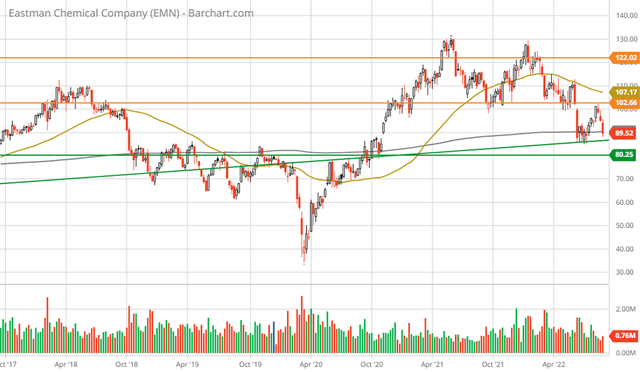
The COVID-panic crash level of March 2020 is an extreme price outlier which is unlikely to be retested. While I expect exceptionally strong support near $80, there is additional technical downside potential to the $70 range which would equate to roughly 21% downside potential.
Compared to the fundamental upside potential of 69% to 155% plus, the downside looks quite minimal resulting in a decidedly asymmetric risk/reward setup. The 1-year daily chart below highlights the 8-month bear market in Eastman shares and the current retest of the green long-term uptrend line.
Eastman Chemical 1-year daily chart (Created by Brian Kapp using a chart from Barchart.com )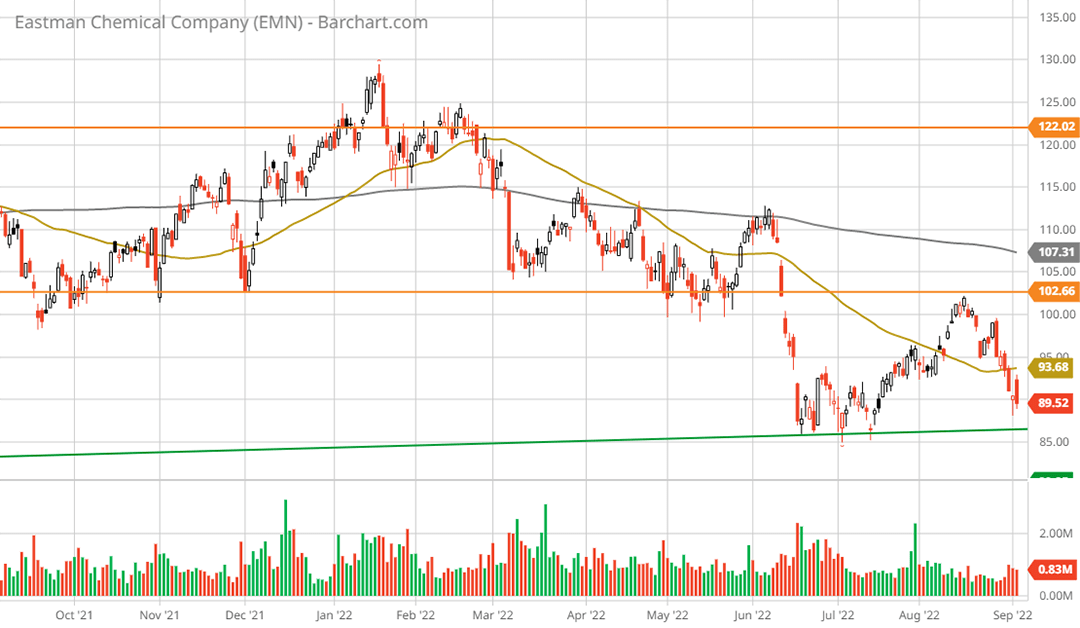
While the current retest of recent lows near $85 may fail to hold given the current bear market in stocks broadly, the downside appears to be well contained. First upside resistance is near $102 followed by $122, after which there is no visible resistance. The lack of technical resistance above $122 is fully supportive of Eastman entering a long cycle of outperformance, as was the case from April 2003 through June 2014.
Summary
After eight years of sideways consolidation, Eastman Chemical looks to be on the cusp of a new bull market. The high likelihood of Eastman surpassing consensus growth estimates through mid-decade combined with its deeply discounted valuation creates an excellent multiple expansion opportunity.
Eastman’s leveraging of secular growth opportunities combined with its organic growth and increasingly premium product mix set the stage for above-average growth rates well into the future. With the consensus expecting stagnant sales into mid-decade, the upside surprises could become substantial. This dynamic could introduce the high end of the fundamental upside targets discussed above.
The above-average dividend yield of 3.4% is likely to grow at well-above-average rates into the foreseeable future. The capital return program is supplemented by a substantial share buyback program. Eastman’s capital return program should provide material support alongside the strong technical foundation nearby.
Finally, the high quality of Eastman’s business is likely being undervalued by the market. This opens the door to further multiple expansion opportunity as Eastman is rerated to the higher-quality end of the Materials sector. Eastman offers a truly asymmetric risk/reward opportunity.
Be the first to comment