

3alexd
Eastman Chemical Corporation (NYSE:EMN) is a specialty chemicals company that operates in four segments: Advanced Materials, Additives and Functional Products, Chemical Intermediates, and Fibers. It is headquartered in Tennessee but has plants in twelve countries and competes with a large number of other chemicals companies.
The company’s dividend yield is 3.8%.
It divides revenue from markets as
*15% transportation (with a lean toward EVs).
*12% consumer durables and electronics.
*12% building and construction.
*50% stable end markets.
Investors should be aware that at its 1Q23 investor call in April 2023, it expected continued weakness in virtually all of its markets in 2Q23.
Eastman’s trailing twelve-month earnings per share is $5.61. However, the average of analysts’ expected 2023 EPS is 40% higher, at $7.85/share. Additionally, the average of analysts expected 2024 EPS is 60% higher, at $8.97/share.
While demand in the construction sector has lagged, demand in the automotive and fiber sectors are holding up. Moreover, Eastman, as with other companies, faces improved margins with lower feedstock (especially petrochemicals) costs and energy costs compared to 2022.
I recommend Eastman Chemical as a buy to investors in specialty chemicals seeking capital appreciation as the economy recovers.
The company’s 2Q23 earnings date is the last week of July 2023.
First Quarter 2023 Results and Guidance
For the first quarter of 2023, Eastman Chemical reported sales revenues of $2.4 billion, compared to $2.7 billion for 1Q22. Earnings before interest and taxes were $246 million, compared to $333 million for the same quarter a year ago. Earnings per share (EPS) for the quarter was $1.12, compared to $1.80 for 1Q22.
The company reported a sequential (4Q22 to 1Q23) improvement in earnings due to lower costs, the ability to hold prices constant despite customer destocking, and efficient operations.
It expects to reduce cost structure by more than $200 million, net of inflation. And one of its new initiatives is the “circular economy platform,” technologies that make use of recycled materials, like waste plastics.
Operating results are in the four divisions noted above: Advanced Materials, Additives and Functional Products, Chemical Intermediates, and Fibers.
Eastman Chemical and Starks Energy Economics, LLC
Eastman Chemical’s demand is economy-dependent; the company expects a still-subdued second half. Mark Costa, Eastman’s Board Chair and CEO cited the $200 million cost structure savings, along with realizing lower raw material, energy, and distribution costs. “We also delivered strong first-quarter results in Fibers and remain well positioned for significant full-year earnings improvement in this segment as margins recover to more sustainable levels. However, demand in many of our end markets is challenged, including consumer durables and building and construction, where we see inventory destocking continuing in the second quarter. Taking all of this together, we continue to expect to grow adjusted 2023 EPS between 5 and 15 percent, excluding an approximately $0.75 pension headwind. We also remain focused on taking a range of actions to deliver $1.4 billion of operating cash flow in 2023.”
Operations
Eastman Chemical has 35 manufacturing facilities in twelve countries. They are located as follows:
*US: 16.
*Europe: 9.
*Asia: 6.
*Latin America: 2.
While interested investors may refer to the company’s most recent 10-K for details, a few operational thumbnails are given below. These are highly condensed samples and do not purport to represent a given industrial process.
Advanced Materials: a) advanced interlayers use key materials like vinyl acetate monomer to make automotive safety glass; b) performance films use key materials like polyethylene terephthalate film to make paint protection films; c) specialty plastics use key materials like cellulose and waste plastic to make consumer packaging.
Additives and Functional Products: a) animal nutrition uses key materials like propane for preservation and hygiene; b) care additives use key materials like alcohols for personal and home consumption; c) coating additives use key materials like propylene in architectural coatings; d) specialty fluids and energy use key materials like benzene in commercial aviation.
Chemicals Intermediates: a) functional amines use key materials like ethanol in energy; b) intermediates use key materials like propane and ethane to make industrial chemicals; c) plasticizers use key materials like propylene in packaging.
Fibers: a-c) acetate tow, acetate yarn and fiber, and acetyl chemical products use key materials like methanol in cigarette filters; d) nonwovens use key materials like resins for aerospace applications.
Commodity Feedstocks and Costs
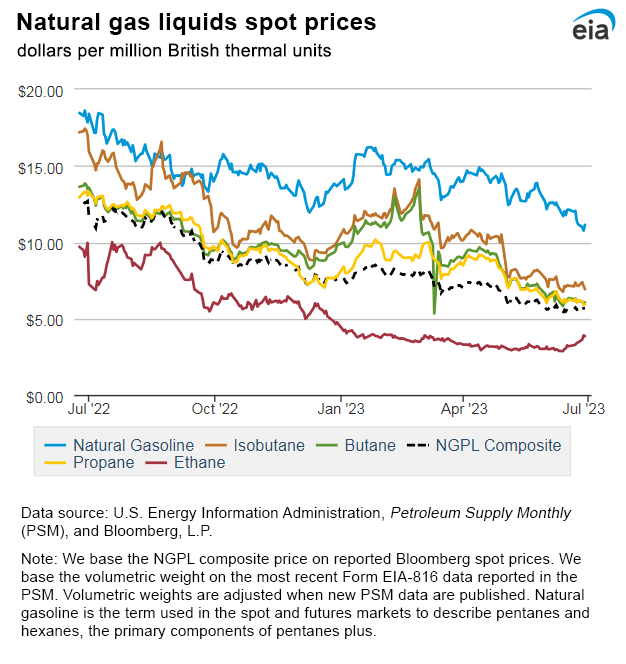
As described above, Eastman Chemical depends on a wide variety of feedstocks, many of them petrochemicals derived from natural gas liquids produced with natural gas and oil.
These costs rose markedly in the last year due to the rearrangement of hydrocarbon exports following Russia’s invasion of Ukraine and particularly the shortage of natural gas in Europe. They have since settled lower. However, the Federal Reserve raised interest rates to combat inflation, which has slowed the economy. So, Eastman is benefiting from lower costs but is challenged by reduced demand in some markets.
The graphs below show the marked improvements (lowered costs) for natural gas (two years) and natural gas liquids (one year). Because natural gas is a significant input to the cost of electricity, lower natural gas prices also reduce electricity costs.
EIA EIA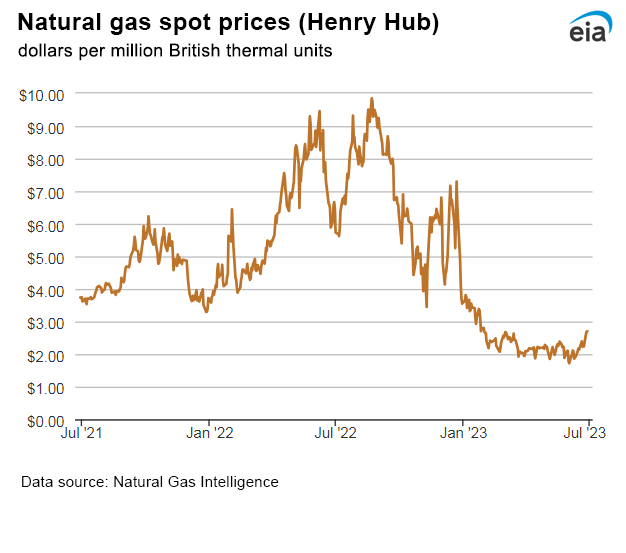
Competitors
Eastman Chemical Company is headquartered in Kingsport, Tennessee.
Competitors are numerous and differ by product line. They include Dow (DOW), the chemicals division of ExxonMobil (XOM), 3M (MMM), BASF (OTCQX:BASFY), Huntsman (HUN), Corteva (CTVA), Celanese (CE), Trinseo (TSE), Bayer (OTC:BAYN), Luxi Chemical Group, Ineos Group Holdings, LG Chem, Oxea GmbH, Sekisui Chemical (OTCPK:SKSUY, OTCPK:SKSUF), Kingboard Specialty, Chang Chun Petrochemical, S.K. Chemical, Saudi Basic Industries (SABIC), and Daicel Chemical.
Governance
Institutional Shareholder Services (ISS) ranks Eastman’s overall governance on June 1, 2023, as a 5, with sub-scores of audit (3), board (6), shareholder rights (6), and compensation (6). On the ISS scale, 1 represents lower governance risk and 10 represents higher governance risk.
Eastman’s ESG ratings from Sustainalytics in January 2023 were “medium” with a total risk score of 25 (43rd percentile). Component parts are environmental risk 12.0, social 5.4, and governance 7.2. Controversy level is 2 (moderate) on a scale of 0-5, with 5 as the worst. The only noted risk area is animal testing.
Shorts were 1.35% of floated shares at June 15, 2023.
A very small percentage of shares (0.69%) is held by insiders.
The company’s beta is 1.52: the stock moves directionally with the overall market but with more volatility, as can be expected from a cyclical chemicals company.
The six largest institutional holders at March 30, 2023, were: Vanguard at 12.6%, BlackRock at 7.2%, JPMorgan Chase at 6.8%, State Street at 4.2%, Putnam Investments at 3.5%, and Morgan Stanley at 3.3%. Some of these institutions represent index fund investments that match the overall market.
Financial and Stock Highlights
Market capitalization is $10.0 billion at June 30, 2023, stock closing price of $83.72.
The 52-week price range is $69.91-$102.18 per share, so the closing price is 82% of its 52-week high. It is 89% of the average one-year target of $94.14/share.
Starks Energy Economics, LLC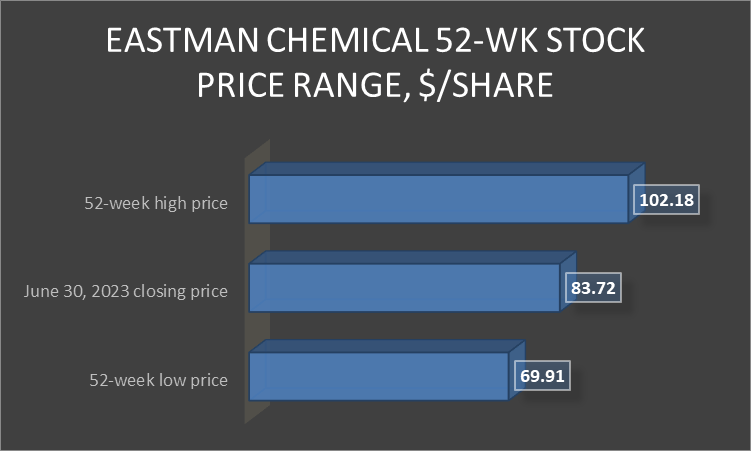
Trailing twelve-months (TTM) EPS is $5.61 for a trailing price/earnings ratio of 14.9. The average of analysts’ estimates for 2023 EPS is $7.85 and 2024 EPS of $8.97. This gives a forward price/earnings ratio range of 9.3-10.7.
TTM return on assets is 5.0% and return on equity is 12.4%.
TTM operating cash flow is $956 million and leveraged free cash flow is $1.3 billion.
At March 31, 2023, the company had $9.72 billion in liabilities and $14.98 billion in assets, giving Eastman a significant liability-to-asset ratio of 65%.
Of the liabilities, $3.0 billion was current liabilities and $4.6 billion was long-term debt.
The ratio of debt to EBITDA is 3.4.
The book value per share of $43.54 is just over the market price, implying positive investor sentiment.
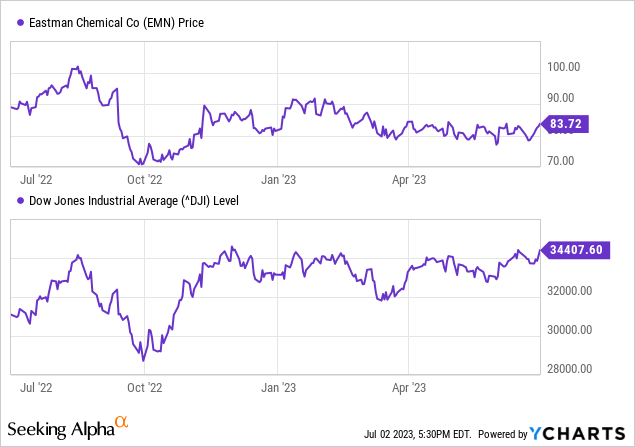
The graphs below compare three years of Eastman’s stock prices to the Dow Jones Industrial Average (DJI). Although Eastman Chemical is most affected by the overall economic health of the economy, it does not show as large a recent recovery.
The company’s ratio of enterprise value ($14.9 billion) to trailing twelve months EBITDA of $1.7 billion is 8.7, below the preferred ratio of less than 10 and thus indicating a bargain.
The dividend of $3.16/share provides a 3.8% yield.
Eastman has an opportunistic share repurchase program to offset dilution.
The company’s mean analyst ranking is a 2.3, closer to “buy” but leaning toward “hold,” from eighteen analysts.
Positive and Negative Risks
Eastman Chemical’s major risk is the slow recovery of global economies as its products are cyclic with autos, housing, etc.
It also has exposure to higher costs in Europe, as well as the currency risk that comes with international operations.
Positive risk comes from current and expected lower (than last year) natural gas, natural gas liquids, and petrochemicals feedstock costs.
Finally, the competitive risk from other chemicals companies in the US and abroad is ferocious. Eastman addresses this with new and breakthrough technologies and customer-specific solutions.
Recommendations for Eastman Chemical Corporation
Despite sagging 1Q23 earnings and some headwinds for 2Q23 results, I recommend that investors interested in specialty chemicals buy shares of Eastman Chemical.
The company has a solid US foothold with international diversification; moreover, it is experiencing and will experience tailwinds from lower natural gas, natural gas liquids, and electricity costs. It is compounding this benefit with a program to remove $200 million from its cost infrastructure.
It acknowledges first-half 2023 headwinds due to customer destocking and soft demand, particularly in construction. Much of its revenue comes from stable markets, and it is implementing a new markets (circular economy) program.
While the dividend yield of 3.8% is lower than the two-year Treasury rate, the estimated EPS upside to the trailing twelve months is 40% for 2023 and 60% for 2024.
Eastman Chemical
Editor’s Note: This article discusses one or more securities that do not trade on a major U.S. exchange. Please be aware of the risks associated with these stocks.
Be the first to comment