

kemie/iStock via Getty Images
QUARTERLY REPORT #26: PERIOD TO 31 DECEMBER 2022[1]
Performance and net asset value[2]
Quarterly gross portfolio return: +13.3%
A year ago, at the start of 2022, we noted the extreme performance over the preceding year and quarter of a basket of eight mega-cap technology stocks (AAPL, AMZN, GOOG, META, MSFT, NFLX, NVDA, TSLA) averaging 16.4% return in Q4 CY2021 and 45.3% in CY2021. We were clear in QR#22 (December 2021) that stocks in the US were expensive but that:
“for the S&P500 to have a down year in 2022, investors need to conceive a scenario where these securities retrace. Maybe price alone will be enough in a year where money may tighten in an unknown volatile fashion, or inflation expectations become embedded.”
Retrace they did. The “best” of the eight – MSFT – fell 23%. On average, the eight declined by 40% which meant that as a basket, they ended up some 13% BELOW the level at the start of 2021. Tesla and Meta Platforms both declined over 60% in CY2022 reflecting fears over management, prior excessive valuation and operational business issues.
So over the course of 2022 as ten year bond rates in the US rose from the 1.51% level at CY2021 year end to a high of 4.25% in October, the forward earnings multiple of 21.6x (4766/221) contracted sharply to a current forecast of 16.5x (3839/232) – all of the downward momentum in US equites within the S&P500 has been caused by multiple contraction – people willing to pay lesser multiples of future year’s earnings – directly resulting from higher bond rates.
Our clarity a year ago that some type of correction would ensue in US equities did eventuate, but more rapidly than we envisaged. In the first six months of the CY2022, S&P500 fell 20.6% and Nasdaq 100 –29.5%. Since 30 June 2022, S&P500 has returned 1.4%, the NASDAQ100 losing 4.9%, both before dividends.
As the December quarter progressed – almost regressed – into year end, and the inevitable reviews, the tone amongst the cognoscenti has become progressively more negative.
Bluntly, we are bemused, because if anything, 2022 has been a case of not that much really changing except for central banks catching up – with haste – on what should have been done progressively from mid 2021. The Powell’s, Lagarde’s and Lowe’s of the world – and their group thinking acolytes have been grotesque failures, responsible for ridiculous amounts of financial market volatility, when much could have been avoided. In turn, their ineptitude has reinforced economic inequality across the world, which they now need to reinforce by having as many people lose their jobs as possible. We know three candidates for the dole queue. God forbid any are offered additional contract terms.
Effectively what the “sea change[3]” bears are saying is that the absolute cost of money will cause a shock to consumers and borrowers unused to it, set against asset prices which will not respond upwardly whilst interest rates are maintained at the new higher levels.
Investment strategists – usually bullish at the start of each new calendar year – are now, as a collective, marginally negative for 2023. This probably reflects the fact they were collectively so wrong in 2022 with an average S&P500 forecast of 4825 – about 26% too high.
We can simplify what they think. At year end with S&P500 trading at 3839, and expected earnings for CY2023 for S&P500 at 232, S&P500 trades at 16.5x forward earnings. That’s a tiny bit above average. However, the problem is that strategists don’t believe the forecast 5.3% earnings growth in CY2023 over CY2022 is likely given pending tightening economic conditions and absence of large positive contributions from major oil companies; profit growth from energy companies has been the major contributor to S&P500 profit growth in CY2022. Moreover, if the earnings forecast falls back to (say) 210, they are not confident of the P/E ratio expanding out to >18x to accommodate such an outcome at prevailing index levels.
So the strategists prognostications for 2023 broadly fall into:
- a) Bullish – the Federal Reserve will cut rates later in 2023 allowing for an expansion of P/E ratios AND more optimistic forward earnings for CY2024, which will start to be built in towards the second half of 2023;
- b) Muddle through and end up where we currently are – earnings fall away to around 2022 levels or slightly below but with the Federal Reserve having finished raising rates early in 2023, investors won’t aggressively sell (effectively this is the real consensus view as many institutional investors won’t reduce equity exposures but are protecting their portfolio values with large holdings of put options); or
- c) Bearish (in the extreme) with a mixture of reduced earnings expectations – well below 200 (or 10% plus declines from 2022) added to a contraction of the P/E ratio to produce another year of 20% falls in S&P500.
Scenario (c) is why you are observing comparisons with 2008, because the US market – measured by S&P500 – bottomed in March 2009 after a 56.8% decline[4] at just 10.9x CY2009 earnings. At its peak, S&P500 had traded at 17.7x the 2007 S&P EPS of 87.5 but earnings fell close to 30% during the Great Recession. Whilst we’re not especially optimistic over index performance in the next twelve months, we do believe there are significant differences between the 2022/3 and 2008/9 environments. We said in our June 2022 (Quarterly Report #24) that we could see lows in the 3200-3300 area for S&P500 and haven’t really resiled from that as our thoughts on inflation (peaked) and interest rates (close to having peaked but not coming down at all quickly) haven’t changed.
It is noteworthy that two successive years of index declines in S&P500 are rare indeed: 1929-32 (3years), 1939-41, 1973-4 and 2000-2002 (3years) corresponding with Great Depression, WWII, oil price shock and dotcom bust. No surprise if this happened again (“The Great Unwind”?)
There is one thing we are more confident about. It’s an environment that lends itself more to picking individual securities and “small scale” thematics, rather than being aggressively positioned for one economic outcome or another at this stage. Hence, we have been reasonably aggressive about hedging our exposures with sold S&P500 derivatives for the time being against a portfolio we are keen about.
Finally on the macro environment, we feel that whilst it is of occasional interest, you would rather hear about our portfolio exposures and why we own specific securities; future quarterlies are therefore less likely to feature market commentary unless there are events which warrant such discussion. Like a central banking catastrophe somewhere.
East 72 Dynasty Trust
Our newly established unit trust focused on companies with controlling shareholders has now been internally funded and commenced investing in early January 2023. We are awaiting one minor administrative issue and have existing firm external commitments which should fund during January 2023.
We will commence marketing the trust, which is only available to wholesale investors, during the current quarter.
Portfolio
E72’s top twenty long positions in alphabetical order as at 31 December 2022 are:
Over the course of the quarter, we sold our holding in Agency Group, well before the AGM. Our thesis of a capital restructure to benefit shareholders along with underlying business growth was, in our opinion, not playing out, especially after the acquisition in Launceston. In our view, there is now little incentive for the employed agents to see The Agency Group equity value increase relative to the cash commissions they receive.
Our strong gross return of 13.3% during the quarter was assisted by advantageous short term trades in S&P500 derivatives, Perpetual and Tyro Payments (OTCPK:TYPMF). Within the retained portfolio, we benefitted from the 10:1 stock split in U-Haul (UHAL) – which gave 9 new “B” shares for each existing share – as well as switching our “B” shares into ordinary UHAL on advantageous terms. UHAL (adjusted) rose 18% over the quarter. The best performer – highlighted in QR#25 – was Manchester United plc which rose 76% in the quarter (see below).
We also were helped by US investment banking exposure in Goldman Sachs (+17%) and JP Morgan (+28%). The main negative contributors were the VW complex (VOW3.DE and PAH3.DE) and James Hardie (JHX) which adjusted its forecast earnings sharply lower.
We added some smaller holdings we are not yet ready to disclose but a more significant position in Magellan Financial Group, profiled below.
Sports teams (again)
Since we wrote about Madison Square Garden Sports (MSGS) and Manchester United PLC (MANU) in QR#25, the world of sports teams business has been busy:
- The Phoenix Suns basketball team is being sold for a price of $4 billion, which compares to the prior “Forbes” valuation of only $1.8 billion. This is the largest premium over the prior “Forbes” value since Steve Ballmer bought LA Clippers for $2 billion against its prior valuation of $550 million in 2014; (the “Forbes” valuation of New York Knicks is $5.8 billion – no stadium)
- The Washington “Commanders” NFL team, is under a sale process with bids apparently “over $7 billion” including surplus land; the last “Forbes” valuation excluding the land but including FedEx Field is $5.6 billion; $7 billion would be $2.5 billion over the highest ever price paid for a US sports team, being the Denver Broncos earlier in 2022;
- The smallest EPL team, Bournemouth, has sold for ~£120 million to US businessman Bill Foley. The ground only holds 11,000 fans. Burnley FC, a small team with a 22,000 seat stadium who were relegated last season – but currently lead the second-tier Championship under the guidance of Manchester City & Belgian legend Vincent Kompany – sold for the equivalent value of £202m in December 2020;
- Manchester United PLC’s majority owners, the Glazer family, announced on 22 November 2022, that to position the club, “the Board consider all strategic alternatives, including new investment into the club, a sale, or other transactions involving the Company.” Given the changed playing field in the EPL, most pundits (myself included) read this as a likely sale. The fact the Glazers were spotted at the recent World Cup with wealthy Middle Eastern businessmen, suggests this to be the favored (but not certain) option.
As a consequence of all this action, MSGS shares are up 39% from end September – including the special $7 dividend – whilst MANU stock has surged 76%. We still hold both since the publicly quoted share prices do not yet reflect likely transaction prices – not that a MSGS transaction appears likely.
At the 30 December 2022 share price, MANU shares value the club on an enterprise value basis at £4.3 billion, inclusive of an increased £1.1 billion of “liabilities”; liabilities are up £200 million at September from June due to the signing of Carlos Casemiro (£80m) and seasonal lull. The 30 September 2022 balance sheet illustrates why the Glazers either do not have the means or willingness to properly fund United and why a sale is a must, for them and supporters. The exit of the ego-centric aging Ronaldo during the quarter is a financial, emotional and on-field benefit. The significant improvement of the team during a potential sale period – hopefully heightened by interest from a brilliant ON-FIELD World Cup – is of real benefit and can hopefully continue.
Magellan Financial: where the media doesn’t look.
There have been two funds management stories in Australia in 2022: the merger of Pendal (OTCPK:PNDLF, PDL:ASX) and Perpetual (OTCPK:PPTTF, PPT:ASX) and the implosion of Magellan. The less said about the former, the better with a Perpetual board of Directors offering nearly its entire issued capital to the accepting shareholders of Pendal having previously described a Perpetual share price 35% higher as “materially undervalued[5]”. The Pendal offices must be lined with undiscovered lithium perched on gold.
Allowing for $366 million of net cash/liquidity on the PDL balance sheet and removing treasury shares, PPT have paid the equivalent of 1.40% of PDL’s funds under management (FUM) of $104.5 billion at end September 2022. On the face of it, that looks cheap, but PDL lost 10% of its starting year FUM in outflows, have a predominantly institutional set of mandates, still have some legacy FUM from Westpac (OTCPK:WEBNF), and an effective series of boutiques which do rely on individuals sticking around. If we increase the “value” of the PPT shares given away to $33.00 each, at which price the PPT Directors refused to engage with a non-binding indicative offer, the price increases to 1.82% of FUM. Looked at in this light, in our opinion, there is little wonder PDL’s Directors were keen to ensure the offer was cemented.
Magellan’s implosion really occurred with its “mensis horribilis[6]” in December 2021 during which period, the company lost its CEO, was forced to disclose the changed personal circumstances of its Chair/CIO and lost the mandate of its largest client – $23 billion – from St James Place Capital in the UK. In that month, MFG shares tanked from $33.16 to $21.24 – a loss of $2.2 billion in capitalisation.
The eventual departure of Hamish Douglass as Chair and CIO, succeeded by a rocky period of little but marketing fluff, temporary roles and responsibilities, saw more customer funds head out the door, and the shares implode by a further 60% during 2022. The Board issued a series of options to employees in April 2022 with an exercise price of $35.00 a share – when shares were $16.62 – suggesting they had little real clue as to the underlying value of the business. In addition, MFG lent $15m to employees over the year under full recourse loans to acquire shares at an average $26.53. We exclude the total $33.5m loan employee share balance from any asset calculation as it will inevitably be forgiven or restructured.
For the Australian financial media, who (on occasion) relish the dismantling of an individual placed on a pedestal – often against their wishes – it has been the equivalent of being taken to Mimi’s for a long lunch every day for a month[7]. The gossip has been merciless but the subsequent real analysis? A bit lacking. The wolves have taken some big chunks out of the Magellan body, but thanks to the investment banking background of its founders, and others in its orbit, Magellan isn’t dead. Far from it.
We are not interested in writing about MFG from the viewpoint of a broking analyst capturing month-to-month fund flows, performance and refining current year earnings estimates and performance fee possibilities. They can change quickly anyway with wayward markets/stock picks. With S&P500 down over 5% in December 2022, together with $2.6 billion of outflows, funds under management (hereafter FUM) declined $4.9 billion (9.8%) over the month and have distribution liabilities of a further $300 million in January 2023.
This piece stands back and looks at longer term valuation, which as it clearly illustrates, can go from absurd optimism to “they’re dead” valuations. It’s worth noting that even Blackstone ($BX) shares are down 50% from November 2021.
Having been a small part of teams which helped engineer turnarounds within two funds management groups[8], one of which was very lucrative for the owners, MFG has a tasty, Mimislike smell about it. Over the past quarter, we have quietly accumulated on down days, and will have to do more during 2023, especially if global equity markets continue downwards as this is a “beta” stock. However, there is little recognition of its inherent value, which is in excess of the share price but can be urinated away by poor management. And the new CEO, whilst intellectually smart, is, in my view, on training wheels in the public domain. But there are options galore within Magellan, from undervalued meaningful investments to future performance fees.
Smart investment banking started, and buttressed Magellan
There are few people that have the “history” with Magellan that I do. How come? Next to no-one there has ever heard of me. But I have had the benefit of following one part of Magellan before Magellan even existed, and only around 250 people can say that.
In a past life, many of my investments in tandem with a close friend involved exposures to the smallest microcap securities, especially those with cash backing or a small investment portfolio. In the late 1990’s I met the principals of New Privateer Holdings via an investment we had in common in an Adelaide based brush company[9]. We realised they were people of honour and conservatism. On 28 January 1997, we bought our first shares in NPH and by very slowly accumulating, had acquired over 5% of the company by 5 February 2002 (yep it took five years). We subscribed to subsequent rights issues and stayed as a substantial holder to late 2004 but remained as a smaller holder.
In March 2006, Chris Mackay, at that stage Chair of UBS Investment Bank in Australia, agreed a recapitalisation deal for NPH with a placement, rights issue and public offering[10]. This marked the start of a whirlwind of transactions, further equity issues, but in July 2006 the creation of NPH Funds Pty Limited, a 60/40 venture between New Privateer and Hamish Douglass, erstwhile cohead of Global Banking at Deutsche Bank in Australasia[11].
Six weeks later, NPH Funds and a small number of high net worth individuals recapitalised Pengana HedgeFunds Group, turning it into the current vehicle, Magellan Financial[12]. By end 2006, the new Magellan had floated an LIC- Magellan Flagship Fund (ASX:MFF) raising $350 million but had created a monster. The monster? Any future success in Magellan would meant large scale success/performance fees to NPH Funds and so (directly) to Messrs Mackay (via his 36% control of New Privateer) and Douglas, via his direct ownership of 40% of NPH Funds.
The solution was of course to internalise everything and merge Magellan and NPH. Don’t go back and read the documents – you will get a headache given the preponderance of options and second options – but by February 2008, New Privateer was consigned to history and the current Magellan off and running. Off and running into the perfect financial market storm.
By the time the merger had completed, MFG shares had fallen from $1.85 post announcement to $0.75, only around 10c/share above NTA, valuing the goodwill of the pair at a mere $14 million. By the time US equity markets had bottomed out, MFG shares were trading in the 32-35c range, valuing the enterprise at $52.3 million against net assets excluding deferred tax assets of $95 million and the small matter of $380 million of FUM.
Messrs Mackay and Douglass – the biggest new hotshots at the time in funds management – were (effectively) paying you (as shareholders) to come to work. I still have the contract notes buying a bunch in the first two weeks of March 2009 at an average price of 35c. They had doubled by August 2009 to >70c and aside from a small dip in Q3 CY2011 didn’t really look back until they got to $74.90 in February 2020. To the present date, buyers in March 2009 WHO HELD ON have had $13.10 in dividends, the current equivalent of 74c in MFF shares plus the dividend stream from them. At its peak, MFG was a 250-bagger from March 2009 – less than eleven years.
But there is more smart investment banking put together by the group at Magellan – which in our opinion, those shareholders who have invested very recently (like us) receive the benefit. To see how smart, let’s examine “peak crazy” MFG.
How absurd did MFG get at the peak?
MFG’s half yearly report to 31 December 2019 is glowing stuff with pre-tax income before performance fees up 30% over the corresponding period on average funds under management having grown a similar amount.
Annualising H1FY20 profitability – which actually was the outturn for FY20 – would derive an effective NPAT from funds management of ~$332 million assuming a full 30% tax rate[13] before “strategic initiatives”.
At $74.90, MFG’s then 182.3 million shares were priced by investors at $13.65 billion. Deducting the balance sheet footings before goodwill of $890 million gives a value for the funds management operation of $12.76 billion. FUM in February 2020 was $100.7 billion of which 73% was “institutional” (more below).
So at peak crazy, MFG was priced at 12.7% of FUM and 38.4x P/E of annualised net profit before performance fees. This at a time other listed global funds managers were priced at ~10x[14] and fractions of the FUM percentage. Speculators at that price clearly perceived an ongoing flow of performance fees, running at $80m pre-tax per annum ($56m after tax), which they were prepared to capitalise at a hefty multiple, more acquisitions paid for with scrip (public-private arbitrage) or that the investment team really were the second coming of Warren Buffett and were prepared to pay 7-10years in advance. That ~20% of FUM came from ONE CLIENT (St James Place Capital – SJP) accentuated the utter stupidity of the equity pricing.
Not at the peak, but part-way there, at a price of $55.20/share in August 2019, MFG placed $275 million of shares with the rationale being to fund a new retirement product (since dumped) and costs associated with a new trust and other “balance sheet strengthening” purposes. Given the balance sheet at the time was replete with $610 million of tangible assets, we’ll leave you to read between the lines. The placement was priced at an enterprise value (EV) to funds management NPAT of 34.8x[15] and EV of 10.2%[16] . Smart selling, except MFG shares rose a further 36% in six months at the next result.
However, the $275 million placement has, in our view, eventually been put to excellent use.
Principal investments
One of the clear indicators to MFG outsiders that objectives other than running a top class global funds manager had entered the equation emerged in September 2020, when MFG made the first of three significant external principal investments in three months. The least logical has been sold with a very good return, and the other two are an excellent fit.
In December 2020, MFG acquired what eventually turned into 11.6% of Guzman y Gomez, a fast-food chain which serves “clean, authentic and fresh Mexican” food but which the author believes would be better described as “fresh authentic extremely high calorie food to help you bulk”. The eventual investment of $102.7 million was turned into $140 million (before costs) in seventeen months, being divested in May 2022. Bluntly, this appeared to be a hubristic investment, irrespective of its financial success; funds managers, particularly very wealthy ones, rarely have any concept of minimum wage workers in hospitality.
The two other investments made in that busy three-month period in late 2020 are much more in keeping with what wealthy fund managers know and love: total market investment banking and stock trade clearing and equity market “plumbing” supply. They are both worth digging into and are likely to have an eventual value well in excess of the current carrying prices.
In September 2020, MFG acquired a 40% economic interest with 10% voting rights in Barrenjoey Capital Partners Group Holdings (Barrenjoey), at a cost of $156 million – $90m cash and the residue in 1.2 million MFG shares promptly sold off by the investee. (We told you investment bankers are smart; the MFG were sold at $55/share).
At the same time, Barclays (BCS) acquired a 10% economic interest with 5% of the votes, for $45 million.
Barclays has subsequently invested $75 million and the economic interest now is split 18.2% Barclays, 36.4% MFG with the remaining 45.4% owned by employees. Both Barclays and MFG provide loans to Barrenjoey for working capital as required.
MFG have numerous personal linkages with Barrenjoey, mainly from the coterie of highly talented ex-UBS personnel who formed the new business. These folks know each other and know their skills. From a standing start, Barrenjoey had 348 employees by 30 June 2022.
Even with the benefit of Barrenjoey’s audited accounts, it is difficult to ascertain how the “economic” and “voting” interests operate, since both MFG and Barclays own different classes of preference shares. What we do know is that MFG paid $39,008 for each of their 4,000 “M” preference shares. Barclays paid $45,000 each for their original 1,000 “B” preference shares but invested a further $75 million to obtain 819 new “B” prefs – a staggering $91,575 each. Has the real value of Barrenjoey doubled in two years?
Barrenjoey’s accounts break the company into “established business” – corporate advisory, equity capital markets and cash equities/research. That business generated $227m in revenue in the latest year and an operating profit of $57 million – before IT establishment expenses – and $44 million of IT is expensed, not capitalised. However, the fixed interest sales/trading part of the business only operated for three months, whilst the cleared derivatives and equities financing was non-operational – that’s a big “tech” spend, so the “being established” businesses virtually absorbed all of the equity/ECM business profit with a $56m pre-tax loss. Hence, overall, Barrenjoey lost $43m before tax in FY 2022.
Based on compensation expenses in the FY2022 year, the business is built for revenues of well over $300 million even in mundane markets, using US peer group comparisons. That should categorically take the business to profitability. Moreover, with some global brokers pulling away from equity financing (prime broking) – notably Credit Suisse (CS) – and others constrained by global parents, Barrenjoey should be able to find a real niche, since, in essence, many of the personnel operated within a highly decentralised UBS Australia, which had “special dispensation” from Zurich. Because they made so much money.
Any outsider given the opportunity to invest at the ground floor in UBS Australia would have done so. Yet, because of the hefty FY2021 loss of $114 million and despite the Barclays investment, MFG carry the Barrenjoey investment using equity accounting at $133 million in the accounts – below the cost of their $156 million commitment.
It might be accounting standards but makes no sense. Based on the total Barclays investment ($120 million for 1819 preference shares), MFG’s investment could notionally be valued at $264 million, valuing Barrenjoey at $725 million based on economic interest or 4.5x book value. Is it unrealistic to envisage Barrenjoey earning (say) $70 million pa in two years from a far greater range of activities[17]? We think not.
Magellan invested $20 million for ~17% of Finclear in November 2020. Finclear was founded in 2015 and has grown organically but also by two significant acquisitions, notably that of the largest clearing broker in Australia, Pershing Securities in 2021. Finclear executes, clears, and settles between 15 and 50% of all retail transactions that go through the Australian ASX on any given day. Finclear has also benefitted from providing broking and “plumbing” access to newer retail players such as Superhero and Stake. Numerous mid-tier Australian brokers outsource their clearing function due to the significant capital demands required by ASX.
We estimate MFG paid around $5.40/FinClear share for around 3.7 million shares in November 2020; we believe share issuance by Finclear in FY2022 has diluted MFG to 15.6% but recent issues have been at ~$11.20/share suggesting the MFG stake could be worth in excess of $40 million despite being carried in the books at an upgraded ~$29 million.
Finclear has been a leader in the use of distributed ledger technology which it is starting to introduce for the management of private company registries. Finclear is not yet profitable, losing around $11 million in 2022 at the operating level on revenue of $45 million.
Given the difficulties being experienced by the monopoly clearing agency in Australia (ASX) in replacing its main holding system (CHESS) we see Finclear as having intriguing opportunities over the medium term and a highly complementary investment to that of Barrenjoey for Magellan.
We believe Magellan’s disclosures on these two investments (especially Barrenjoey) – which represent ~10% of equity market value and hence are material – are opaque and need to be upgraded. There is little way to establish the carrying values of either from the investee accounts.
Conservatively, 45% of MFG market capitalisation is investments
We estimate MFG to be holding over $4/share in cash, seed and other investments as follows:
|
$ million |
Comments – adjustments from 30/6/22 |
|
|
Cash (E) |
326 |
y/end $420m less dividend ($125m) less buyback ($39m) + earnings (~>$70m) |
|
Option liability |
(133) |
Liability to cover 7.5% discount on option exercise of MGF LIC (expires March 2024) – see later |
|
Working capital |
– |
Receivables less employee liabilities & creditors and tax |
|
Cash net of option liability |
193 |
$1.06/share |
|
Seed investments unit trusts |
379 |
$2.09/share |
|
Barrenjoey (at book) |
133 |
$0.73/share (potentially up to $1.45/share) |
|
Finclear (at book) |
29 |
$0.16/share |
|
TOTAL INVESTMENTS/CASH |
734 |
$4.04/share |
All growing funds managers seed new vehicles, the larger ones in larger ways. But the massive decline in MFG’s equity capitalisation, along with the Guzman y Gomez investment sale and some innate conservatism, has left MFG with cash estimated at >$1.00/share, seed investments in MFG funds of over $2.00 a share and the two (in our opinion) really smart “market plumbing” investments, on the books (combined) at $0.90/share, but in our view worth much more. All up, on our estimates, ~$4.04/share or $737 million against an equity capitalisation below $1.6 billion.
These investments, making up 45% of equity market value, distinguish MFG from other ASX listed funds managers – Pendal (before takeover) had ~20% of equity value in working capital and investments, with Platinum Asset Management (ASX: PTM) around 31%.
On that basis, at current prices of $8.94/share, MFG’s three funds management businesses are priced by the equity market at a maximum $4.90/share or $889 million, or 1.77% of FUM. Is this realistic?
Retail funds management takes a long, long, long time to die.
In the early – mid 2000’s funds management businesses crudely changed hands with rules of thumb: 1% of fum for institutional, 3% for “masterfund/wrap” and 5% for “pure retail”.
These might have been rules of thumb, but they had a basis in analysis based on simple discounted cash flow metrics centred around fees, client tenure, costs and margin. Effectively, a LTV[18] calculation divided into prevailing FUM.
The three classes of investment customer are certainly morphing into each other, especially the latter two. So retail is not quite as sticky as it once was, as groups of advisers, aided by “best interest” laws and shielded under their professional indemnity insurance by ratings agencies, do see money move around.
However, even a cursory analysis of the company who did it all before MFG – Platinum Asset Management (ASX: PTM) – shows that despite substandard marketing and inconsistent medium term performance (below) there is still a substantial and lucrative business.
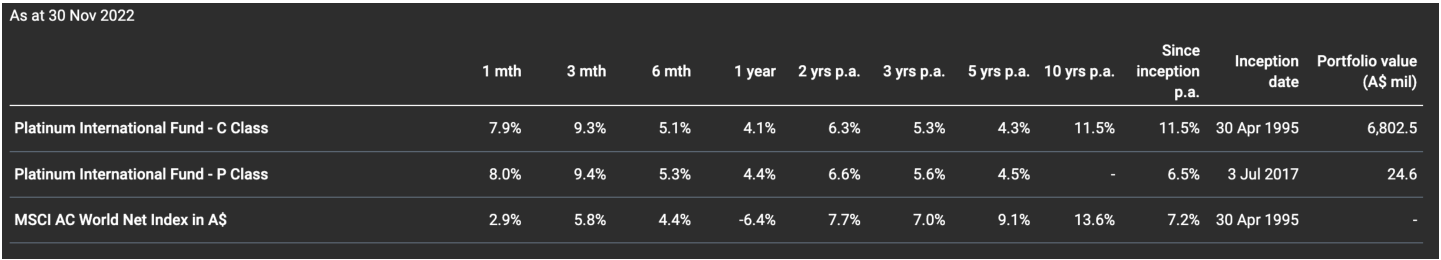
A year after its celebrated IPO in mid 1997, PTM’s retail open ended funds (i.e. excluding the closed end Platinum Capital) in June 1998, were around $12.5 billion. Since then, net OUTFLOWS from these funds have amounted to ~$8.6 billion in the 14years to June 2022. But thanks to the gradual nature of the outflows – though the past four years are all significant outflow periods ($5.7 billion) – FUM at 30 June 2022 was still $11.4 billion!!
As we will see, this is a striking contrast with what happens when institutional mandates disappear.
At the closing price of $1.79 on 31 December 2022, PTM equity is valued at $1,050 million; deducting cash, working capital and seed investments we estimate to be $322 million suggests a value for the funds management income streams of $728 million – equivalent to 4% of last stated FUM (November 2022) of $18.2 billion. This high number reflects higher fees charged by PTM and the “quality” FUM composition ($11.4bn retail, $5.5bn institutional, $1.2bn closed end).
Simple NPV analysis shows why the rules of thumb noted above are not so ridiculous. Assuming retail fees of 1.3%, cost to income of 80% (marketing events and dinners are expensive) 9% annual return of which half is distributed out to investors each year, the DCF of such an example yields a DCF/FUM of ~3.1%. Similar DCF analysis of institutional money at 0.3% but with a 50% cost/income ratio gives an outcome equivalent to 1.75% of FUM – but the money won’t be as sticky as the retail dollar.
Magellan FUM and a rough valuation
The jealousy that pervades analysis of MFG stems from the chart below, which shows that from December 2009 when funds were $602 million, global equity FUM (measured quarterly) peaked at $85 billion in June 2021 – just under 54% CAGR through 11.5 years.
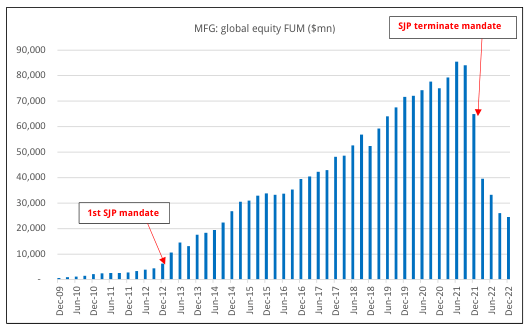
We estimate MFG now has global equity institutional funds (excluding infrastructure) of below $7 billion at December 2022 – around one-third of the SJP mandate; we estimate infrastructure funds to be ~$1 billion less than this. All but ~$400 million of Airlie’s $8.5 billion of FUM is institutional. The rapid decline of MFG institutional funds shows the domino like effect of this type of money. When one goes, especially in Australia due to the small number of gatekeepers, the rest goes very quickly. It’s why institutional money should be priced by managers on a (just above) marginal cost (+ performance fee) basis and should be accordingly valued lowly by investors. When markets run hard, it rarely is – as the prior idiotic valuations for MFG show clearly.
Airlie, an exclusively Australian equity manager was acquired in March 2018 for $97.1m – exclusively in MFG shares issued at $25.18. The acquisition price was consistent with our metrics for institutional managers at 1.61% of FUM. Airlie’s performance has been excellent over a three-year period, and FUM has grown to $8.5 billion, including $400 million in the retail fund.
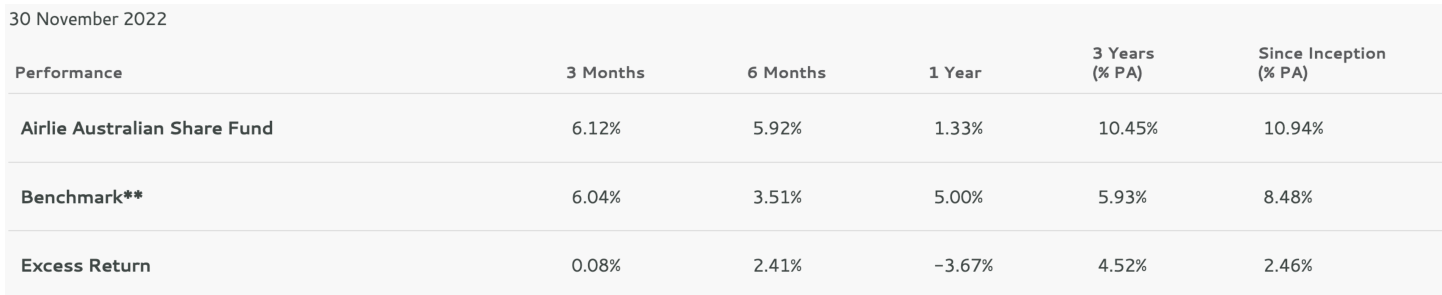
Based on interpolating the same metric to current FUM, despite the 5% FUM retail component, implies a value of ~$137 million for Airlie.
Hence, the guts of MFG’s valuation has to be the price applied to the “retail” global equity business, which as we saw with PTM is still ~4% of FUM.
We estimate MFG has just over $14 billion of retail global equity FUM, of which $2.7 billion is contained within the closed-end version of the Magellan Global Fund (ASX: MGF). MGF will struggle to raise new equity even via option exercise. Whilst MFG has covered the 7.5% discount to NTA of exercising the options, the MGF shares themselves trade at an 18% discount to NTA (as at 31 December 2022) suggesting the chance of option exercise is limited unless there is a veritable bout of enthusiasm before March 2024. Hence, as illustrated below, we think the option liability to MFG is probably very conservative.
We estimate using simple industry metrics that MFG’s fund management stream can be valued at just under $1 billion, as at 31 December 2022, as follows:
|
Global equities – institutional |
65 |
6,500 @ 1% FUM |
|
Global equities – retail |
345 |
11,500 @ 3% FUM |
|
Global equities – closed end |
108 |
2,700 @ 4% FUM |
|
Infrastructure – blended |
324 |
16,200 @ 2% FUM |
|
Airlie – blended |
137 |
Per above acquisition metric |
|
FUNDS MANAGEMENT STREAM |
979 |
$5.40/share |
This fund management valuation can be cross-checked very simply against MFG’s consolidated operating metrics. MFG’s consolidated revenue from funds management averages a base management fee of ~62bps; on the current level of FUM ($45.3 billion as at 31 December 2022) this equates to annual revenue of $281 million (average FUM of $53.8 billion and hence annualised revenue in H1 FY2023 will be above this). In recent presentations[19], MFG have reiterated funds management business operating expenses of $125m – $130m.
Hence, at the $45.3 billion level of FUM, MFG’s funds management business should produce pretax “cash” profit of ~$151 million, or $106 million after notional tax, excluding performance fees. Our valuation cross check therefore equates to 9.2x notionally fully taxed funds management profit at current FUM. That is in the lower echelon of the cohort group.
Our valuations imply that at the margin, every $1 billion loss in FUM impacts valuation by ~$21 million or 11.6c/MFG share.
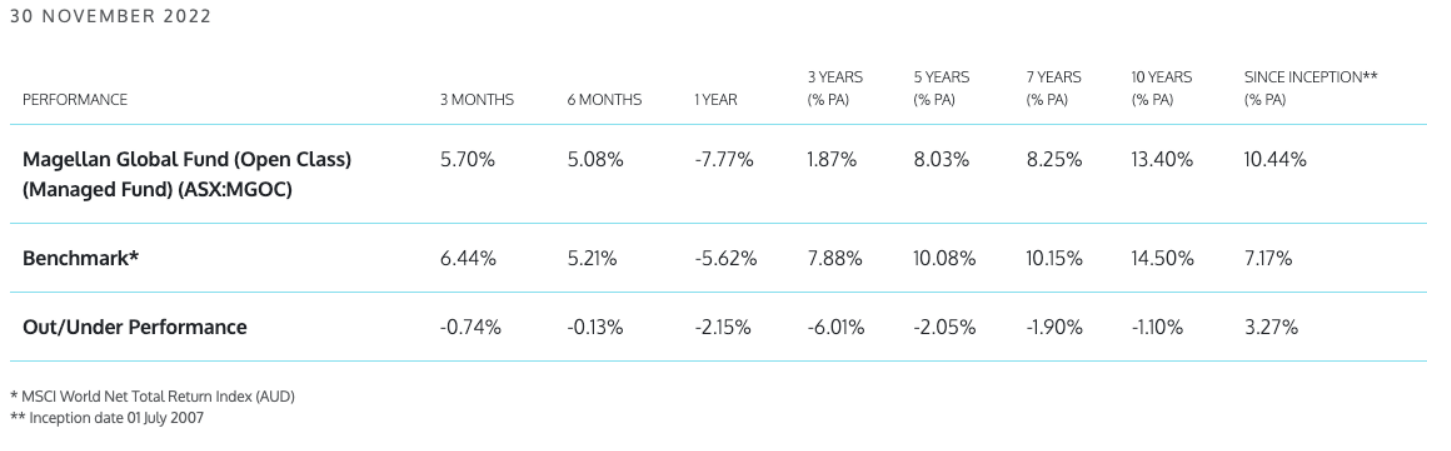
Magellan’s core fund performance appears to be levelling off, but not yet significantly improving – that takes time. The clear hole left by the ill-fated Chinese-tech play can be seen in the 3year per annum numbers, below:
MFG valuation and concluding thesis
We conservatively value MFG at $9.44/share based on 31 December 2022 FUM; being more liberal, we see scope to lift this to just under $11/share based on eliminating the option exercise liability and revaluing the Barrenjoey investment to reflect the entry price of Barclays:
|
base |
uplift |
|
|
Investments/cash per table |
734 |
734 |
|
Uplift Barrenjoey |
– |
131 |
|
Eliminate option liability |
– |
133 |
|
Funds management stream per table (9.2x P/E; 2.16% FUM) |
979 |
979 |
|
TOTAL VALUATION |
1,713 |
1,977 |
|
Per share (181.5 million) |
$9.44 |
$10.89 |
Whilst the 31 December 2022 MFG share price is only marginally below our base valuation, we see multiple areas of optionality for MFG to add shareholder value. Our valuations offer nothing for the capacity to generate performance fees, nor the inherent beta to equity markets – which we acknowledge may take time to play out.
However, we suspect equity markets are moving to a dynamic where stock picking rather than index-beta – which MFG have used to advantage in the past – will be a more important determinant of fund performance relative to benchmark. This does suggest Magellan have an above average chance of improvement (as do Platinum) and thereby start to redeem their reputation. The chance of new institutional mandates is virtually nil in the next three years, but the slowing of retail redemption is far more important.
And what about those investment banking skills?
Is it beyond the realms of possibility that Magellan may get together with Barrenjoey to build a FULL investment banking “powerhouse” with funds management, broking, M&A/ECM, stock lending and a strong capital base to boot? Given that the investments and funds management businesses of MFG make up roughly 50/50 of the current valuation, a separation and merger of Barrenjoey is hardly rocket science for smart bankers with a clear motivation. As we know from the extravagant rating of Macquarie (MQG) Australian investors would likely relish the thought. That clearly is an option not priced into MFG at current levels.
Hence, we have built a moderate portfolio position, with scope to add further if (very) sloppy equity markets derail FUM, which we see as the main risk to the position.
Our strategy
We have increased our gross exposures over the December with more securities hitting our valuation targets despite the volatility of indices; correspondingly we have added to our hedging strategy, mainly through S&P500 derivatives (in A$, not US$). We aim to grow the new East 72 Dynasty Trust to provide an initially very small management fee stream to reduce net expenses of the company.
Andrew Brown, Executive Chair
DisclaimerWhile East 72 Holdings Limited (E72) believes the information contained in this communication is based on reliable information, no warranty is given as to its accuracy and persons relying on this information do so at their own risk. E72 and its related companies, their officers, employees, representatives and agents expressly advise that they shall not be liable in any way whatsoever for loss or damage, whether direct, indirect, consequential or otherwise arising out of or in connection with the contents of an/or any omissions from this report except where a liability is made non-excludable by legislation. Any projections contained in this communication are estimates only. Such projections are subject to market influences and contingent upon matters outside the control of E72 and therefore may not be realised in the future. This update is for general information purposes; it does not purport to provide recommendations or advice or opinions in relation to specific investments or securities. It has been prepared without taking account of any person’s objectives, financial situation or needs and because of that, any person should take relevant advice before acting on the commentary. The update is being supplied for information purposes only and not for any other purpose. The update and information contained in it do not constitute a prospectus and do not form part of any offer of, or invitation to apply for securities in any jurisdiction. The information contained in this update is current as at 31 December 2022 or such other dates which are stipulated herein. All statements are based on E72’s best information as at 31 December 2022. This presentation may include forward-looking statements regarding future events. All forward-looking statements are based on the beliefs of E72 management, and reflect their current views with respect to future events. These views are subject to various risks, uncertainties and assumptions which may or may not eventuate. E72 makes no representation nor gives any assurance that these statements will prove to be accurate as future circumstances or events may differ from those which have been anticipated by the Company. East 72 Holdings subsidiary East 72 Management Pty Limited is Corporate Authorised Representative 001300340 of Westferry Operations Pty Limited (AFSL 302802) of which Andrew Brown is a Responsible Manager. |
Footnotes[1] Readers are referred to footnotes 2 and 20 – 25 explaining the derivation of the numbers. All returns are pre-tax unless stated otherwise. At the current level of net assets, cost imposition is estimated at 1.3% per month over the course of a full year (excluding capital raising related expenses) and is fully accrued monthly according to the best estimates of management. Readers are explicitly referred to the disclaimer on page 17. [2] Month by month tabulation of investment return and exposures is given on page 16, along with exposure metrics. EAST 72 HOLDINGS LIMITED ABN 85 099 912 044 Suite 1002, Level 10, 20 Martin Place, SYDNEY NSW 2000 telephone: 0418 215 255 [3] “Sea Change” is the name of Oaktree Capital Management co-founder Howard Marks’ latest Memo dated 13 December2022 [4] Peak of 1565.15 on 9 October 2007 down to 676.53 on 9 March 2009 [5] “Perpetual rejects revised conditional non-binding indicative proposal” 10 November 2022 [6] A monthly adaptation of the contorted Latin “annus horribilis” used by QEII in 1992 [7] Mimis is an expensive restaurant owned by famous Sydney venue owner Justin Hemmes located in the beachside suburb of Coogee, which Macquarie Bank has made off limits due to expense and distance from CBD (AFR 21 December 2022) [8] AMP Capital and Rothschild Australia Asset Management [9] McDonald Brushware Limited. It became MBL Holdings, Local Telecom and Internet and eventually MacArthur Cook Limited, a property-based funds manager. It was acquired by AIMS in September 2009. [10] ASX release “NPH Announces Recapitalisation Proposal” 9 March 2006 [11] ASX release “New Privateer Funds Management Initiative & Senior Appointments” 26 July 2006 [12] ASX release “Proposed recapitalisation of Pengana Hedgefunds Group nd establishment of Magellan Financial Group” 7 September 2006. [13] Pretax profits before performance fees of $237m. $237m x 2 =$474m x 70% = $332m [14] For example, see E72 AGM Presentation, 8 November 2018 [15] Pre-placement equity capitalisation of $9,775m less NTA of $610m = EV of $9,165m. Funds management pre-tax profit before performance fees of $376m in FY19 = $263m after notional tax. [16] FUM in July 2019 was $89.7biliion [17] We have some insights into investment banking profitability – in differing environments in Australia – but the accounts are obscured by “head office charges” and other transfer costing and hence have limited value in the public domain. [18] Lifetime value [19] FY2022 results 17 August 2022 and AGM 20 October 2022 |
Editor’s Note: The summary bullets for this article were chosen by Seeking Alpha editors.
Editor’s Note: This article discusses one or more securities that do not trade on a major U.S. exchange. Please be aware of the risks associated with these stocks.
Be the first to comment