

RichVintage/E+ via Getty Images
(This article was first shared with our Inside the Income Factory members and trial subscribers several weeks ago.)
I want to get this idea out to our readers quickly because, while lots of funds are down in price right now and their distributions are higher than normal, I think Eagle Point Income (NYSE:EIC) may represent an unusual value.
As readers of my last article on EIC know, the fund is the safer, further-up-the-balance sheet sibling of Eagle Point Credit (ECC). ECC buys equity of collateralized loan obligations (or “CLOs”), the “virtual banks” that buy the senior-secured floating-rate loans issued by major corporations and syndicated by banks like JPMorgan Chase, Bank of America, Citibank, Credit Suisse, etc. (For a primer on CLOs, check out my “CLOs for Dummies” article.)
Just like real banks, CLOs leverage their equity by about 9 or 10 to 1. In the case of banks, the top tranche is customer deposits (checking and savings accounts, CDs, etc.) Below that, many banks and/or their holding companies issue more “junior” debt, which is below the deposits in rank of payment, but above the equity. CLOs also have junior debt, which is typically rated triple-B and double-B.
EIC, the subject of this article, mostly participates in double-B rated debt, which is the sweet spot in the CLO liability structure Double-B ratings occupy the top rung on the non-investment grade rating ladder that runs from BB+ down to CCC-. Below that is “D” which applies to debt that has defaulted in paying interest and/or principal.
For double-B rated CLO debt to take a loss, even a partial loss, the CLO’s equity below it has to be completely wiped out; i.e. go to zero value. That has happened very infrequently in the three or four decades of CLO issuance, especially in the class of CLOs issued since the crash of 2008/2009. As a result, there have only been a relative handful of double-B rated CLO paper defaults in the history of CLO issuance.
With EIC’s price having dropped recently (along with most other funds) and its distribution having just been increased, it is paying a yield of 9.3% at Friday’s market close (March 25). I urge readers to refresh your memories about EIC by reading my article of late last year. At the time (October 2021) I was somewhat excited that EIC had just raised its distribution and was yielding a tad over 8%, which seemed like a lot given the then-current market conditions and what other high yielding funds were paying. Now EIC looks even more attractive at 9.3%, and all the things I wrote about it back then still apply:
- Powerful institutional ownership (67% by insurance companies and other heavy hitters).
- Credit history of CLO “BB” debt that is actually safer (i.e has lower default rates) than conventional corporate BB debt, yet pays higher coupons than equivalently rated corporate debt.
- Yes that’s right, strange as it seems when we expect our corporate debt markets to be relatively efficient.
- Personally, I believe it is a supply/demand aberration, where many traditional institutional investors (pension plans, university endowments, mutual funds) and their outside boards, investment committees, or shareholders either (1) don’t really understand “securitized” vehicles like CLOs, and/or (2) still confuse them with the collateralized debt obligation (“CDO”) asset class, that contained poorly or fraudulently underwritten home mortgage and home equity loans and helped precipitate the great crash of 2008/2009.
- CLOs, by the way, are a totally different asset class, despite their somewhat similar initials. Unlike CDOs, which caused so much of the trouble back in 2008, CLOs are highly transparent, contain large syndicated loans to major corporations that are fully rated as to default and loss expectations, and as an asset class came through the 2008/2009 crash in good shape.
Here is a table comparing a number of well-known, highly regarded high-yield bond funds to EIC in terms of their credit profile and current distribution yield. As a proxy for credit profile, I took the percentage of each fund’s portfolio comprising debt (i.e. bonds, loans, etc.) rated double-B or higher. Double-B, if you examine default statistics over many decades, has a demonstrably lower level of defaults per annum than debt issuers rated single-B or triple-C. In fact, single B rated issuers tend to default at rates many times that of double-Bs, and triple-C’s default at a rate many times higher than single-Bs, so there are serious “cliffs” as financial data folks would call them, when you go from one rating category down to another. It really makes a difference in credit quality and default/loss expectations when you compare one fund to another in terms of the make-up of their portfolios. As you can see in this chart, Eagle Point Income has a better credit profile than all of these other high-yield bond funds, with 67% of its portfolio in double-B rated credits. The others, which are fine funds, many of which we hold in our Inside the Income Factory model portfolios and/or in my personal portfolio, all have riskier portfolios than EIC’s, given how they all have a fewer percentage of assets rated double-B or higher.
CEFConnect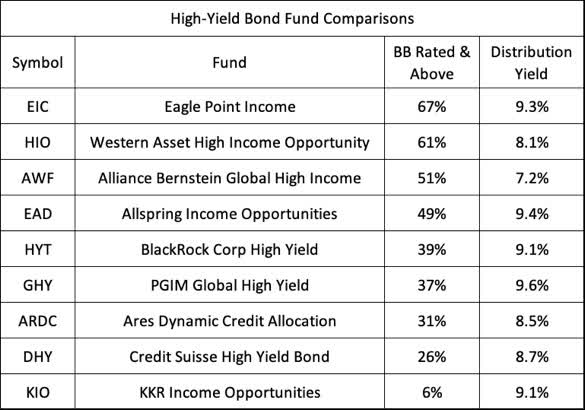
Yet, even though EIC has the least risky portfolio, with its current distribution yield of 9.3% it pays a higher yield than all of them except Allspring Income Opportunities (XEADX) and PGIM Global High Yield (GHY) which pay slightly higher at 9.4% and 9.6% respectively (which may reflect the market making them both pay up a bit because their coverage ratios have been somewhat shaky recently and we’re awaiting up-to-date figures to see if they’ve improved).
But more interesting and relevant to our discussion here is the comparison of EIC with highly regarded funds like BlackRock Corporate High Yield (HYT), KKR Income Opportunities (KIO), or Ares Dynamic Credit Allocation (ARDC), all of whom while they may have excellent records and reputations, clearly appear to have demonstrably riskier portfolios than EIC, when measured by their credit rating profiles. Yet the market has EIC priced at a level where it pays even more than they do. (I own and am totally happy with HYT, KIO and ARDC, in my personal portfolio and some of our Inside the Income Factory models, and nothing here is meant to disparage them. It’s just that EIC probably represents an even better value in the current market environment.)
As explained above, I don’t think the market has any rational reasons (i.e. based on the risk) for making EIC pay more, and the excess yield merely reflects supply/demand aberrations. In short, there is a potential windfall here for Income Factory and other investors looking to make what is essentially an “equity return without equity risk.” That’s how we often describe our high yield strategy of collecting our total return via a “river of cash” that we can reinvest and compound to create our own income and portfolio growth, without being dependent on “wishing, waiting and hoping” for a fickle market to do it for us.
Check it out and see what you think.
Be the first to comment