

Mongkol Onnuan
As we approach the Thanksgiving holiday in 2022, it may seem that things are looking rather bleak to many market participants after enduring a difficult bear market for most of the year. Talk of recession next year is still very much on the table, inflation seems to be slowly abating but not as quickly as the Fed would like, and rates are poised to continue to increase. Ironically, when I did a search on giving thanks for income, I stumbled across the following Morningstar article from November 2011 when things also looked pretty bleak but seemed to be improving.
U.S economic data were generally as expected and pretty good, but still not as impressive as data in the past several weeks. As I discussed last week, the GDP growth report for the third quarter dropped to 2.0% from 2.5% on a huge revision in the inventory data that was only partially offset by more-favorable import data. Existing home sales continued a string of better, but certainly not ebullient, news from the housing market. The personal income and expenditure report managed to finally show a month of strong income growth. However, the good news there was offset by what the market thought was lethargic consumption growth. On a year-over-year basis, however, consumption remained locked in the exceptionally narrow 2% range. Initial unemployment claims, on a four-week moving average basis, declined for another week, which should bode well for next week’s employment report.
Given the meager outlook for the financial market at that time based on that author’s perspective, which is similar in some respects to today’s gloomy outlook, I decided to look at what the SPDR S&P 500 ETF Trust (SPY) has done since then. On December 1, 2011, the SPY closed at 125.50. The close on November 18, 2022, was 386.21, or roughly a 300% gain in 12 years.
Yahoo charts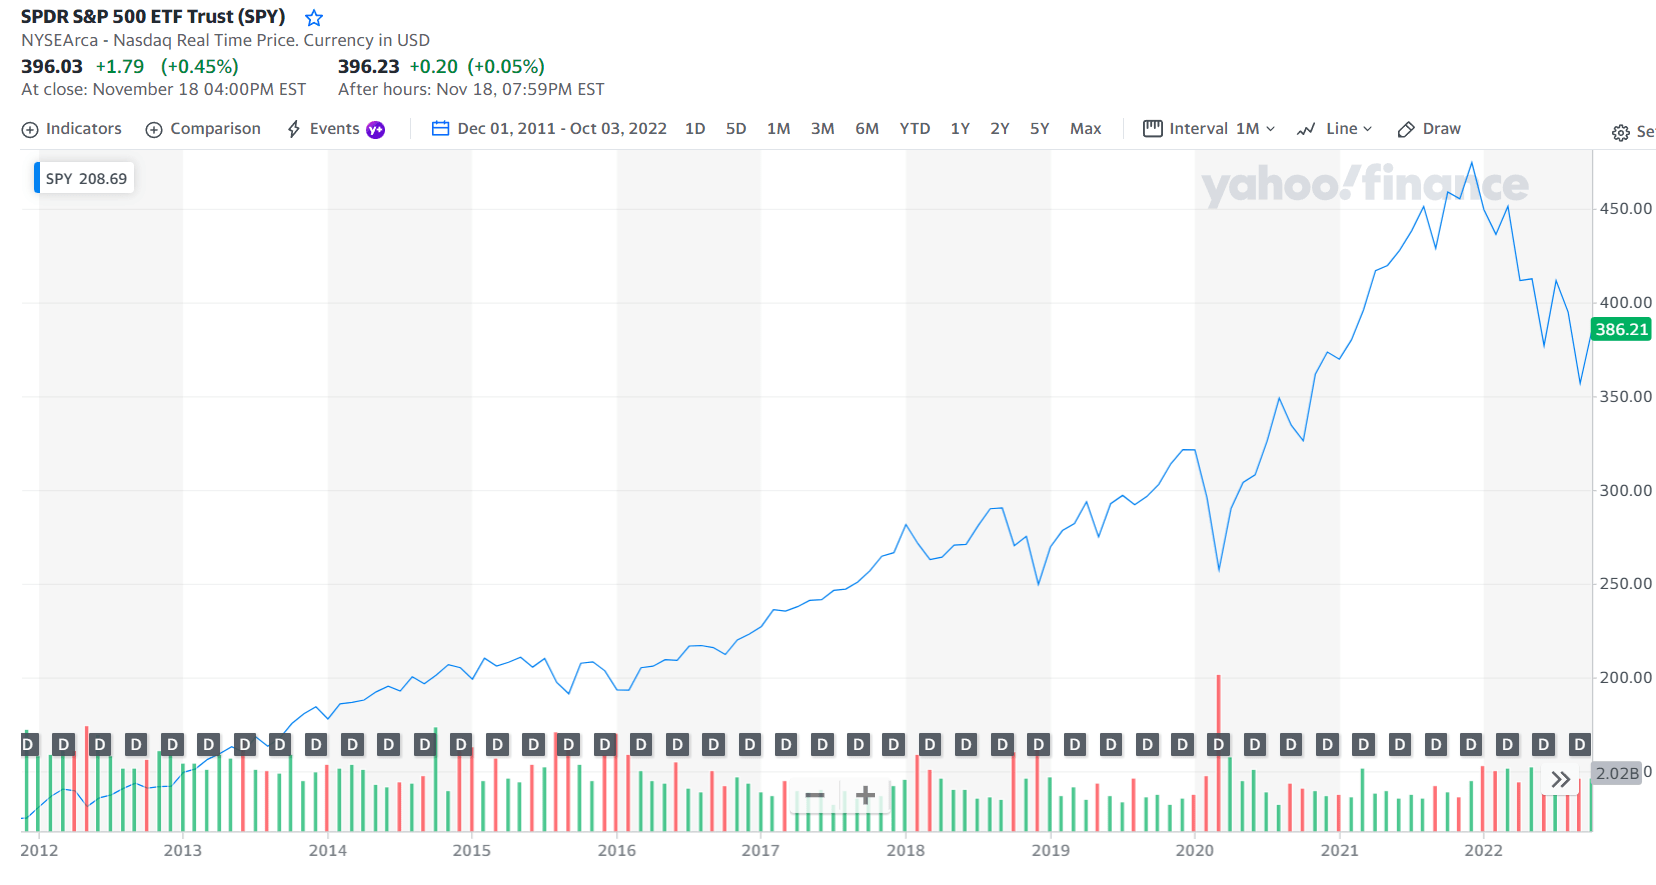
So how does one invest in such a volatile market environment? Depending on your investment horizon and your objectives for long-term success (however you define it, i.e., total return or max income) one method is to buy income generating CEFs that focus on high current income and have a secondary objective of capital appreciation. One advantage to this approach is that when the bear market causes the fund’s market price to drop, it offers income-oriented investors an opportunity to add more shares at a lower cost to generate an even higher yielding income stream.
In my eternal quest for income generating investment funds to help supplant my future monthly income from other sources, I came across Eagle Point Credit Company (ECC), which I have recently written about here and here. After the initial success of ECC, another fund was started in 2019 to follow in the footsteps of its sibling fund and Eagle Point Income Company (NYSE:EIC) did an IPO. EIC invests primarily in the junior debt tranches of CLOs and may invest up to 35% in CLO equity. Eagle Point Income Management, LLC is the external adviser to EIC and is a subsidiary of Eagle Point Credit Management, LLC. The latter is the external adviser to ECC and was founded in 2012 by Thomas Majewski and Stone Point Capital.
The main difference between the funds lies in the mix of CLO investments that each fund holds. If you need a refresher on CLOs – the reasons why income investors like them, and some of the risks inherit in them this insight from Pinebridge is very informative.
CLOs have been gaining wider prominence in markets in recent years, and it’s no surprise why. They have historically offered a compelling combination of above-average yield and potential appreciation. But for many investors, the basics of how they work, the benefits they can provide, and the risks they pose are wrapped in complication, which is why they’re also often misconstrued by the financial media and some market participants.
About EIC
With a market cap of $135 million, the focus of EIC is on BB rated junior CLO debt. All the BB-rated CLO debt that EIC holds is floating rate, which means that the credit spreads improve on those holdings as interest rates rise. Eagle Point believes that BB-rated CLO debt offers the potential for higher returns than senior secured loans or high yield bonds. And as Chairman and CEO Tom Majewski stated on the Q3 earnings transcript, BB-rated CLO debt has historically low default rates having withstood several market downturns.
We would remind you that CLO BB debt has historically withstood multiple economic downturns experiencing low long-term default rates. While past performance is obviously not a guarantee of future results. We believe the performance of our portfolio over the past several years has further validated CLO BB’s as a very attractive and resilient asset class.
EIC currently has $90 million in net assets with an estimated NAV of $12.81 to $12.91 per share. As of the October monthly report, there are 1,453 unique holdings, with a weighted average effective yield of 12.99%. The loans are well diversified with no more than about 10% in any single industry sector. The weighted average remaining CLO reinvestment period is 1.7 years. That is not unreasonable for a fund that only went public 3 years ago.
ECC monthly report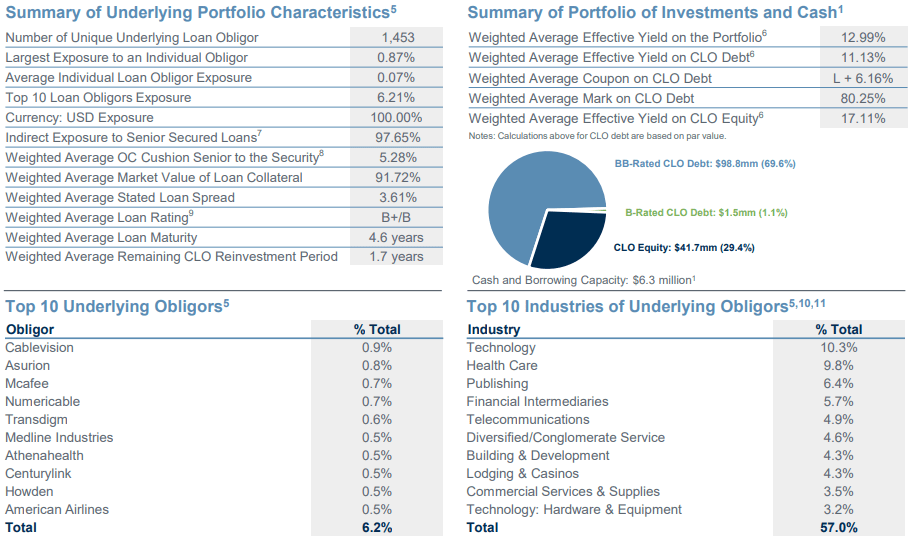
Distributions paid out have included $4.62 in cumulative distributions per share in just less than 4 years. In 2022, the monthly distribution was raised twice, and then again for the third time in less than a year when an increase from $0.14 to $0.16 was declared on November 7 for the months of January through March 2023.
This slide from the Q3 2022 investor presentation illustrates the clear advantages of BB-rated CLO debt over high yield bonds including higher yielding returns and very low default rates.
ECC Q322 presentation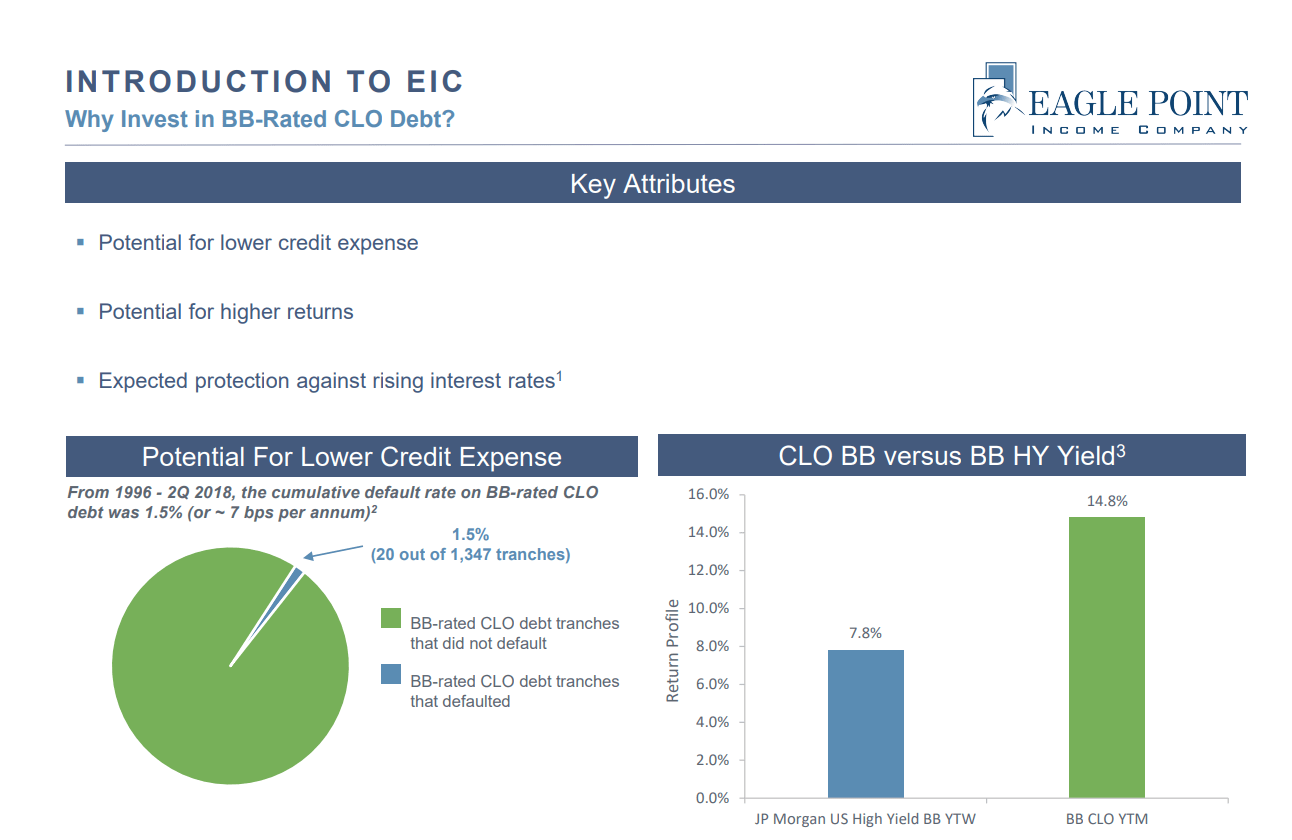
CLO debt offers additional credit enhancements for CLO investors including overcollateralization, excess spreads, and a non-static structure. The dynamic structure of CLO debt offers the fund manager to take advantage of market mispricing and reinvestment of CLO debt at lower cost during periods of volatility in the credit markets.
ECC Q322 presentation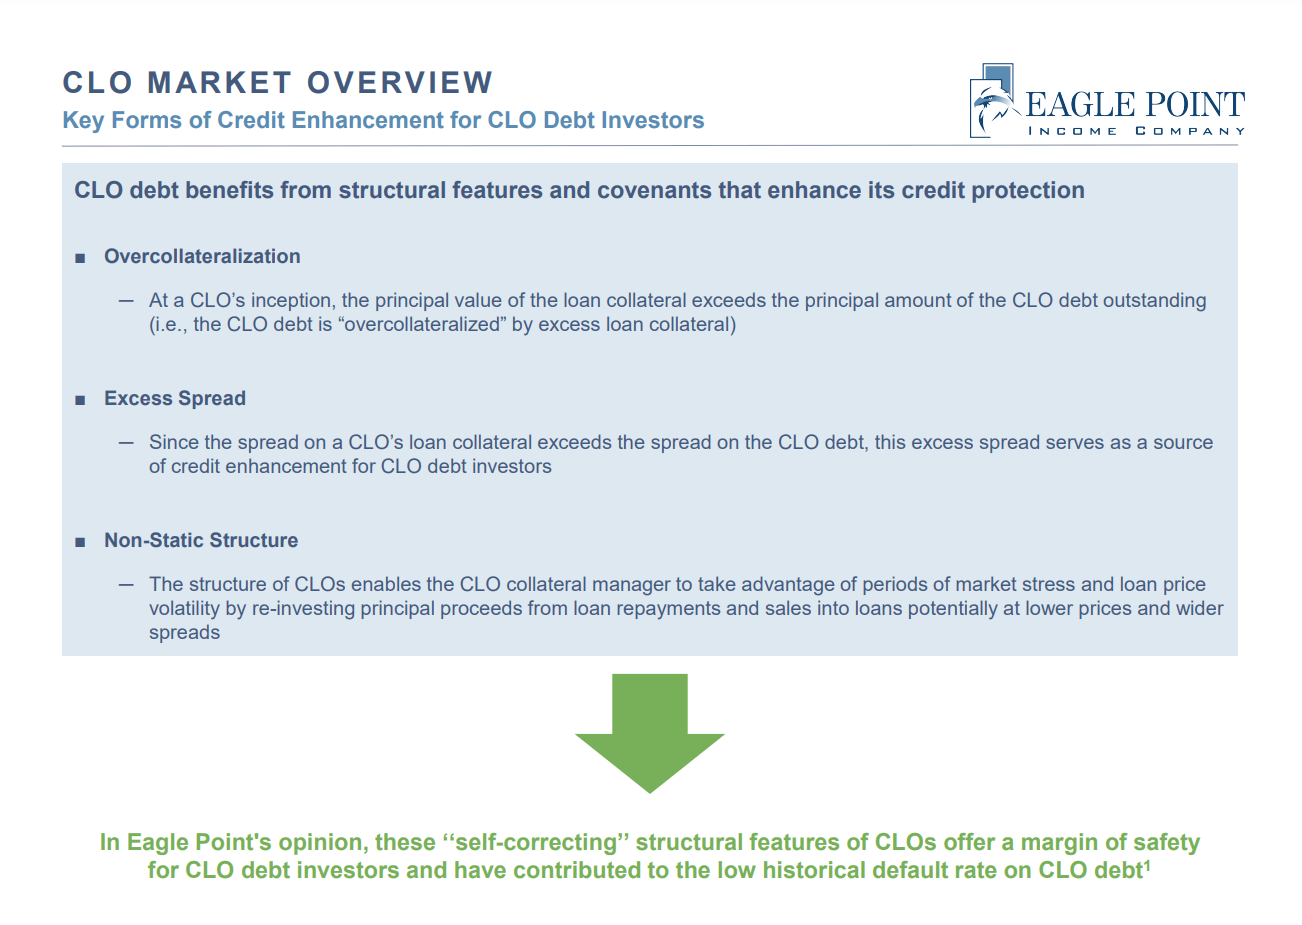
A recent article from my fellow author, Steven Bavaria, explains the benefits of both Eagle Point funds by reading the “tea leaves” in the monthly report. In that article, he explains that the ability of EIC to buy CLO debt for much lower prices on the secondary market has allowed the fund to increase its future income generation potential.
The debt EIC buys is currently marked to market at an average price of 80.25 cents on the dollar. Last January’s report (link here) shows the price at 95.54 cents on the dollar. So while EIC is investing in a different part of the CLO liability structure than ECC (i.e. above the equity and therefore less risky) it too (like its sibling) is in a position to take advantage of a market that is seriously overcompensating investors for perceived credit risks (as I discussed a week ago here). In EIC’s case, it can collect the debt it owns at par and then repurchase new debt at about 80 cents on the dollar, which it then holds to maturity, collects at par for a capital gain, etc.
Eagle Point Income Q3 2022 Highlights
On November 15, 2022, EIC reported third quarter results including NII of $0.47 per share, an NAV per common share of $13.05 as of September 30, and a GAAP net loss (inclusive of mark-to-market unrealized losses) of $3.6 million or $0.51 per common share. The weighted average effective yield as of September 30 was 12.77% based on amortized cost and 19.15% based on fair market value.
Summing up the quarter’s results, CEO Majewski had this to say:
“We had a strong quarter as our portfolio continues to materially benefit from the rising interest rate environment,” said Thomas Majewski, Chairman and Chief Executive Officer. “We generated NII of $0.47 per common share, excluding non-recurring expenses. This once again exceeded the distributions we paid during the quarter. In addition, due to the over 2% increase in LIBOR between July and October, we expect cash flows from our CLO debt securities will continue to increase. Given our confidence in the Company’s future outlook, we were pleased last week to once again raise our monthly common distributions by 14% to $0.16 per share for the first quarter of 2023. We remain well positioned to generate compelling risk-adjusted returns over the long term.”
Despite the crazy volatility in credit markets in September, EIC was able to grow NII significantly as senior secured leveraged loans continue to outperform other asset classes in the rising rate environment that we are in. Also, the entirety of EIC debt is based on fixed rate preferred stock so that part of the expense equation improves with rising rates that lead to increasing cash flows while not impacting the debt load since that part is fixed and does not move up with rates.
The majority of underlying loan obligors in the CLO debt portfolio have maturity dates that extend beyond 2025. The October monthly report shows the price, credit rating, maturity, and stated spread distributions of the underlying loan obligors.
ECC monthly report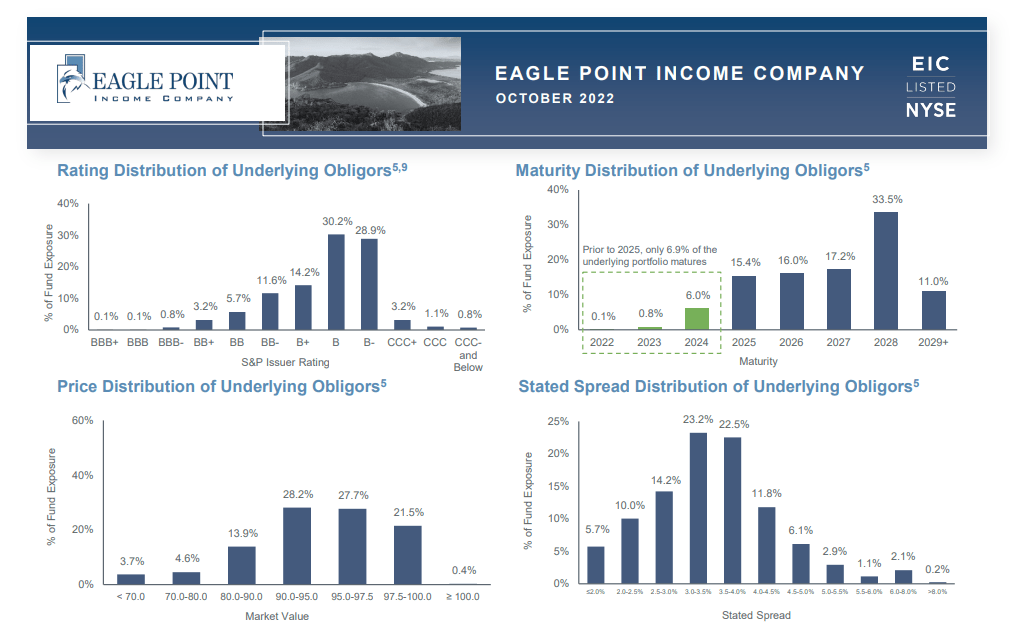
There were no loan defaults in October and although they do expect loan defaults to creep up in coming months, none of the investments are on non-accrual and the portfolio appears well positioned to take advantage of rising rates and the current credit environment.
CEO Majewski summed up expectations for the future of the fund in the earnings call with these remarks,
As long-term focused investors we seek to construct our portfolio to manage through periods of dislocation, and as evidenced by our continued strong performance in the face of a current challenging environment, we’re executing that playbook exactly as we planned. We are also continuing to seek to lengthen the weighted average remaining reinvestment periods of our CLO debt and equity portfolios.
As of the end of October, the company had $6.3 million net cash and revolver capacity available for investment. Asset coverage ratios sit comfortably at 247% for preferred stock and 688% for the credit facility, well above the required coverage levels of 200% and 300% respectively.
Summary and Recommendation
Clearly, with 3 distribution increases in less than a year and quarterly NII well in excess of the distributions paid out during the quarter, the EIC fund appears to be a strong candidate for long-term income-oriented investors to buy shares of the fund at relatively low prices. The YTD total return for EIC is considerably better than the S&P 500 index and the recent pullback offers investors a buying opportunity at a price below $15. At the current price of $14.80 (as of 11/18/22) and with the projected dividend raise to $0.16 monthly, that would result in an annual yield of 13%.
Seeking Alpha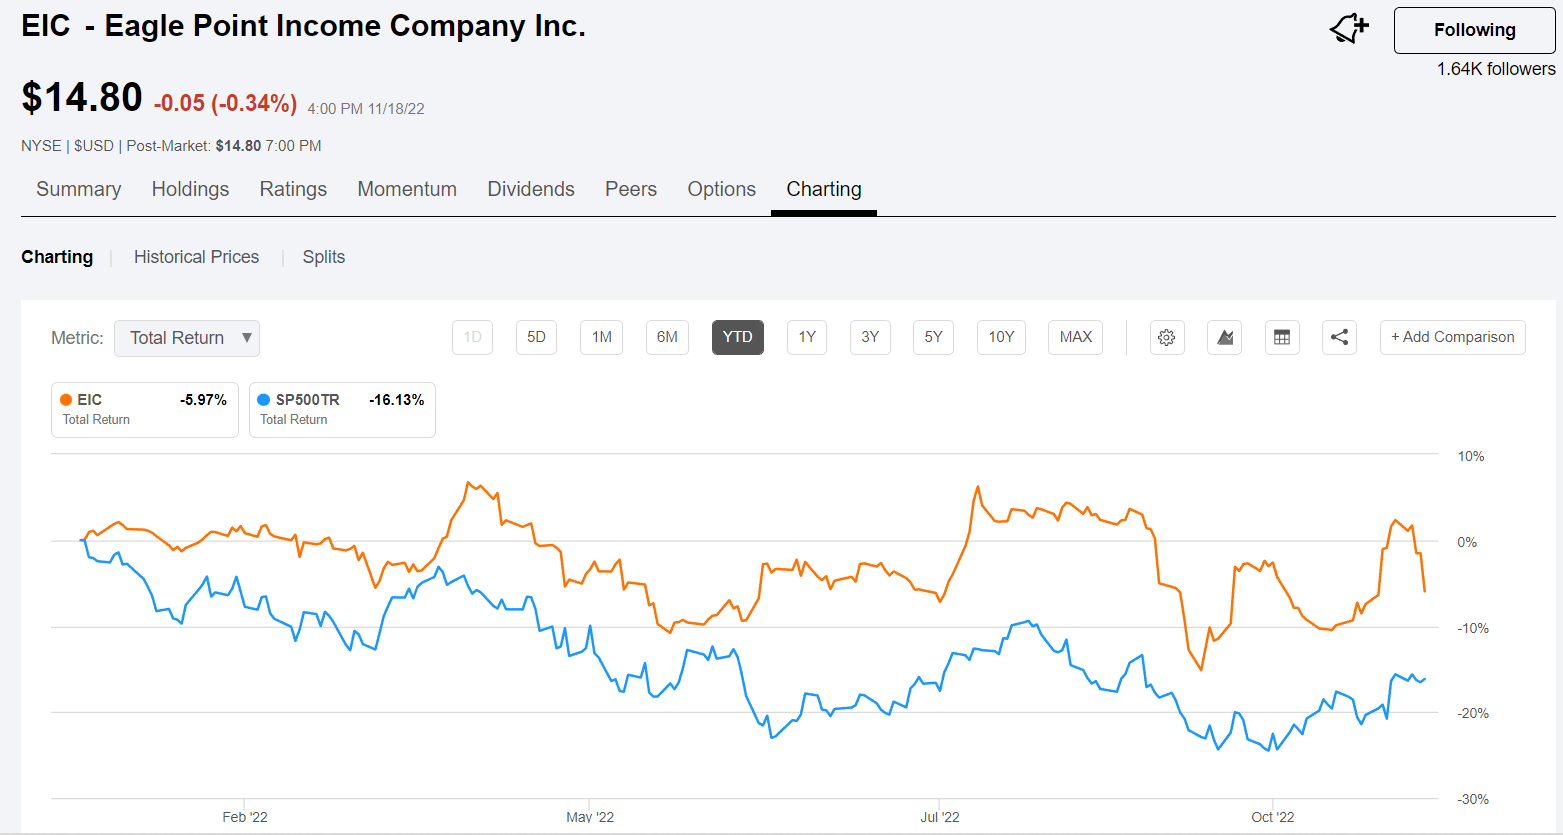
I recently started a long position in EIC in my own retirement income portfolio and I look forward to receiving the increasing monthly distributions. As the new year unfolds and if market conditions continue to offer opportunities to reinvest in CLO debt at lower costs to EIC fund managers, the NII is likely to continue to outpace monthly distributions and a special or supplemental may be something to look forward to next year, as is the case with ECC.
Thanks for reading and please add your comments below.
Be the first to comment