

aluxum
One of the most misunderstood asset classes in the investing world seems to be CLOs (collateralized loan obligations). I have read numerous articles on Seeking Alpha and other financial websites that suggest avoiding the high yield funds that deal in CLO debt and equity due to the perceived high risk. One CLO fund that offers investors a high yield distribution at relatively low risk relative to other asset classes such as stocks or high yield bonds is Eagle Point Credit Company (NYSE:ECC).
ECC Overview (ECC Q222 Investor presentation)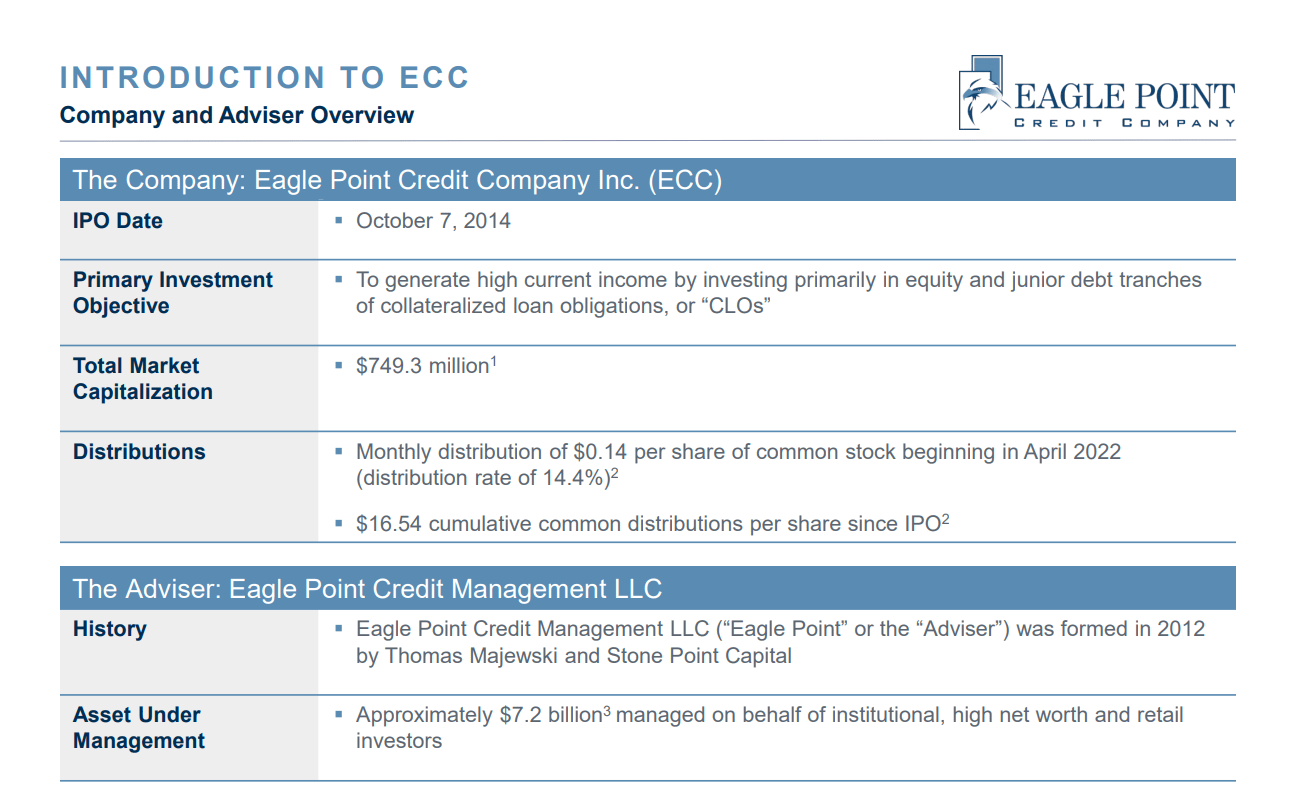
Currently, ECC is trading for a near 52-week low price of $10.37 as of market close on 10/18/22. The monthly distribution is set at $0.14 monthly through December. That works out to an annual yield of more than 16%. In addition, shareholders of record on October 11 will receive an additional $0.25 dividend payable October 31. The fund is paying a healthy monthly distribution to long-term holders, however, the market price of ECC has been dropping steadily for the past 9 months. In fact, the price return since the beginning of the year looks a lot like the S&P 500 price return.
Seeking Alpha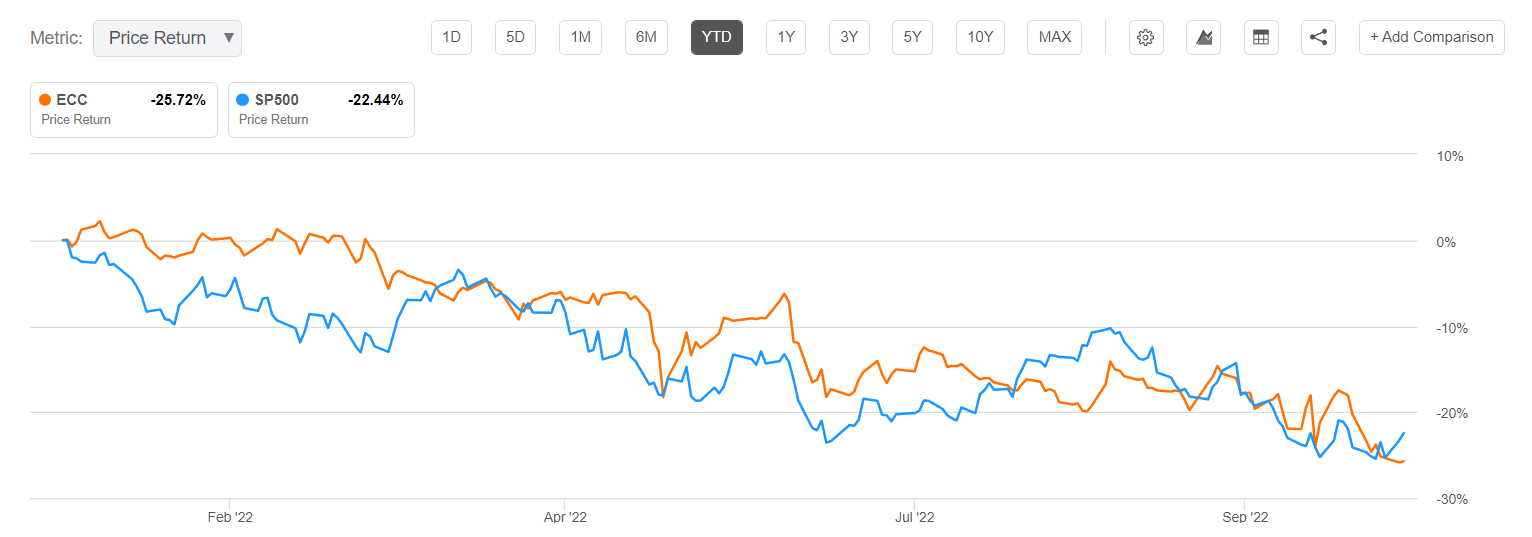
That means that ECC must be a “risky” investment then, right? Well, no, not in my opinion. I think that now is a very good time to buy ECC for the steady distribution and increasing cash flows that support the 16% yield. Let’s investigate some facts about CLOs and dispel some myths about the risks. And we will do that by digging into ECC a little deeper.
CLO Basics and Current Status
First of all, to get a really good in-depth overview of CLOs, check out the “CLOs for Dummies” article by fellow contributor Steven Bavaria, who goes over the basics in pretty good detail.
Many investors may not realize that CLOs have been around since the 1980’s but the first “modern” CLOs, which focus on generating an income stream via cash flows, were issued in the mid to late 1990’s. CLO vintage 1.0 included some high yield bonds and loans in a structure that remained in place until after the 2008 financial crisis. The next vintage was 2.0 that began in 2010 and included more stringent credit support and shorter reinvestment periods. Then 3.0 came along in 2014 and aimed to further reduce risk. The majority of CLOs in the market today are 2.0 and 3.0 vintage.
CLO vintages (Pinebridge)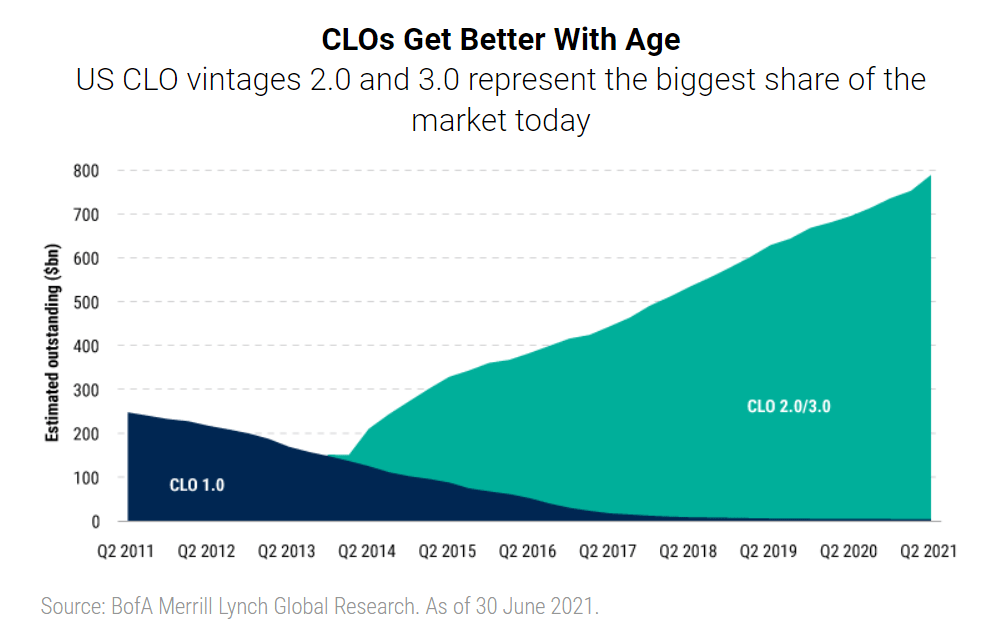
This January 2022 article from Pinebridge helps to further explain the complexities behind CLOs and also outlines some of the risks. It is also worth a quick read if you want to know more about the CLO asset class as an investment vehicle.
For example, leveraged loans are the collateral underlying the portfolio and they also fuel the income stream. Those loans also offer several levels of built-in risk mitigation.
Standard & Poor’s defines leveraged loans as senior secured bank loans rated BB+ or lower (i.e., below investment grade) or yielding at least 125 basis points above a benchmark interest rate (typically Libor or SOFR in the US and Euribor in Europe) and secured by a first or second lien. Several characteristics make leveraged loans particularly suitable for securitizations. They:
- Pay interest on a consistent monthly or quarterly basis;
- Trade in a highly liquid secondary market;
- Have a historically high recovery rate in the event of default; and
- Originate from a large, diversified group of issuers.
The CLO market is large and growing. CLOs represent about 60% of the overall market demand for institutional leveraged loans.
Q2 investor presentation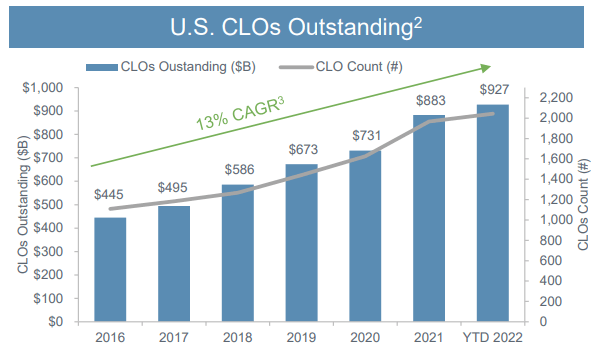
What About the Risks?
One of the risks that I seem to hear (or read) a lot is the possibility of a significant ramp up in loan defaults that could have a detrimental effect on CLO pricing and/or cash flows. In a September interview with Eagle Point Credit CEO Tom Majewski, he addressed the possibility of loan defaults increasing due to the current economic malaise.
But we look at where companies are today. And what I’ll say is that the tough times of 2020 certainly changed the way many treasurers and CFOs run their companies. Today, there’s a little more liquidity. Many companies favor longer maturities on their debt. … This is not a prediction on our part, but in a scenario where 10% or 15% of all corporate American loans defaulted in the secondary market, we expect that to be trading at 60, 70, $0.80 on the dollar, in such an extreme situation. Defaults will certainly pick up. It’s hard to see them not. And we’re seeing it happen as we speak. But we see a scenario more akin to a two, three or 4% default cycle. Loans are pricing that already today many loans trade between 90-95 cents on the dollar. Some of the higher quality loans $.96 $.97. But there’s enough discount in the system in the loan market to be able to buffer losses that you might have from a few defaults that are going to sneak into a CLO portfolio.
The weighted average remaining reinvestment period (WARRP) is one important consideration for CLOs in the ECC portfolio. Typically, the first five years of a CLO are the time to reinvest paydowns and repayments and even make swaps of loans between CLOs. WARRP is one important metric for evaluating individual CLO performance. With the down market in 2022 there are opportunities to take advantage of reinvestments in some of the newer CLOs before credit spreads deteriorate even further.
A longer WARRP is better because it provides more opportunities to reinvest and leverage current cash flows to buy discounted CLOs. The WARRP value has been growing each quarter as shown in this slide from the Q2 investor presentation.
Portfolio characteristics (Q2 investor presentation)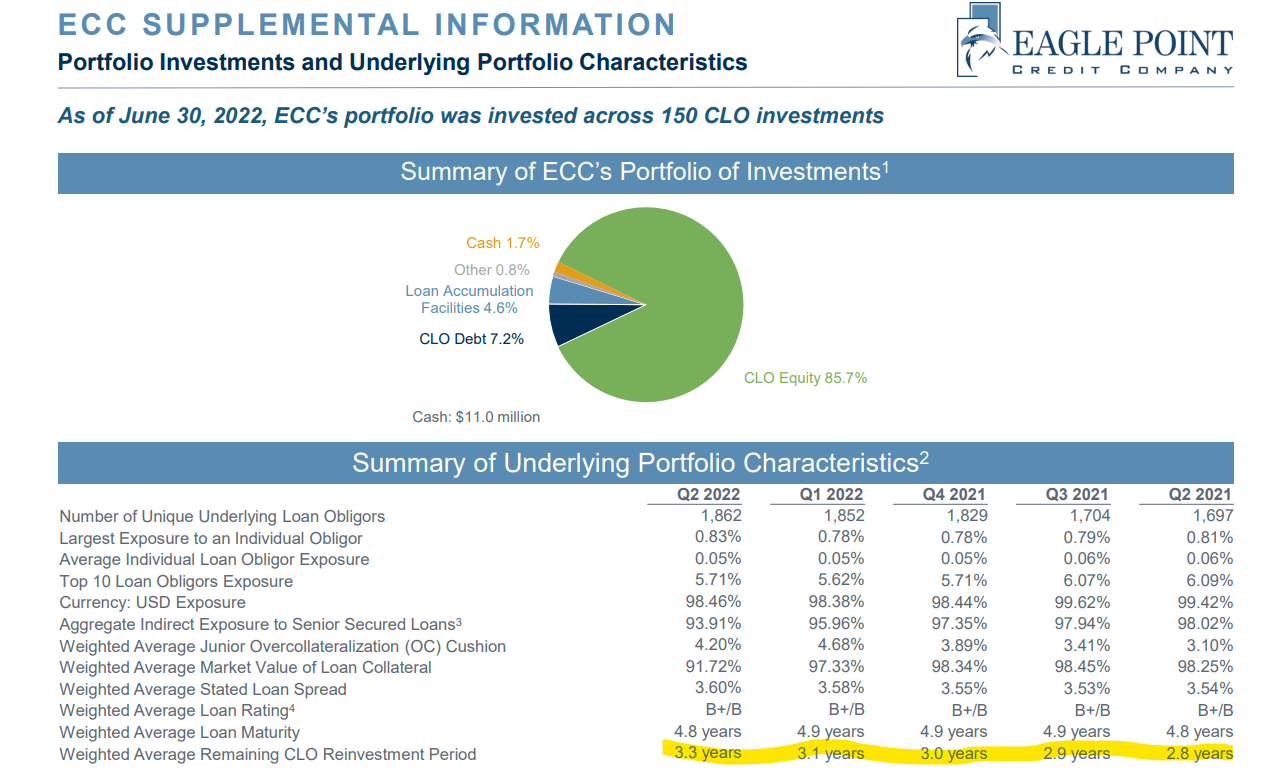
As Tom further explains:
We find that if you have the ability to reinvest your principal amounts that you receive back into those deeply, deeply discounted distressed credits or good credit spent on a distressed market, you’re going to come out as good as you expected, if not better.
Also illustrated in the Q222 investor presentation, the recurring cash flows have far exceeded the operating expenses and paid distributions over the past 5 quarters. This would seem to indicate that another special dividend may be declared within the next 3 to 6 months, or possibly an increase in the monthly dividend in 2023. At a minimum it offers investors a degree of comfort in the case of a reduction in cash flows during future quarters if that should occur.
ECC excess cash flows (Q2 investor presentation)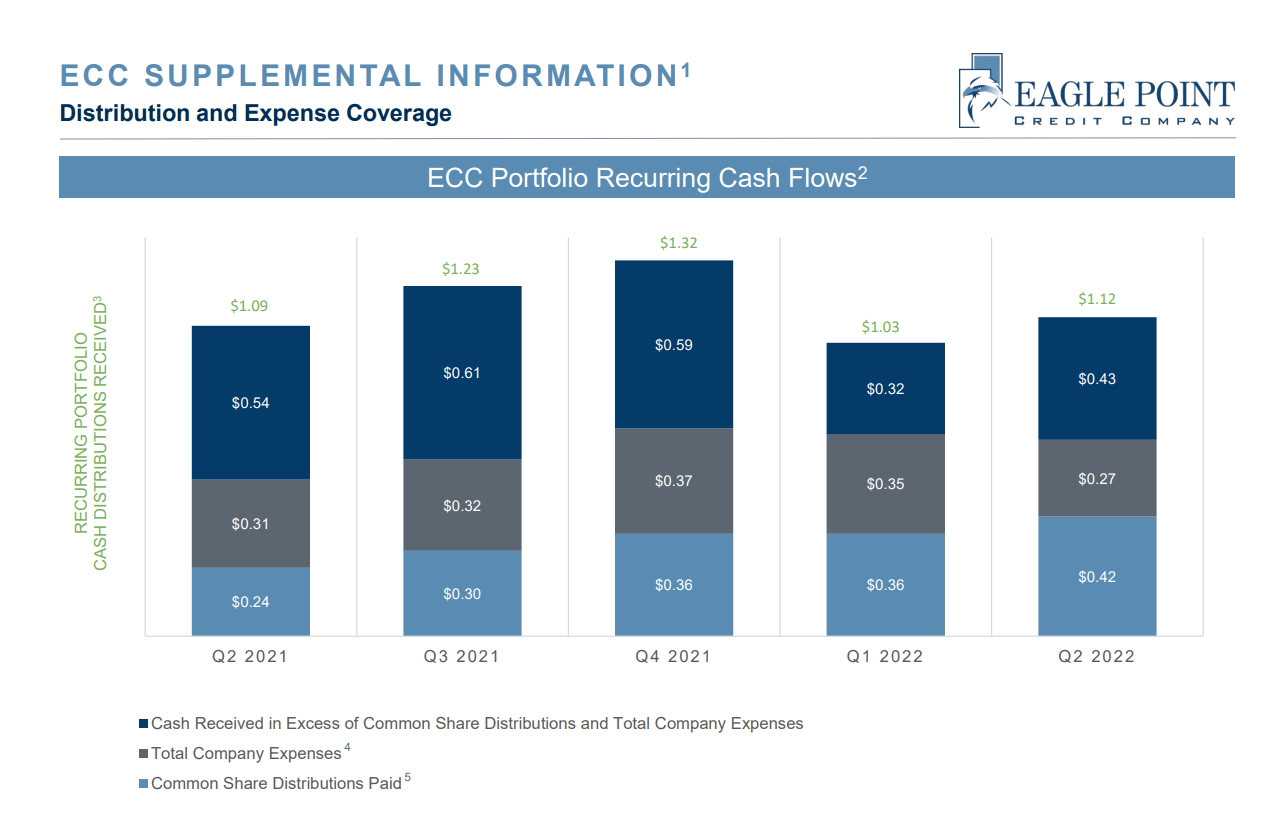
What about rising interest rates? What effect will that have on their debt payments and cash flows? According to Tom Majewski, the effect of rising rates is mostly a net positive for ECC given that most of their loans are floating rate tied to the 3-month LIBOR (now transitioning to SOFR). But the financing is fixed rate as he explains in the interview:
CLO debt pays floating rate as well, also off of three month LIBOR, three months SOFR. So what we get on the one side, we give on the other such that the equity is largely indifferent when holding all else equal to where interest rates are. But we’re not in a situation where we’re using long term rates on one side and short term rates on the other. It’s all typically a three month resetting paper in the case of ECC. All of our financing, however, is fixed rate. So those ECC- C’s I talked about, the ECC-B’s which we issued, those have fairly low and fixed rate coupons. So you’re able to buy them at a discount today as an investor in the markets are able to get some convexity in your purchase price, but those have five and 6% fixed rate coupons. So ECC kind of benefits, to the extent rates are going up, our assets and our CLO’s are going up in terms of their coupon, but our financing is fixed rate.
But What about the NAV?
ECC reports the estimated NAV of their portfolio monthly on their website. It is true that NAV has dropped significantly since the IPO in 2014 when it was estimated at $19.63. The latest NAV estimate from 9/30/22 was in the range $10.18 – $10.28. But the NAV fluctuates based on the current mark to market estimated value of the underlying loans in each CLO. In March 2020 during the depths of the Covid-19 induced recession, the NAV dropped to an all-time low of $6.12. The NAV then recovered to a high of $11.18 in December 2020, just 9 months later.
In 2022 the NAV started at a high of $13.47, then dropped to as low as $10.08 in June before climbing again into the 3rd quarter. The fund, which is really run more like a company, according to CEO Majewski, typically has traded at a premium above the NAV over most of the past 8 years but is currently trading closer to par (near even with NAV).
NAV history (ECC website)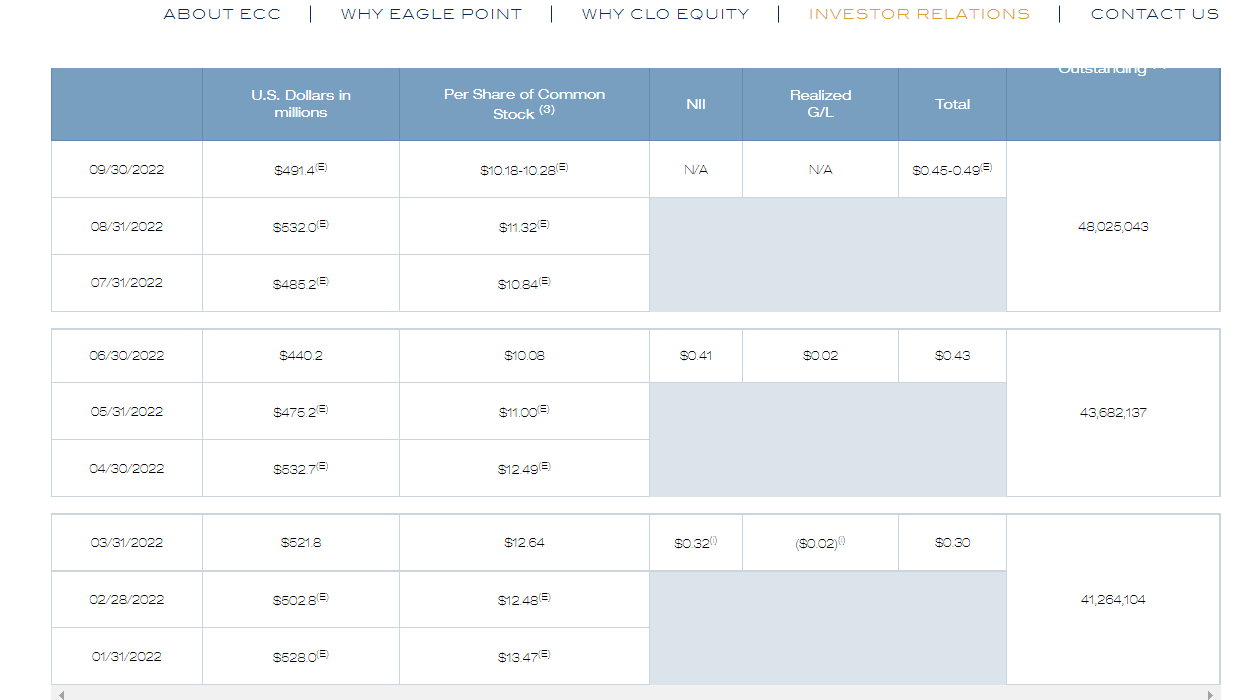
However, the NAV is not an indication of the portfolio health or the fund’s future prospects. The NAV does affect the market price because that is one way that investors value the company, but it may not be the best way. As Steven explains in his CLOs for Dummies article, the NAV calculation is complicated and includes more than simply the value of its holdings minus liabilities. In fact, just describing all the ingredients that go into a CLO valuation process can be difficult to explain in only a few sentences.
A CLO’s equity, like any other entity’s, should generally equal the value of its assets minus the value of its liabilities. Since the amount of the liabilities is fixed, we would expect increases and decreases in loan market prices to directly affect the net asset value of CLO equity and the funds that hold it. … Falling loan prices may reduce the mark-to-market value of a CLO’s loan holdings. But for the 95% or more of those loans that are healthy and performing, there has been no diminution of value, since the CLO can hold them to maturity and collect them at par, regardless of how low their prices fall in the secondary market.
Another way to think about this is that all loans have a binary outcome. Either they get paid off or they default. The current “market value” of a loan represents what an investor may be willing to pay on the secondary market, but that is not the true value of a loan that is yet to be paid off. And then there is the reinvestment angle and CLOs can be “reset” at higher rates, etc. Again, it is complicated and that is why good CLO managers are important to the health of a CLO portfolio.
Concluding Remarks
ECC went public in 2014 at an IPO price of $20 and has paid $16.54 in cumulative distributions since that time through June 30, 2022. An investor who has held shares since 2014 and reinvested dividends would have received a total return of 72.37% through July 29, an annualized net total return of 7.22%. Keep in mind that performance includes two severe market downturns in 2020 and in 2022.
Another comment from CEO Majewski sums up the current investment opportunity for CLO funds, and ECC in particular.
If you’re looking at this as a total return play, we think investing in markets like this, where people are a little bit skeptical of credit, we think is usually a great time. Frankly, we’ve done some research that shows the vast majority of times when loans are below $0.95 on the dollar broadly, which is where they are today. Over the next three years, the total return on CLO equity is quite attractive.
So right now it’s, I think, a very interesting time to accumulate exposure to the CLO market. If you’re looking for the current income, that’s a really good piece to have. If you’re looking for just a broad total return. We have an attractive dividend reinvestment program.
By simply looking at price and total return charts over the past (select your timeframe), investors might be misled into thinking that ECC is a poor long-term investment choice. Other funds that hold CLOs are showing similar patterns. If you compare recent returns from Oxford Lane Capital (OXLC), and XAI Octagon Floating Rate & Alternative Income Term Trust (XFLT), you are likely to come to a similar conclusion if you only look at past price action. But the market price for a CLO fund is skewed to the downside right now because of overall market bearishness and fear in the credit markets. On the other hand, cash flows continue to increase as loans within CLO tranches bought years ago are still being paid off every month.
Now is the time to buy CLO funds if you have a long-term horizon and can withstand the whiplash of widening and narrowing credit spreads, NAV ups and downs, and general negative market sentiment. Of course, you need to consider your own risk tolerance and investment objectives. My research indicates that unless we spiral into a more severe recession than most are already expecting, ECC will offer investors a steady and growing income stream over the next several years and the fund price is likely to rise again as the NAV increases when the market begins to recover from its lows.
Be the first to comment