

imagedepotpro
Time keeps on slippin’, slippin’, slippin’
Into the future …
I want to fly like an eagle
The last time that I covered Eagle Point Credit Company (NYSE:ECC) in September of this year, I wrote about the misconception that CLOs as an investment class carry a high level of risk that many assume must be true of a closed end fund that offers a very high yield income distribution. In fact, the risk to long-term income investors is much lower for CLOs in many cases than other comparable high yield investments such as some equity funds, or some REITs or BDCs, for example. Other authors have also discussed the myths and misconceptions of CLOs including a recent article from ADS Analytics, wherein the inner workings of CLO investments are explained in detail.
With a current regular dividend paid by ECC each month of $0.14 and trading at a market price as of 11/17/22 of $11.02, that annual yield works out to about 15%. That current yield does not include the two special distributions that were announced this year in addition to the regular monthly dividend. The first, a $0.25 special distribution was paid to shareholders on October 31. The second special distribution was declared on November 14 and will be paid to shareholders of record as of Dec. 23 (ex-div date of Dec. 22) on January 24, 2023. For investors who have held shares since the IPO in October 2014, the total distributions paid out equal $16.96 in cumulative common distributions.
Meanwhile, the company recently reported Q3 2022 earnings results, and those results indicate that, yet an additional special distribution may be paid next year due to the “excess” income that is being produced from the CLO investments in the ECC portfolio. This was alluded to in the earnings call transcript when CEO Tom Majewski remarked,
We paid a special distribution of $0.25 per common share in October. And just yesterday, we declared an additional special distribution of $0.50 per common share. Our second special distribution declared this year to be paid in January of 2023. We were able to do this because of the strong cash flow from our portfolio and it reflects our proactive portfolio management in a challenging market. We believe there may be more spillover income in 2023 as well.
He then goes on to say that they are finding very attractive opportunities to invest in the primary CLO market (and some secondary market opportunities as well) at appealing levels. In October (post third quarter) another $16 million net investment was deployed into CLOs and other investments in addition to the $60 million that was deployed during the third quarter.
The new CLO equity investments that went into the ground during the third quarter had a weighted average effective yield of 17% as we continue to deploy capital into investments with attractive yields. The weighted average effective yields on CLO equity, of course, include a reserve for future credit losses.
Furthermore, the average weighted remaining reinvestment period stood at 3.2 years, down slightly from the 3.3 years in the previous quarter, and well above the 2.4 years it was at the beginning of 2021.
Eagle Point Credit Q3 2022 Results
For the third quarter of 2022, ECC realized $22 million in net investment income and realized gains, or $0.47 per share, compared to $0.43 in the second quarter. In the year ago quarter (Q321), the amount of realized gains and NII was $0.39 per share. The company’s asset coverage ratios as of September 30 stood at 285% for preferred stock, and 421% debt coverage, which is well above the statutory requirements of 200% and 300%. From the Q3 press release (bold emphasis is mine):
Weighted average effective yield of the Company’s collateralized loan obligation (“CLO”) equity portfolio (excluding called CLOs), based on amortized cost, was 16.29% as of September 30, 2022. Weighted average expected yield of the Company’s CLO equity portfolio (excluding called CLOs), based on fair market value, was 25.39% as of September 30, 2022.
To put the increase in “excess” income in perspective, this chart from the supplemental information in the Q3 earnings presentation illustrates just how much they have in spillover income, so one could calculate that some is yet to be distributed even after the $0.75 in special distributions declared this year.
ECC Recurring Cash Flows (ECC Q322 investor presentation)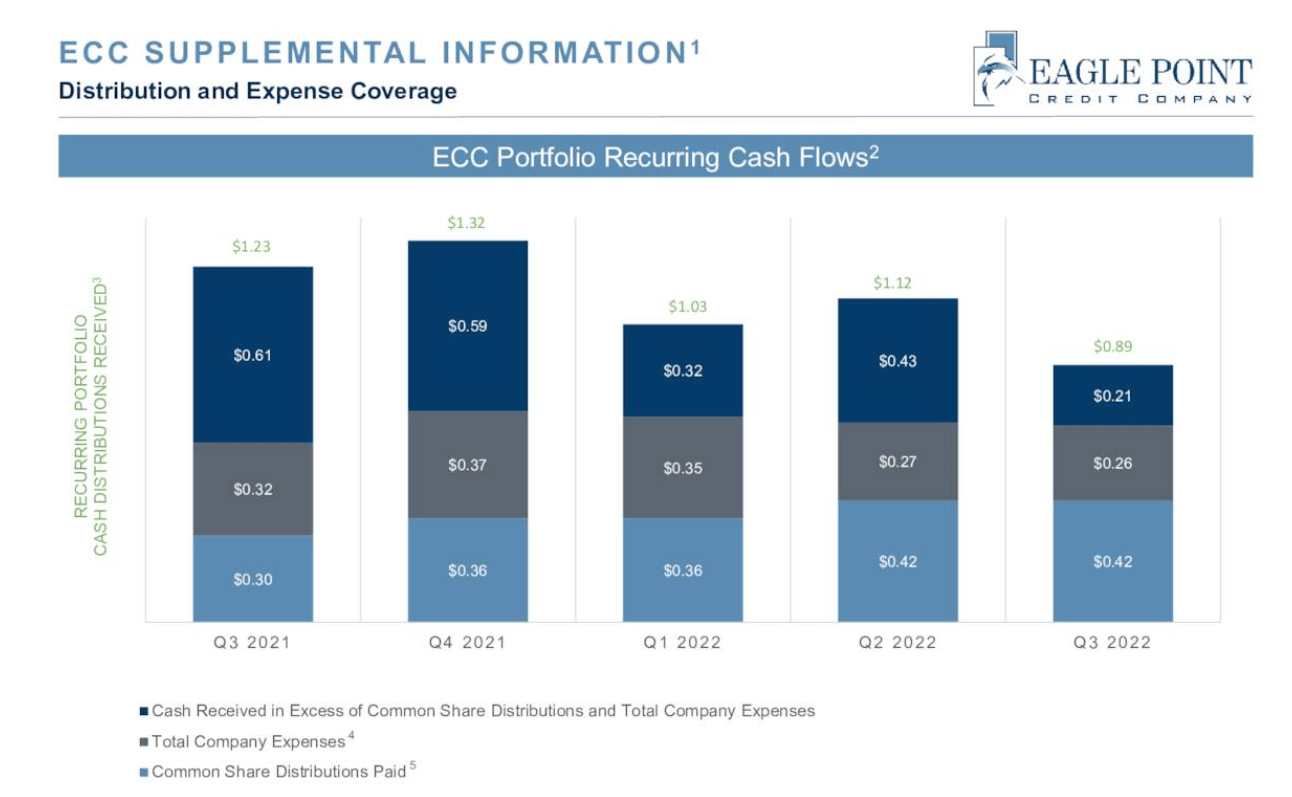
Another piece of the puzzle is the underlying loan maturity profile. Some potential investors only look at the NAV or market price charts and then conclude that something must be wrong and that this high level of income generation cannot continue. Between now and 2025, only 7% of the underlying loans in the CLOs held by ECC will mature. What that means is that unless the default rate increases dramatically from current low levels, that those loans will continue paying interest for many years to come, helping to maintain the strong cash flows that ECC is currently realizing.
Meanwhile, new CLOs are being purchased or reinvested at higher credit spreads, further increasing the long-term income potential of the ECC holdings. Defaults on leveraged loans have begun to slowly rise as some have feared, however, that increase is still small and does not indicate a major problem yet but is something to watch in the future.
Again, CEO Majewski addressed this concern on the earnings call:
As we have foreshadowed on several calls, leveraged loan defaults have begun to slowly rise, with a total of 6 loans defaulting in the third quarter of 2022. Notably, there were no loan defaults in October. At quarter end, the trailing 12-month default rate stood at 90 basis points, still well below the historic average. During the third quarter, 2.6% of loans outstanding repaid at par. To frame it, this is over a 10% annualized pace and provides our CLOs with par dollars to reinvest in today’s discounted loan market.
Portfolio turnover in the case of ECC has provided some good opportunities this year as credit markets vacillate between higher credit spreads and lower par values on loans in the secondary market. Again, in answer to a question from an analyst on the call, CEO Majewski addressed this issue by explaining that the vast majority of new CLO investments have taken place in the secondary market.
In terms of and still able to reinvest in capture and to your point so loans, loans index probably $0.92, $0.93 on the dollar right now, depending on which index you look at. The 10% prepayment rate that we are seeing on loans is about the low that we have seen over the history of the loan market in my recollection. That said, if you are getting 10% of your money back and you can reinvest at $0.92 that still helps – that helps you build 80 basis points of par through the course of the year. If you just assume $0.50 recoveries on loans to be conservative, that’s 1.6% default is offset through that discounted buying. So even though that 10% is much lower than the long-term average of 30% per annum on prepayments, even at that low rate, it still gives you plenty of optionality to keep reinvesting within the CLOs.
In general, CLO trading volumes have been increasing over the past 5 years, and 2022 is no exception. Investment grade rated CLO tranches make up the largest majority of those transactions, and the increasing trading volume offers additional opportunities to take advantage of the kinds of reinvestment and repricing opportunities in the secondary market in particular that he mentioned in the call.
ECC Q322 earnings presentation
Through October 31, the fourth quarter recurring cash flows from portfolio investments amounted to $31.2 million, compared to $40.8 million for the entire third quarter. Some of the fourth quarter payments are expected to be received later in the quarter according to company CFO Ken Onorio. Also, as of October 31, the company had $23.4 million in cash available for investment.
The company’s NAV estimate as of October 31 was between $9.66 to $9.76 compared to $10.23 at the end of September, which represents about a 5% decrease. ECC raised capital via the shares issued in the at-the-market program, which added approximately $0.06 to the NAV.
We also continue to raise capital through our at-the-market program and issued over 4 million common shares at a premium to NAV generating an accretion of $0.06 per share for all shareholders.
Some have commented that the NAV for this fund has dropped considerably in the 8 years since the IPO. However, as the CEO pointed out in his comments on the earnings call, the price volatility of CLOs over the past 3 years has resulted in extreme swings in the NAV. Currently, ECC sports an NAV that is very close to what it was 3 years ago, pre-Covid as illustrated in this chart from CEFconnect.
NAV/Price history (CEFconnect)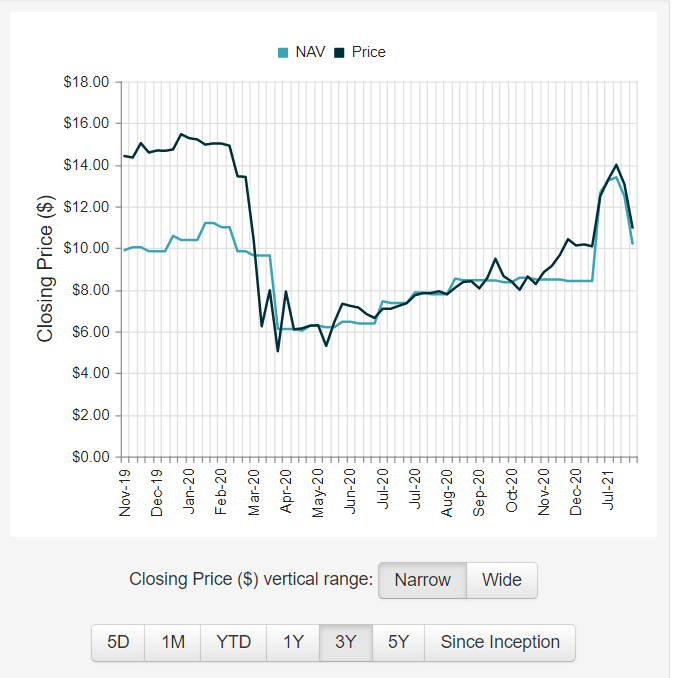
Cash, GAAP, and Tax – the 3 Masters
One additional point to make is that the idea of spillover income for ECC is difficult for many to comprehend when the NAV appears to be falling, and GAAP income is not necessarily the same as taxable income. GAAP net income for the quarter was reported at $9.7 million, or $0.21 per share. NII (net investment income) plus realized gains equaled $0.47 per weighted average common share. In response to another analyst’s question on the earnings call, CEO Majewski explained the reasoning behind the variations each year in GAAP versus taxable income and how they determine whether to declare special or supplemental distributions.
So, there is three things, three masters, we live by, cash, GAAP and tax. Obviously, the number one answer is just make that cash flow the highest as possible and probably everything else will work itself out if we are successful there. Over the life of every CLO equity investment, cash and GAAP and tax will equal each other. However, in any given year and my experience, they have never been equal. So, if you look back and ECC’s history, there has been years where we have had 75% of the distribution plus be a return of capital, right 80%, even in 1 year, a few years ago. And in other years, we have had taxable income well in excess of our GAAP income.
Let’s say CLOs keep paying their payments nicely, but there is a bunch of defaults. You could actually get a lot of cash out of a CLO, but have no taxable income in that year. That’s kind of cool. Obviously, cash without current tax is great. At the same time, an extreme case a CLO could pick, then you fail the CCC with massive CCCs, but no defaults and keep getting taxable income without cash. That’s obviously bad. That doesn’t happen too often, though. The other thing that goes on in CLOs is when we do a reset or refinancing, we get to take a write-off, a tax deduction. For the previously unamortized issuance costs related to the CLO debt, we are retiring in the refi or reset. The last year, in fiscal ‘21, when it was reset refi mania here and we did again over 30 corporate actions if my memory serves. That created a lot of what I will call non-cash tax deductions.
… we have to pay out substantially all of our taxable income within roughly 10 months of the end of the tax year.
So, there you have it folks. The CLO portfolio that ECC manages is generating far more taxable income than they have been paying out this year, and it appears that is likely to continue well into the fourth quarter and most likely well into the first quarter or even the first half of next year. The market for CLO transactions is strong and opportunities abound for increasing the weighted average remaining reinvestment period for existing CLOs, while buying new ones or reinvesting at higher yields in the secondary market.
If you are seeking a high yield income stream that looks likely to continue, with additional special distributions on top of the regular monthly distributions, then ECC might be worth a spot in your portfolio. I am very long ECC in my No Guts No Glory portfolio, and I like the sister fund, Eagle Point Income (EIC) also. In fact, EIC just increased the regular monthly distribution starting in January 2023, from $0.14 per share monthly to $0.16, which represents a 14% increase in the distribution. That ticker may be the subject of a future article but meanwhile, check it out and see if you like that fund, too.
Be the first to comment