

Olivier Le Moal
Thesis
The Allspring Income Opportunities Fund (NYSE:EAD) is a closed-end fund focused on fixed income. The vehicle invests mainly in high-yield bonds and leveraged loans from North American issuers. The fund has current income as its main objective with capital appreciation as its second goal. EAD used to be in the Wells Fargo Asset Management division until the company sold that business in 2021:
In one of the largest asset management deals in a decade, the $603 billion Wells Fargo Asset Management business is being acquired by two private equity firms for $2.1 billion. The asset management business had been viewed as up for sale for several months.
The deal, which is expected to close in the second half, transfers ownership of the global asset management business, which employs more than 450 investment professionals from Wells Fargo & Co. to GTCR and Reverence Capital Partners. According to the terms of the deal, Wells Fargo & Co. will retain a 9.9% equity interest and will continue to serve as an “important client and distribution partner.”
The vehicle focuses on leveraged loans and high-yield bonds and runs a modest duration of 3.8 years. EAD is down -25% year to date on the back of higher rates and wider credit spreads but finds itself in the middle of the cohort when compared to other fixed income CEFs from large asset managers.
The vehicle has a managed distribution policy that targets 8% of NAV with an annual reset. Its long-term performance (when normalized for the 2022 drawdown) points to annual total returns in the 6% to 7% range. The fund does not take excessive credit risk, with the vast majority of the names in the “BB” and “B” buckets. The fund is the definition of a “classic” leveraged loan / high-yield bond CEF, employing 30% leverage and a granular, diversified approach when constructing its portfolio.
The fund is not exciting but a Volvo of fixed income CEFs. After a tough 2022, expect a bright 2023 as the Fed ends its tightening and credit spreads start normalizing.
Holdings
The fund has 303 holdings across high-yield bonds and leveraged loans:
Characteristics (Fund Fact Sheet)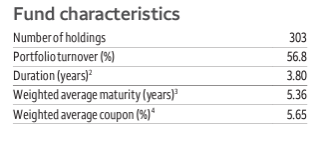
We can see that duration is contained at a small figure due to the floating rate nature of leveraged loans. Similarly, due to its composition, the fund has an asset base weighted average maturity which is on the low side. Generally speaking, high-yield issuers tend to place paper with a maturity of 5 years and due to the high cost associated with longer maturities and market’s appetite for longer-dated high-yield paper – leveraged business models change fast, and nobody wants to hold long-dated debenture to a business that might look quite different down the line.
The fund has a middle-of-the-road credit allocation, with most of the credits residing in the “BB” and “B” buckets:
Credit Rating (Fund Fact Sheet)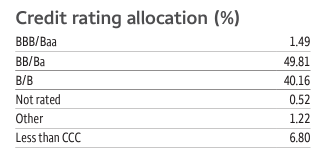
This is a conservative high-yield allocation, with no significant “CCC” exposure. Just a classic high-yield fund. From a sectoral allocation perspective, the vehicle is overweight “Consumer discretionary”:
Sector Allocation (Fund Fact Sheet)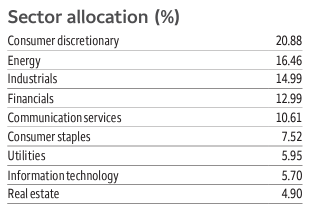
In our view, any sector with a concentration above 15% is an overweight position. Energy is barely above 15% but represents the second largest exposure in the fund. From an individual name perspective, the fund is very granular:
Top Holdings (Fund Fact Sheet)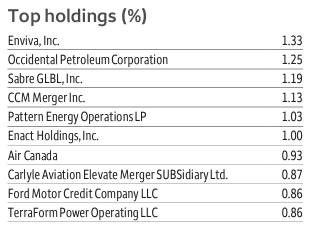
We can see from the above table that no holding breaches a 2% level, and most of them are under 1% of the fund. That represents a well-diversified, granular composition for this vehicle.
Performance
The fund is down -25% year to date, mirroring the S&P 500 performance:
YTD Total Return (Seeking Alpha)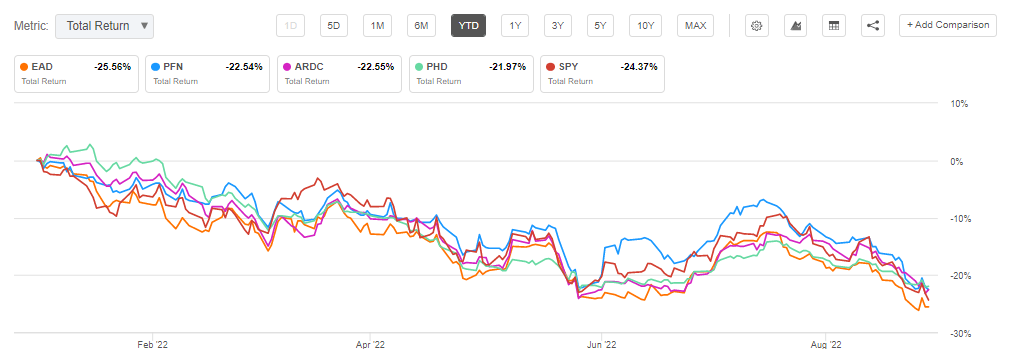
We are comparing EAD here with a number of other high-yield CEFs from premier asset managers, and the fund is in the middle of the cohort. It is interesting to note the almost identical correlation between the CEFs and the S&P 500. On a total return basis, they have the same total return profile. Despite getting dividends, equity investors in CEFs are getting the same return as having invested in the S&P 500.
On a 5-year basis, EAD outperforms:
5Y Total Return (Seeking Alpha)
All the longer-dated charts are not looking good now due to the massive drawdown that has occurred in 2022. Let us have a look at the fund’s performance per year:
Total Returns (Morningstar)
We can see that in “normal” years, the fund posts an annualized performance in the 6% to 7% range, while in years post a recession, the total returns are around 20%. The fund is cyclical given its composition, and we should expect a nice 2023.
Distributions
The fund has a managed distribution plan that targets 8% of NAV:
Distributions (News Release)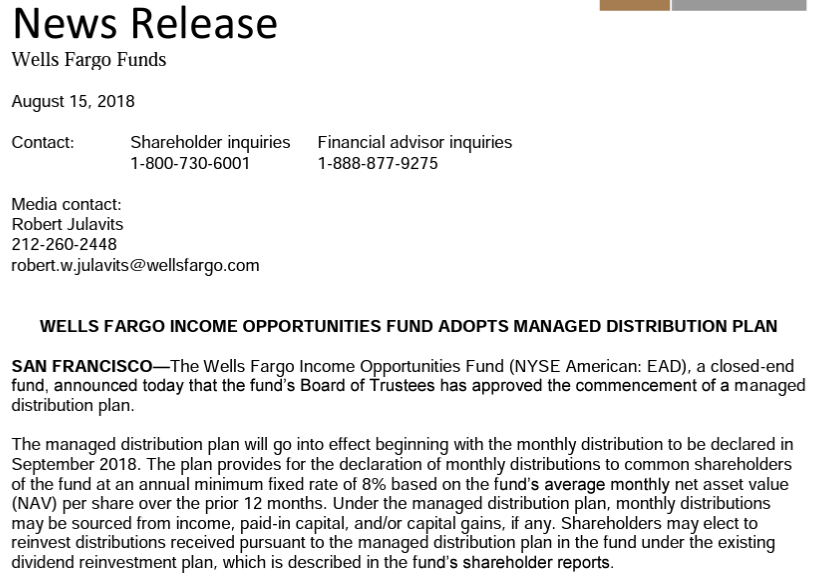
At the end of the day, that translates into a low utilization of ROC (if any) and a dividend yield that is going to reset lower if the NAV decreases. We have seen cuts before:
Dividend (Fund Fact Sheet)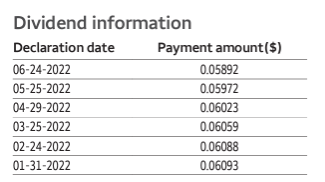
As per Morningstar data, the fund has not been using any ROC:
Annual Distribution (Morningstar)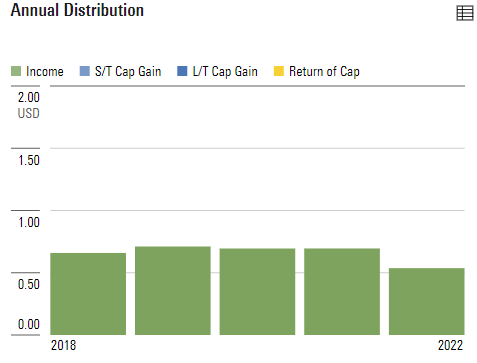
Premium / Discount to NAV
The fund usually trades at a discount to NAV:
Premium/Discount to NAV (Morningstar)
We can see from the above table that on average, the fund trades at -10% discount to net asset value. We believe this is a large figure and the fund’s performance should warrant better levels, but the asset manager needs to engage in proactive corporate actions to bring this closer to NAV.
In the past year, the fund has traded with a high correlation to the risk-on/risk-off environment:
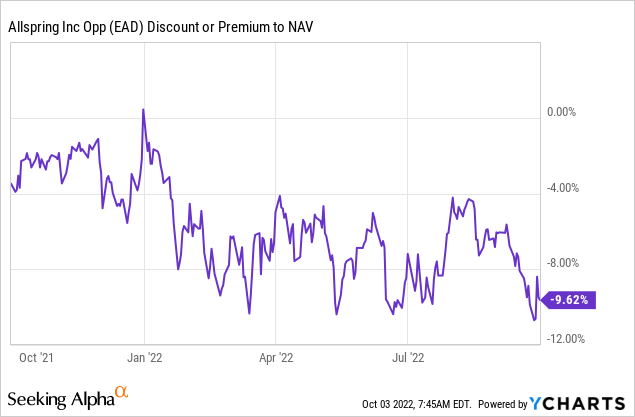
During times of market calm or stock rallies, the discount has narrowed to -4%. During bouts of risk-off, the vehicle has moved toward the -10% historic average.
Conclusion
EAD is a fixed income CEF. The fund used to be part of the Wells Fargo Asset Management business until 2021 when the division was divested. The fund is a classic leveraged loan/high-yield bond CEF that employs 30% leverage and a granular and diversified portfolio construction approach. Expect a long-term annualized total return in the 6% to 7% range here with a standard deviation of 12, lower than the S&P 500. The fund is currently trading close to its long-term annual discount average of -10% and has seen its discount fluctuate with the risk-on/risk-off environment. Just like in the past, after a tough 2022 driven by higher rates and wider credit spreads, expect a bright 2023.
Be the first to comment