

We Are
SPDR S&P International Dividend ETF (NYSEARCA:NYSEARCA:DWX) is an exchange-traded fund that invests in high-yield dividend stocks: the fund invests in “the 100 highest yielding international common stocks that have passed certain sustainability and earnings growth screens”. Single countries and single sectors are both capped to 25% each to allow for greater diversification, while emerging markets are capped at 15%, and no single stock is allowed to represent more than 3% of the fund. The expense ratio of fund is 0.45%, with net assets under management of $516 million as of November 10, 2022.
That follows stable net fund flows over the past year (see below), possibly indicating some investor ambivalence or uncertainty.
ETFDB.com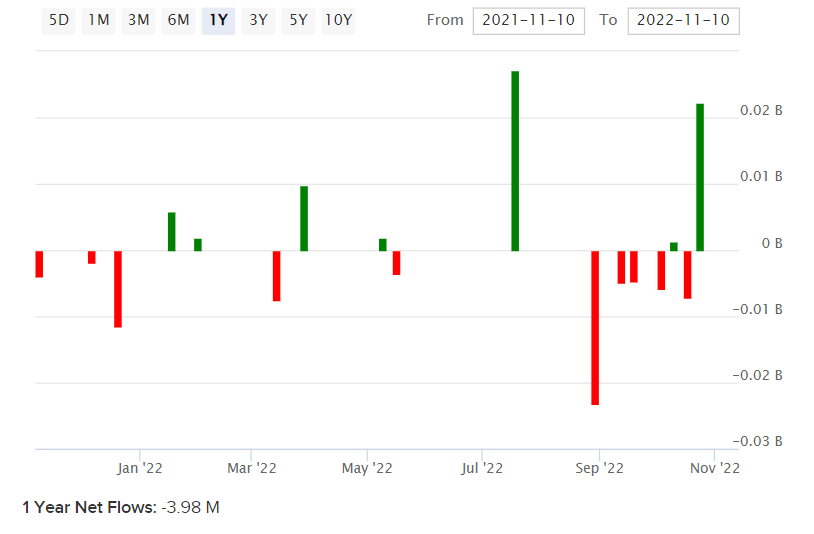
DWX itself, on a five-year historical basis, carries a beta of about 0.88x. Year-to-date, the fund has fallen by -17.55% vs. the S&P 500 U.S. equity index of -16.75%. In other words, DWX has fallen by roughly as much as the S&P 500 index. However, the fund’s yield is higher than the S&P 500 on average; 4.19% as calculated by SPDR as of November 10, 2022 on a 30-day SEC yield basis.
Dividend stocks are characteristically for more risk averse investors. I would argue that dividend stocks, if the dividends are reinvested, are perhaps not a great investment strategy intrinsically since the net outcome is very similar. Sometimes there are tax benefits, but if you look at total underlying earnings power of a portfolio, your gross rate of return is going to be similar no matter how that return is channeled into your account. Further, sometimes dividends are less tax efficient as compared to alternatives, hence why many companies choose to retain earnings and/or commit to share buybacks.
Companies that pay higher rates of dividends on their earnings tend to be lower-growth companies that are not able to grow and scale their balance sheets at historic returns on equity. In other words, they are usually in mature and competitive or low-growth industries in which they are forced (by sensible capital allocation policies) to distribute earnings to shareholders rather than reinvest in ever lower-return projects. So, high-yielding stocks are quite similar to “value stocks”. Nevertheless, as mentioned earlier, they are also for this reason viewed as lower risk, as their business models are thought to be more predictable. This often leads to a lower beta, and thus on a total return basis they can be attractive during recessionary periods.
Fidelity research suggests that much of the world is currently heading into a contractionary period in the present business cycle. That tends to make funds like DWX more appealing. However, as I have discussed in other recent articles, because markets are forward-looking by at least 6-12 months it is likely beginning to become risky to invest in so-called “lower-risk” assets on the basis of opportunity cost.
Fidelity.com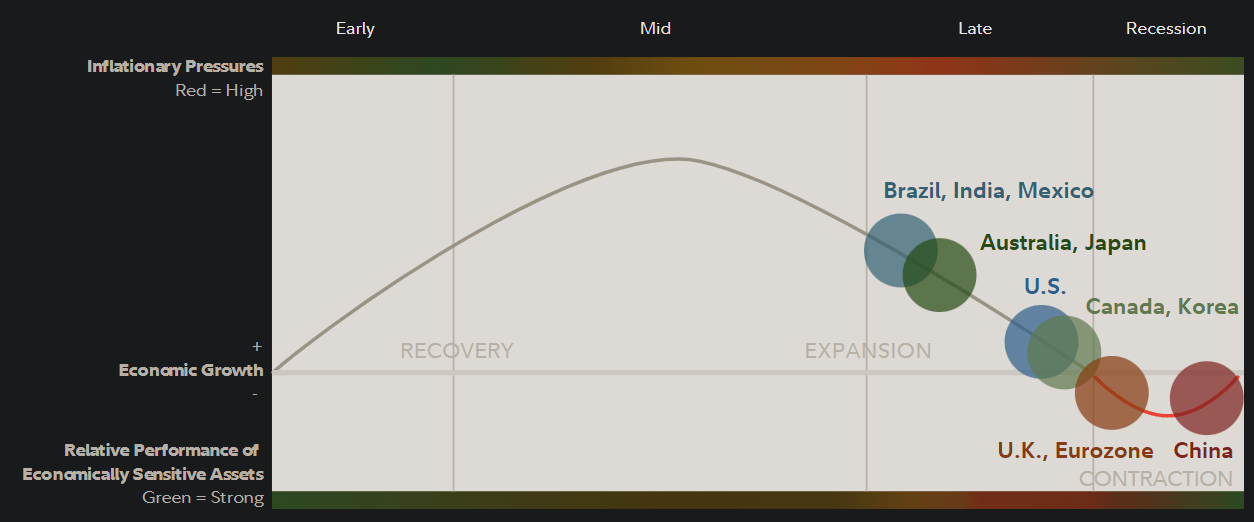
The chart above is as of Q4 2022. If the United States and Canada head into a recessionary period following the eurozone, and if the average recession is less than 12 months, the market is probably already bottoming. That means higher-beta assets are likely to start out-performing. DWX is not a high-beta asset.
Nevertheless, we can still value DWX even if might not be cyclically attractive. The fund’s benchmark is a better approximation of underlying earnings power as many data sources often provide more favorable adjusted measures; factsheets for S&P indices tend to be less forgiving. DWX’s benchmark is the S&P International Dividend Opportunities Index. This index, as of October 31, 2022, reported trailing and forward price/earnings ratios of 10.13x and 11.18x, respectively, which implies negative earnings growth on a forward basis. The price/book ratio was 1.1x, with an indicative dividend yield of 5.43%. These figures imply a forward return on equity of just 9.84% and a forward earnings yield of 8.94%. The dividend distribution rate is circa 55%.
A good approximation of longer-term returns for an ETF is the range that you can find by taking the lower and higher of the portfolio return on equity and forward earnings yield, in this case 8.94-9.84%, or 9-10%. That is a decent return, especially for a low-beta fund. However, we will proceed to value the fund as a whole.
Firstly, we should choose a risk-free rate. While DWX is international, the fund is invested in some countries with very low bond yields, such as Japan. Therefore, to be more conservative in estimating the underlying equity risk premium, I am going to take the current U.S. 10-year yield of 3.81%. I am also going to assume a longer-term return on equity of about 9%, and this equates to modest earnings growth of just over 2% after an initial forecasted dip in earnings. Due to this dip in earnings, the three- to five-year average earnings growth rate actually comes out negative, which is significantly worse than Morningstar‘s headline consensus estimate of 6.95% for DWX over the same time period. Nevertheless, I am comfortable taking a more conservative estimate, guided initially by the fund’s benchmark index’s factsheet.
Assuming a constant earnings multiple, my basic inputs generate a model implying IRR potential for DWX of just over 9%.
Author’s Calculations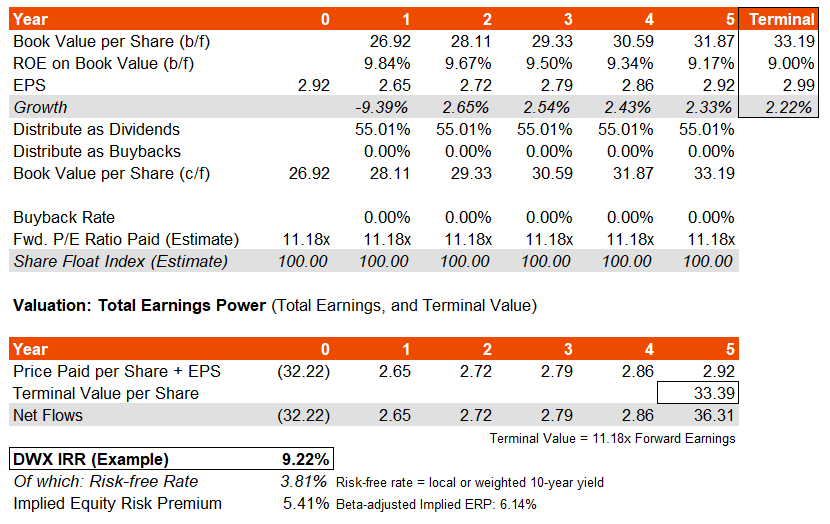
That is good, and right around my 9-10% estimate I suggested earlier. The underlying equity risk premium is some 5.4%, which is also within a healthy 4.2-5.5% range that I would expect for developed equity markets. Actually, on a beta-adjusted basis, the ERP might be over 6%. That would suggest some material under-valuation.
I suppose the long-term trajectory is less appealing though. At a steady return on equity, the long-term earnings growth potential is low for this portfolio. Assuming a long-term growth rate of 0-2% (at “maturity”), and an ERP of 5.5%, with a risk-free rate of say 4% (high and probably too conservative, but using this as a base), the long-term earnings multiple might be in the 10.53-13.33x region. The current multiple of 11.18x therefore seems fair. I see no long-term uplift in the earnings multiple, and I sense some risk in buying into a fund that has low long-term growth prospects. The fund is over-weight defensive sectors, as well as financial services (see below).
Morningstar.com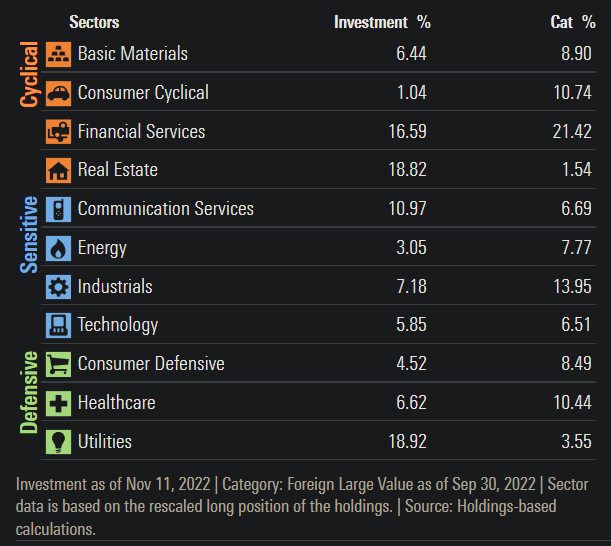
Cyclically speaking, there is not much to find attractive about DWX. Therefore, in summary, while I do think DWX is probably modestly undervalued, and offers a decent headline IRR, due to cyclical concerns and the lack of growth potential I would argue a neutral stance at present. Nevertheless, DWX looks like a low-risk, potentially lower-beta option (on a total-return basis) for risk-averse investors toward the end of the average business cycle. Now, I think it is probably too late to benefit from this profile.
Be the first to comment