

Editor’s note: Seeking Alpha is proud to welcome Austin Hankwitz as a new contributor. It’s easy to become a Seeking Alpha contributor and earn money for your best investment ideas. Active contributors also get free access to SA Premium. Click here to find out more »
hapabapa
The Investment Thesis
My investment thesis for Dutch Bros (NYSE:BROS) 12-months ago was two-fold: the company had best-in-class margins and a country-wide growth plan.
Today, inflation has begun to eat into those margins and their country-wide growth plan might not be as appealing as it once seemed.
Let’s Rewind
I was very excited for Dutch Bros to hit the public markets in 2021. The company seemed to be experiencing sales momentum across the country, their management team was firing on all cylinders, and their grand plan to open 4,000 locations by 2036 seemed achievable.
However, it’s been almost 12 months now since their IPO — they’ve shared a handful of quarterly earnings reports, participated in numerous investor conferences, and more importantly inflation has taken a toll on their brick-and-mortar business.
In this post, I want to revisit the company’s progress toward their 4,000 store goal knowing upon IPO they had best-in-class margins and growth potential.
An Update on Their Margins
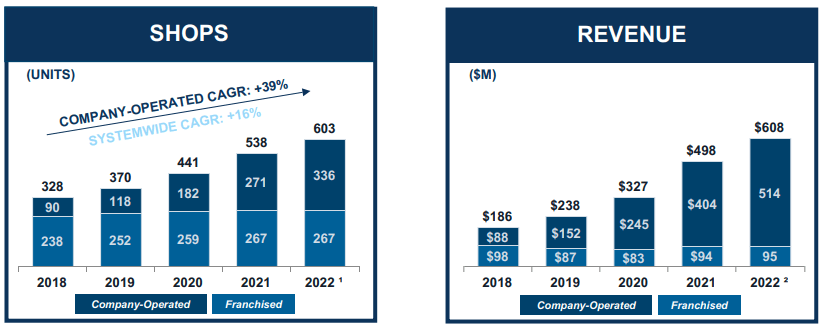
The company ended 2021 with 538 shops across 12 states — a +45% increase since 2019.
During the same period of time, revenue grew from $239.4 million in 2019 to $497.9 million in 2021, representing a +44.5% compounded annual growth rate. Adjusted EBITDA grew from $48.7 million to $82.1 million, and the company was able to produce a 25.1% contribution margin against these 2021 figures.
According to their most recent earnings report, the company is currently operating 603 shops across the country.
Throughout Q1 they opened +34 shops, and in Q2 they opened another +31 — representing a +12% increase to their total shop count.
Despite increasing their shop count by only +12%, their quarterly revenue has increased +33% — creating a compounding effect of sorts.
In a “normal world,” adding one shop to the roster would have linear impact on revenue generated. However, Dutch Bros is proving that each shop they add to their roster is having exponential impact on revenue.
Dutch Bros Q2 Investor Presentation
Q1 2022
In Q1 we learned about the headwinds Dutch Bros was facing because of inflation. Adjusted EBITDA came in at only $9.7 million compared to the Street’s expectations of $13.3 million. BROS claims the margin compression was catalyzed by a few things:
-
Not raising prices on their customers
-
Higher-than-expected inflation and cost of goods — specifically for dairy
-
Pull-forward of delayed maintenance of shops due to COVID
-
Opening shops wicked fast — faster than expected due to high demand
The company’s CFO goes on to describe the cost pressures they encountered — citing the price of dairy having increased +25% throughout Q1. Input costs, similar to dairy, ate away -4.8% of their contribution margin during the quarter. Labor costs ate away another -2.4% (higher training costs, over-time, and legislated minimum wages in states like California, Arizona, and Washington).
Their weighted beverage, food, and packaging cost basket increased +12% year-over-year in Q1.
The combination of margin pressure from ingredient cost and higher labor cost resulted in margin compression of -720 basis points.
On the flip side — Dutch Bros began to realize G&A leverage during Q1. Their total G&A increased by +26% compared to revenue growth of +54%. As a percentage of total revenue, G&A was 29.7% versus 36.4% in the first quarter last year.
The above is why we saw the stock sell-off violently after Q1 earnings were reported. Investors, including myself, were worried their best-in-class margins were deteriorating. However, things began to turn around in Q2.
Q2 2022
In Q2 we begin to see a completely different story than described just three months prior. They experienced a +3.9% bump in contribution margin improvement when compared to Q1 due to their pricing increases and operational improvements, mainly labor.
On June 1, the company completed their second round of price increases since 2019 — as alluded to in their Q1 earnings call. Their CFO explained these price increases haven’t yet fully materialized, leaving room for further margin expansion in the future.
A staged menu price increase that we completed June 1, which helped margins in Q2 but importantly has not yet delivered its full impact…
The company also mentioned that despite same-store sales declining in March, they’ve since normalized in June and July. This is encouraging given the higher menu prices.
During this quarter, the company achieved $1B in trailing 12-month revenue for the first time ever.
An Update on Their Growth
In 1992, Starbucks had 165 stores. In 2000, they had 3,500 stores.
Starbucks was able to 21X their store count in only 8 calendar years. I’m not saying Dutch Bros will be able to scale this quickly — but as we all know, scaling their business to 4,000 locations across the country is their long-term game plan.
And it makes a lot of sense!
Dutch Bros unit economics are best-in-class. Throughout 2021, the company’s average unit volume (the average of a store’s total sales for a 52-week period) came in around $1.7 million.
According to their most recent quarterly earnings report, this figure is now north of $2.1 million per location — or about +10% higher than it was 6 months ago. Their CEO also confirmed that their new stores are reaching margin maturity within the first 9-12 months of opening.
This AUV figure seems to have been positively impacted by their strategic location openings across the country — like their Arizona and California locations that are doing $2.4M and $2.5M, respectively.
It’s actually a really interesting growth strategy. The company scouts an area where they want to open a store, open it, then by observing demand on a weekly, monthly, and quarterly basis will act quickly to open more stores in surrounding areas.
I’ve personally seen this happen in Nashville, TN. One Dutch Bros opened, then two more immediately after. Their CEO directly mentioned the strength their Nashville locations are seeing during the company’s Q1 earnings call.
Here’s a video of me visiting my local Dutch Bros.
As mentioned above, the company added +65 new shops to their roster YTD and are track to open ~130 during the calendar year. These shops begin to hit contribution margin targets by the end of their second year, which is why you see parabolic growth to the bottom line over time.
Their growth targets seem to remain intact and are humming right along.
Is Dutch Bros Coffee a BUY?
Yes and no — let me explain.
Controlling the Controllables
One of my favorite things to observe in a business is if their management team is able to effectively “control the controllables.” In Dutch Bros’ case — they seem to be doing this very well.
The main “factor” out of their control (that eats into their bottom line) is inflation. However, this has been market-wide. Despite this, their management team has demonstrated their ability to identify specifically what inflation-driven cost is disrupting their business most (dairy and freight), and then do their best to swiftly combat the problem.
Sure, their solution was to incrementally raise prices on their customers, but the action worked. In Q2 they were able to realize a +3.9% bump in contribution margin because of this action (supplemented by other cost-cutting efficiencies).
If Dutch Bros is able to continue to control costs, including labor (best-in-class turnover rates far below industry average), I firmly believe this paired with G&A leverage and incrementally higher AUV will result in an exponentially growing bottom line in the coming years.
Dutch Rewards Program
The Dutch Bros app surpassed 4 million users in Q2, with 2.6 million 90-day active users as of June 30th. In Q2 alone they added +450K new 90-day active members — equating to ~4,000 active members per shop location.
Reward programs are powerful.
We all know what happened with Starbucks’ rewards program .. it turned into a bank account! (sort of). The company reported $1.7 billion in cash just sitting in their rewards app waiting for customers to spend. Here’s a video of me explaining this concept on my TikTok.
In Q2, roughly ~63% of all transactions came from Dutch Rewards members. Think about that — more than half of all transaction volume experienced in the quarter came from customers who purchase coffee from the company often enough to download the app to collect reward points.
The company mentioned the evolution of the Dutch Rewards Program in their earnings call — stating they’re beginning to test targeted activations on lapsed users, and the early results are encouraging.
Finally, they began offering “Dutch Passes” to those within the app — allowing customers to preload money into their app. This has proven to lead to faster transaction times and a +10% increase in average ticket size per customer.
Valuation and Conclusion
At $40 / share the company is hovering around a ~$6.5B market cap. This means the stock is trading at ~43X 2023 EBITDA .. which is absurd. As the Federal Reserve continues to hike interest rates, we’ll continue to see valuation multiples compress across the board — and I don’t think BROS is out of the woods just yet with this.
Sure — the company seems to be doing a great job at controlling the controllables, growing quickly, and fostering reward relationships with customers. But, it’s irresponsible to ignore their current trading multiple.
If we look forward 10-15 years and assume they’re able to hit this 4,000 store count goal (225+ store opens per year) they’ll be doing ~$9-10B in annual revenue. This leaves us with ~$1.5B in adjusted EBITDA — which sounds great! But considering Starbucks is trading at ~15X forward adj. EBITDA right now and they’re a “mature” company (like BROS will be in 15 years) that begins to put a lot in perspective.
If we assume BROS can command a 20X adj. EBITDA multiple in 15 years on their ~$1.5B, they’ll be trading around ~$185 / share — representing a +11.5% compounded annual growth rate.
Does that outperform the market? Sure — the market does +10% per year or so, on average. But is Dutch Bros a “screaming buy” at $40 / share? Not exactly.
However, if BROS begins to trade at or below $30 / share this CAGR jumps to +14% — which is much more interesting. In June, the stock hit a 52-week low of $25 / share, so it could happen.
All-in-all, I hold stock in Dutch Bros Coffee. I’m a customer, a shareholder, and a believer of the long-term vision. At $40 / share I’ll consider nibbling at it, but nothing to get very excited about. At $30 / share and below, the stock becomes incredibly more interesting to me.
Risks
If the company is unable to get back to their best-in-class margins, this thesis doesn’t exactly play out. That’s impacted specifically by elevated input costs driven higher by inflation.
If the company isn’t able to continue growing aggressively (225+ new coffee shops per year, on average) this thesis crumbles. Their management team has stated time and time again their long-term vision is to be operating 4,000+ coffee shops across the country. If that doesn’t happen, their operating leverage and exponential growth to their bottom line doesn’t happen.
Be the first to comment