

MadamLead
Thesis and Background
Readers familiar with our writings know that we are overall very cautious about the utility sector under the current conditions. The sector has been considered a safe haven sector by traditional wisdom. However, as you will see in the next section, the sector currently is one of the riskiest sectors in our view. Interest rates act as the gravity on all asset valuation, especially on the utility sector given their reliance on debt financing and relatively heavy leverage.
Of course, sometimes a sector is overvalued only because a few component stocks are extremely overvalued and cause the whole sector’s valuation out of whack. And in this case, there is no problem to invest in the sector – you just need to avoid those few stocks.
You will see that it is not the case here with the utility sector after we examine two specific stocks in this sector: Duke Energy (NYSE:DUK) and NextEra Energy (NYSE:NEE). They are the top two leading stocks in the sector, represented by Utilities Select Sector SPDR Fund (XLU). Combined, they represent more than ¼ of the sector (25.5% to be more exact). And as you will see later, they are both overvalued by a substantial margin (somewhere between 20% to 30%) relative to their historical valuations. Their valuations are also significantly above the overall market, yet their profitability and growth potential are only a fraction of the overall market. As such, my view is that their valuation and risk premiums are too high under current conditions. And I see very unfavorable odds for them to keep up with the overall market in the years to come.
However, they do have their advantages given their leading scale and generous dividends. For investors who are more income-oriented, our results show that Duke is a better option among these two. It offers a higher current income (3.57% dividend yields vs. NEE’s 1.83%), a lower valuation premium (about 20% overvaluation vs. NEE’s 30%), and a slightly higher total return potential (about 6% per annum vs. NEE’s 4.3%).
And next, we will elaborate on these key points one by one in more detail.
Yahoo Finance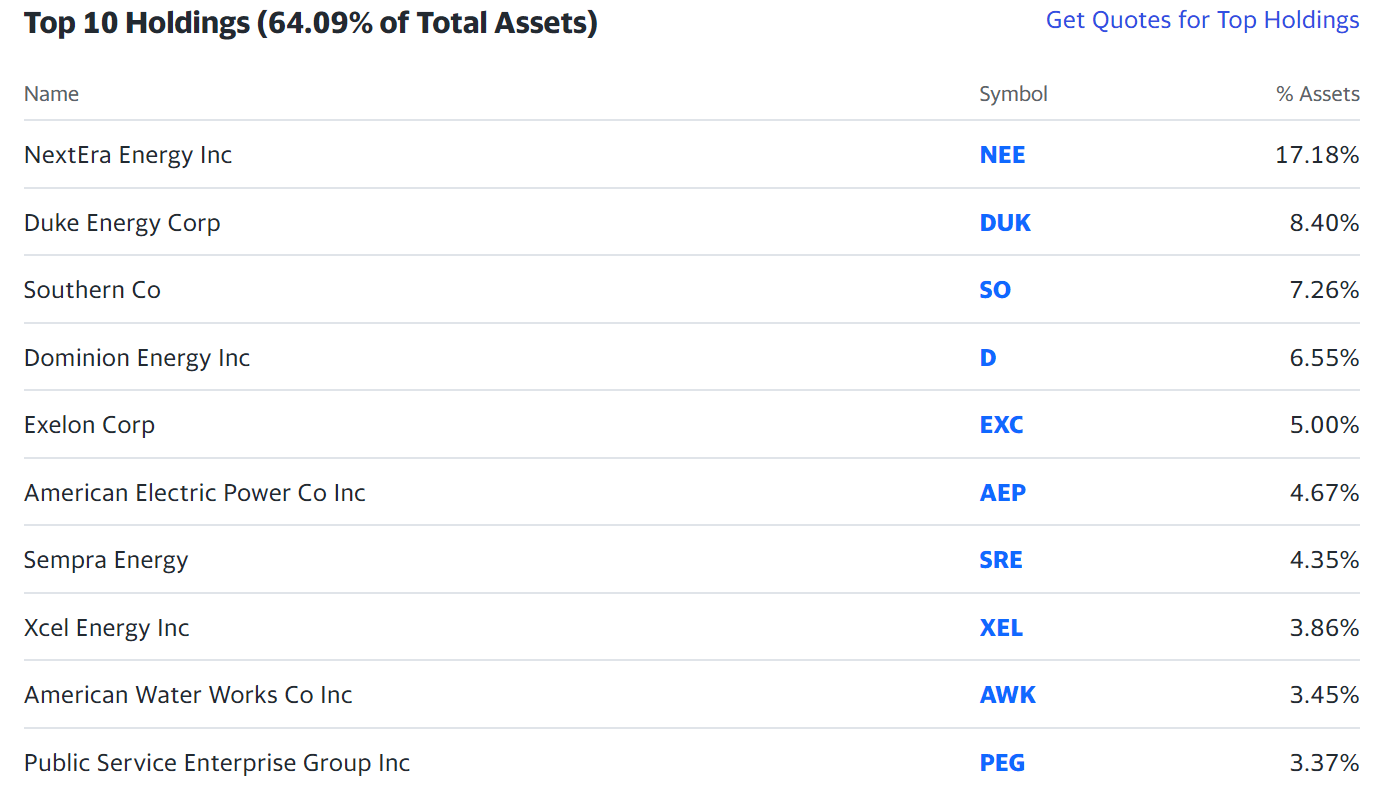
Overview of utility sector, DUK, and NEE
As you can see from our following market dashboard (and you are welcome to download it here), the utility sector represented by XLU is currently the more overvalued market sector based on its yield spread relative to the risk-free rates. Its yield spread is below the historical average and is near a dangerous level in our view as indicated by the extremely negative dividend spread yield Z-score (-2.26). At the same time, its current dividend yield is also below its historical average by a good margin, by approximately 41% (as indicated in the negative dividend yield Z-score of -0.41). Interest rates act as the gravity on all asset valuation, and the Fed is very likely to keep increasing rates at the upcoming Jackson Hole meeting.
Author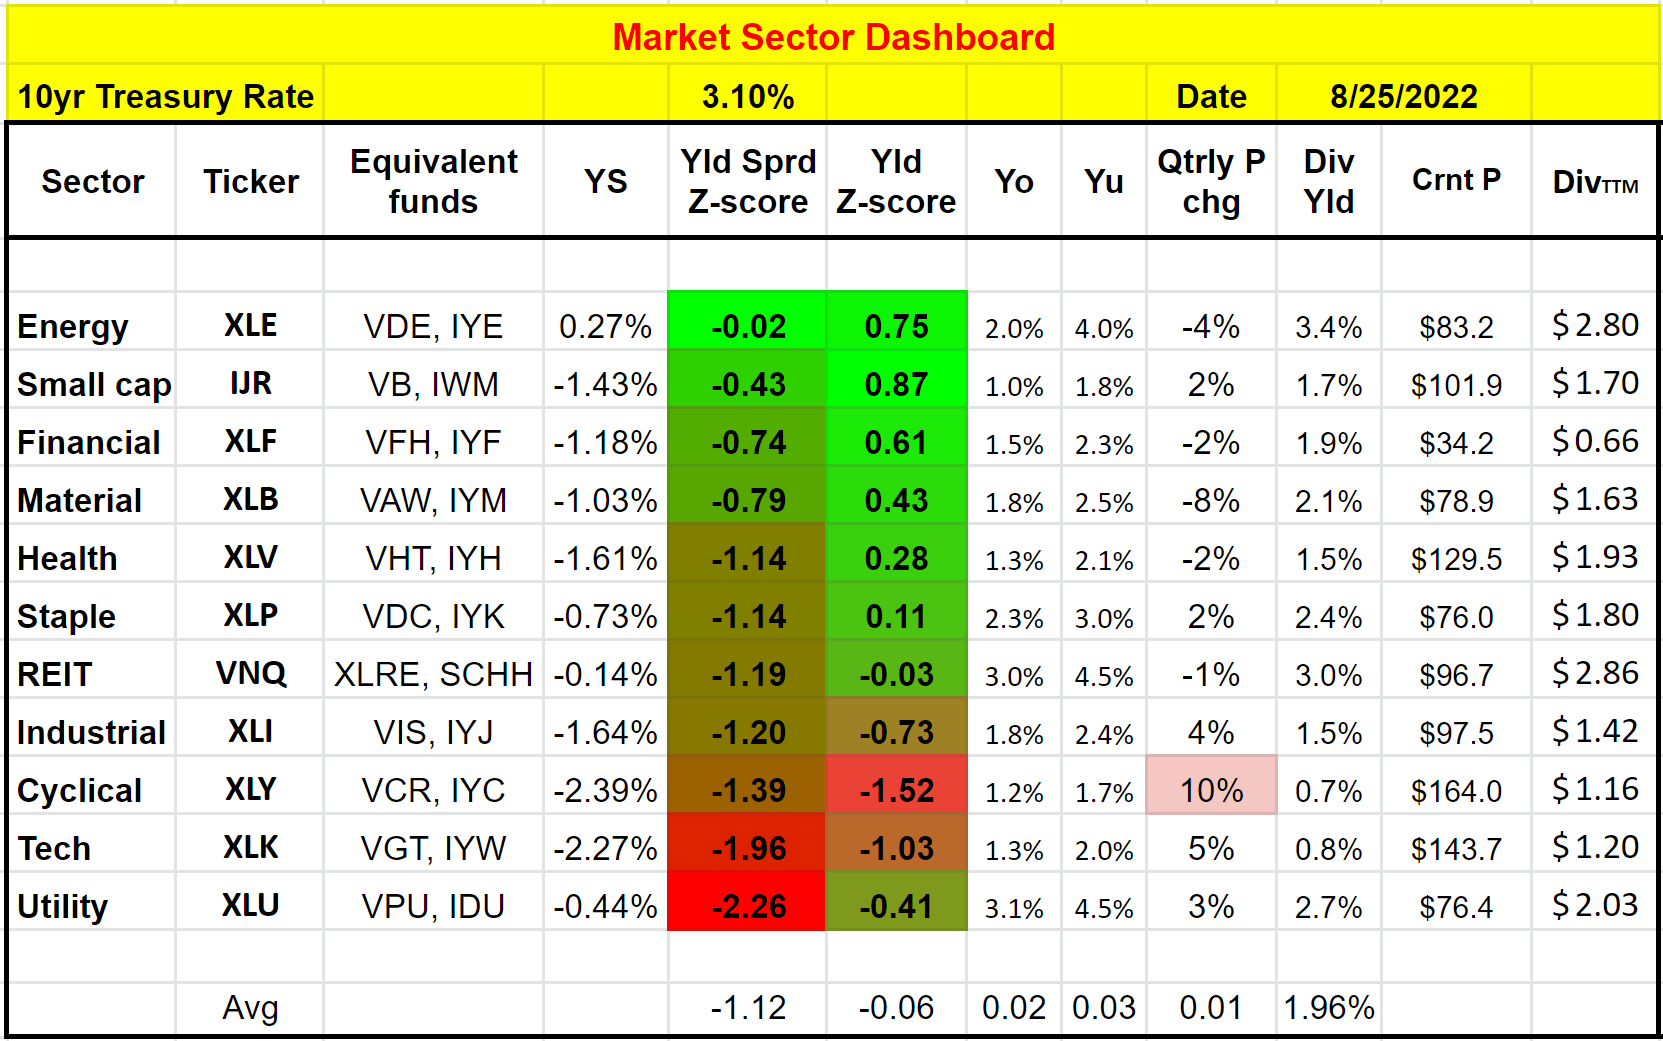
After seeing the forest, now let’s take a look at the trees: DUK and NEE. Indeed, both are overall excellent candidates in the sector considering their safety, profitability, and financial strength. Especially for investors who are more income-oriented, both have been reliable dividend growth stocks. And their current dividends are quite attractive when compared to the overall market or treasury rates.
As you can see from the following chart, NEE is currently yielding 1.83%. It is not as high as treasury rates (10-year treasury rates are about 3.1% as of this writing), but it is much higher than the dividend yield of 1.5% currently provided by the S&P 500 (by more than 20%). DUK is currently yielding 3.57%. It is therefore both higher than the treasury rates (by about 15% in relative terms) and the S&P 500 (by more than 2.3x).
However, when compared to their historical track record, their current dividend yields are lower by a substantial margin, signaling considerable valuation risks. To wit, the dividend yield for NEE has fluctuated in the past years between 1.6% and 3.5% with an average of 2.55%. Therefore, its current dividend yield, although attractive in absolute terms, is actually below its historical average by almost 30% (29% to be exact). Its current yield is actually not that far away from the lowest level in the past decade.
The picture for DUK is very similar. DUK’s dividend yield fluctuated in the past between 3.4% and 4.8% with an average of 4.21%. The peak yield of 5.87% that occurred during the COVID crash is obviously an outlier data point. Therefore, its current 3.57% dividend yield is below its historical average by almost 20% (18% to be exact). And also similarly, its current yield is very close to the lowest level in the past decade too (3.57% vs. 3.4%, only a difference of 17 basis points or 5% in relative terms).
Given the substantial overvaluation, I am very cautious to the whole sector and also both of the leading stocks. However, for investors drawn to their generous dividend and stability, you will see next why we prefer DUK over NEE.
Seeking Alpha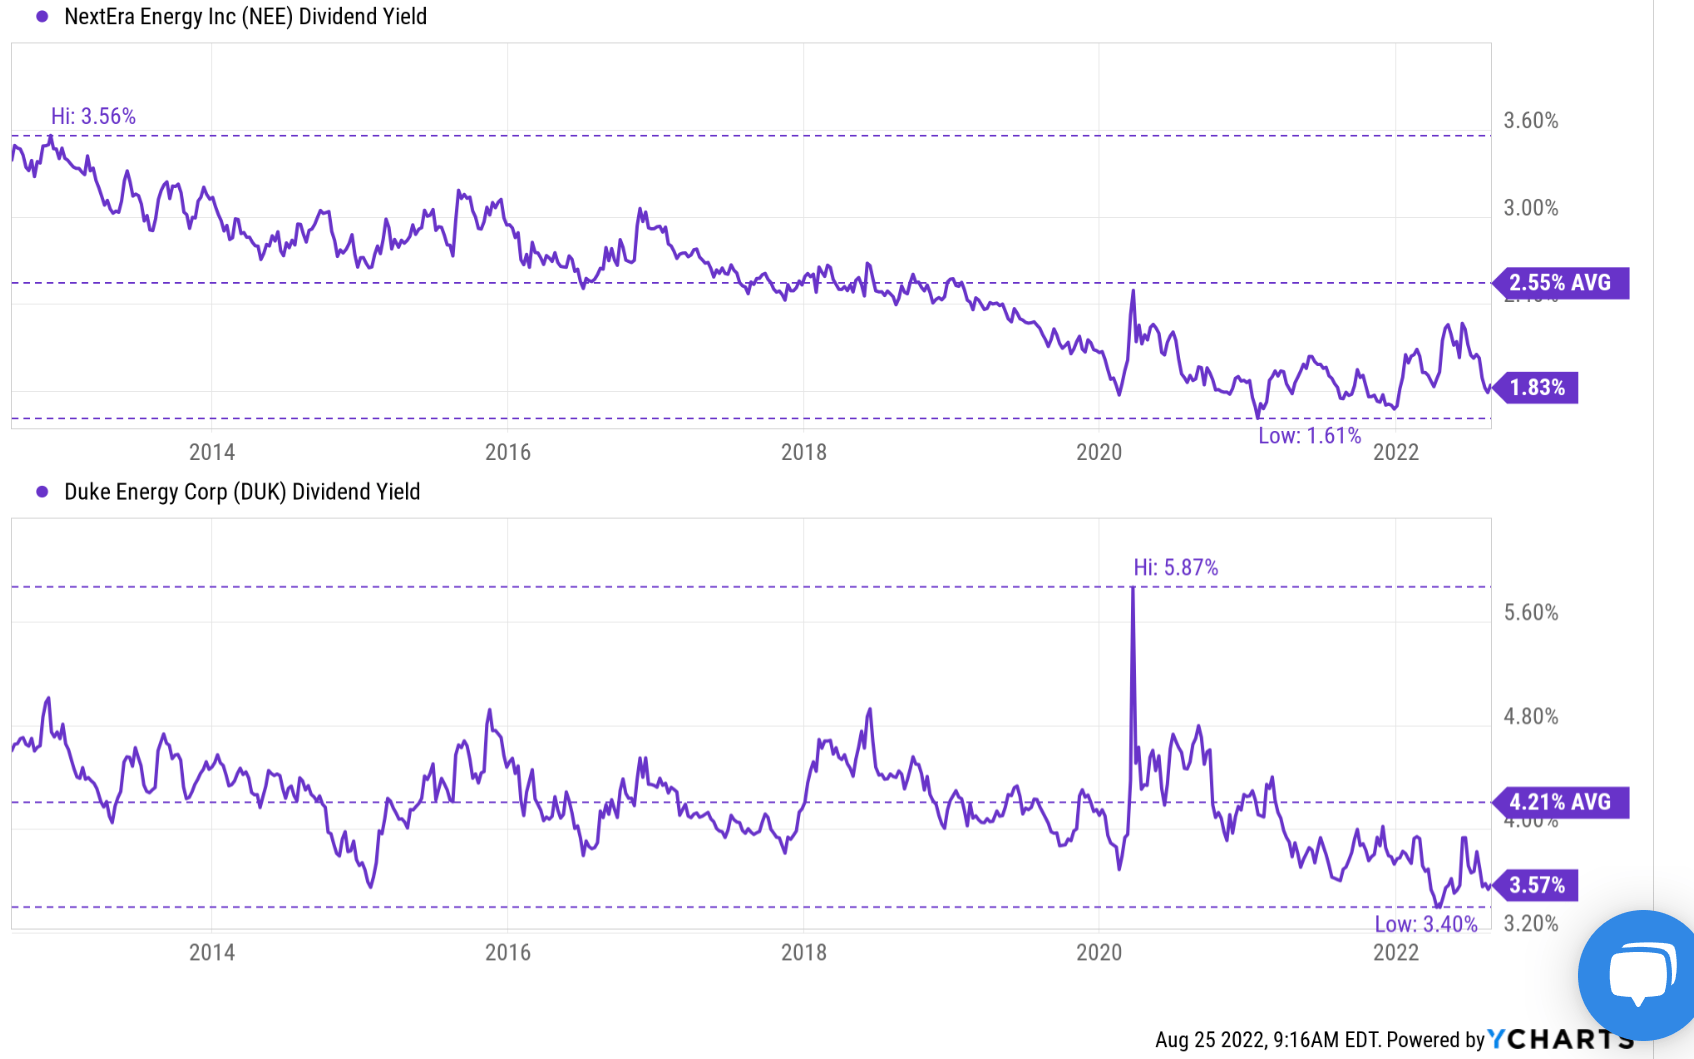
ROE as a nominal measure of profitability
First, I will use ROE, the most commonly cited profitability metric for utility stocks, to gauge their profitability. The ROE here is simply taken as their EPS divided by the book value per share. The ROE for DUK and NEE are shown in recent years below. And as can be seen, DUK’s average ROE is around 6.7%. And in contrast, NEE’s ROE has been on average 11.2%, about 1.67x higher than DUK. Therefore, by the ROE metric, NEE is 1.67x more profitable and approximately, should enjoy a 67% valuation premium – at least in terms of P/BV multiples.
However, currently, NEE is valued at 4.78x P/BV and DUK at 1.79x, a difference of 2.67x. That is a valuation premium of 167% instead of 67%. Such premium is difficult to justify in my view.
And next, we will see that ROE is misleading in itself as a profitability metric.
Source: author based on Seeking Alpha data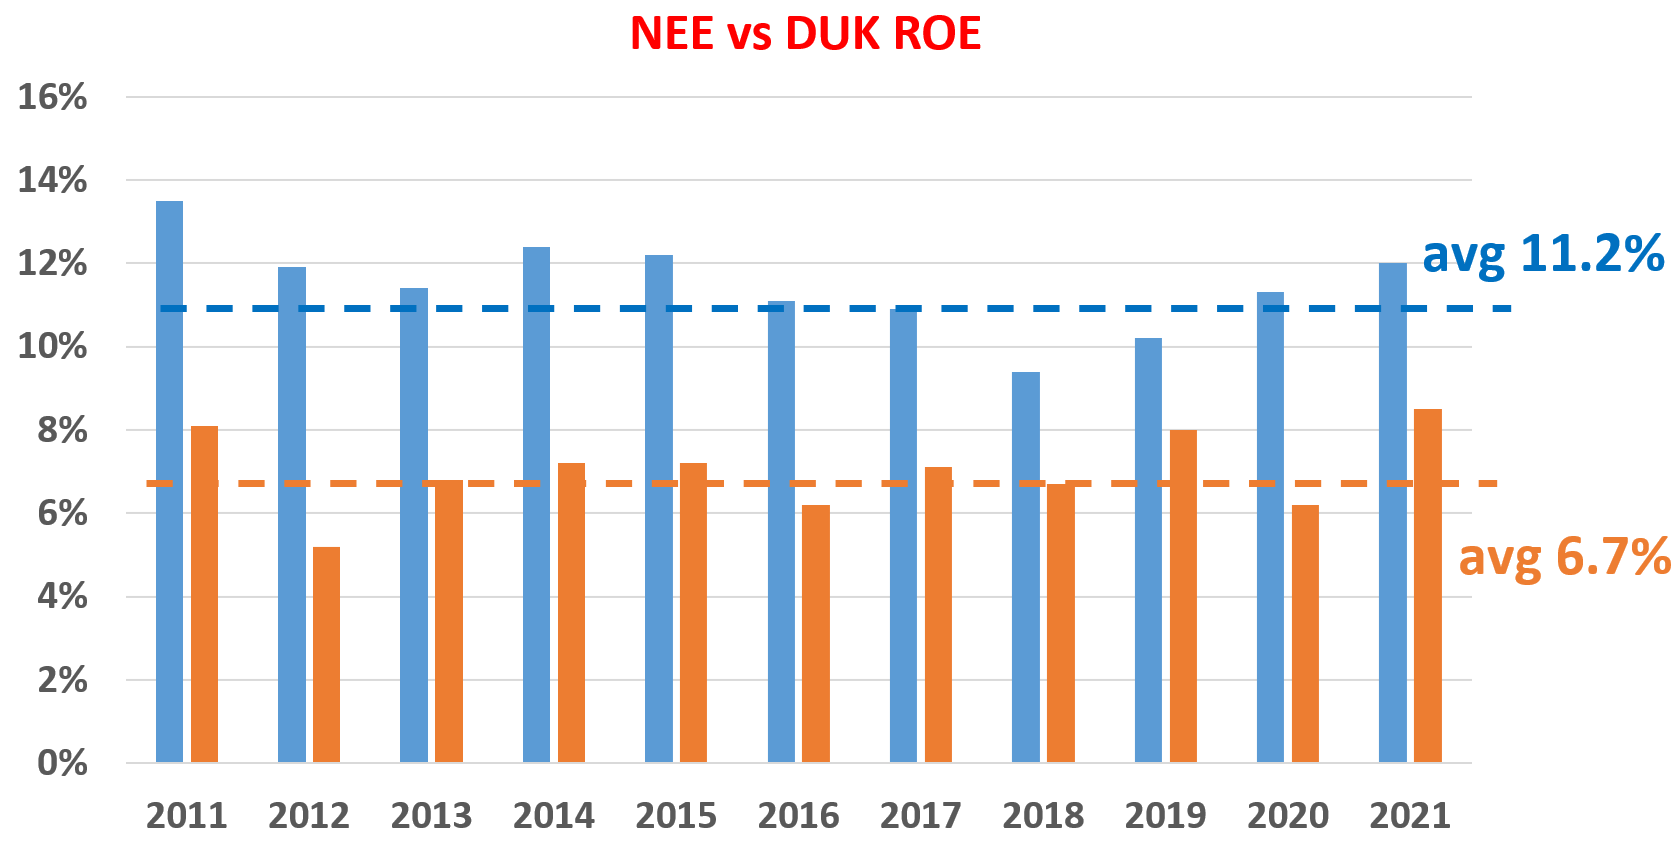
Profitability measured by ROCE
The following chart shows a more fundamental profitability measure over a longer period of time. And as explained in our earlier writings, to us, the most important profitability measure is ROCE because it considers the return of capital ACTUALLY employed. For utilities, I considered the following items capital actually employed:
1. Working capital, including payables, receivables, inventory. These are the capitals required for the daily operation of their businesses. This is a minor part of the ROCE for utilities.
2. Gross Property, Plant, and Equipment. These are the capitals required to run their business and sell their products. This is the dominating majority part of the ROCE for utilities.
As seen, the ROCE comparison paints a different picture than ROE. It is still true that NEE’s ROCE has been consistently above DUK over the long term too. NEE’s ROCE has fluctuated between about a low of 8% to as high as 10% in the past decade. And its average ROCE in recent years has been 9.3%, a remarkable level for utilities. But the superiority to DUK is not as dramatic as the ROE indicated.
As seen, DUK’s ROCE has been hovering between 7.5% to 9% most of the time. And its average ROCE has been 8.3%, again lower than NEE for sure. But only lower by about 100 basis points or 10% in relative terms, in contrast to the 1.67x difference we’ve seen in ROE above.
Source: author based on Seeking Alpha data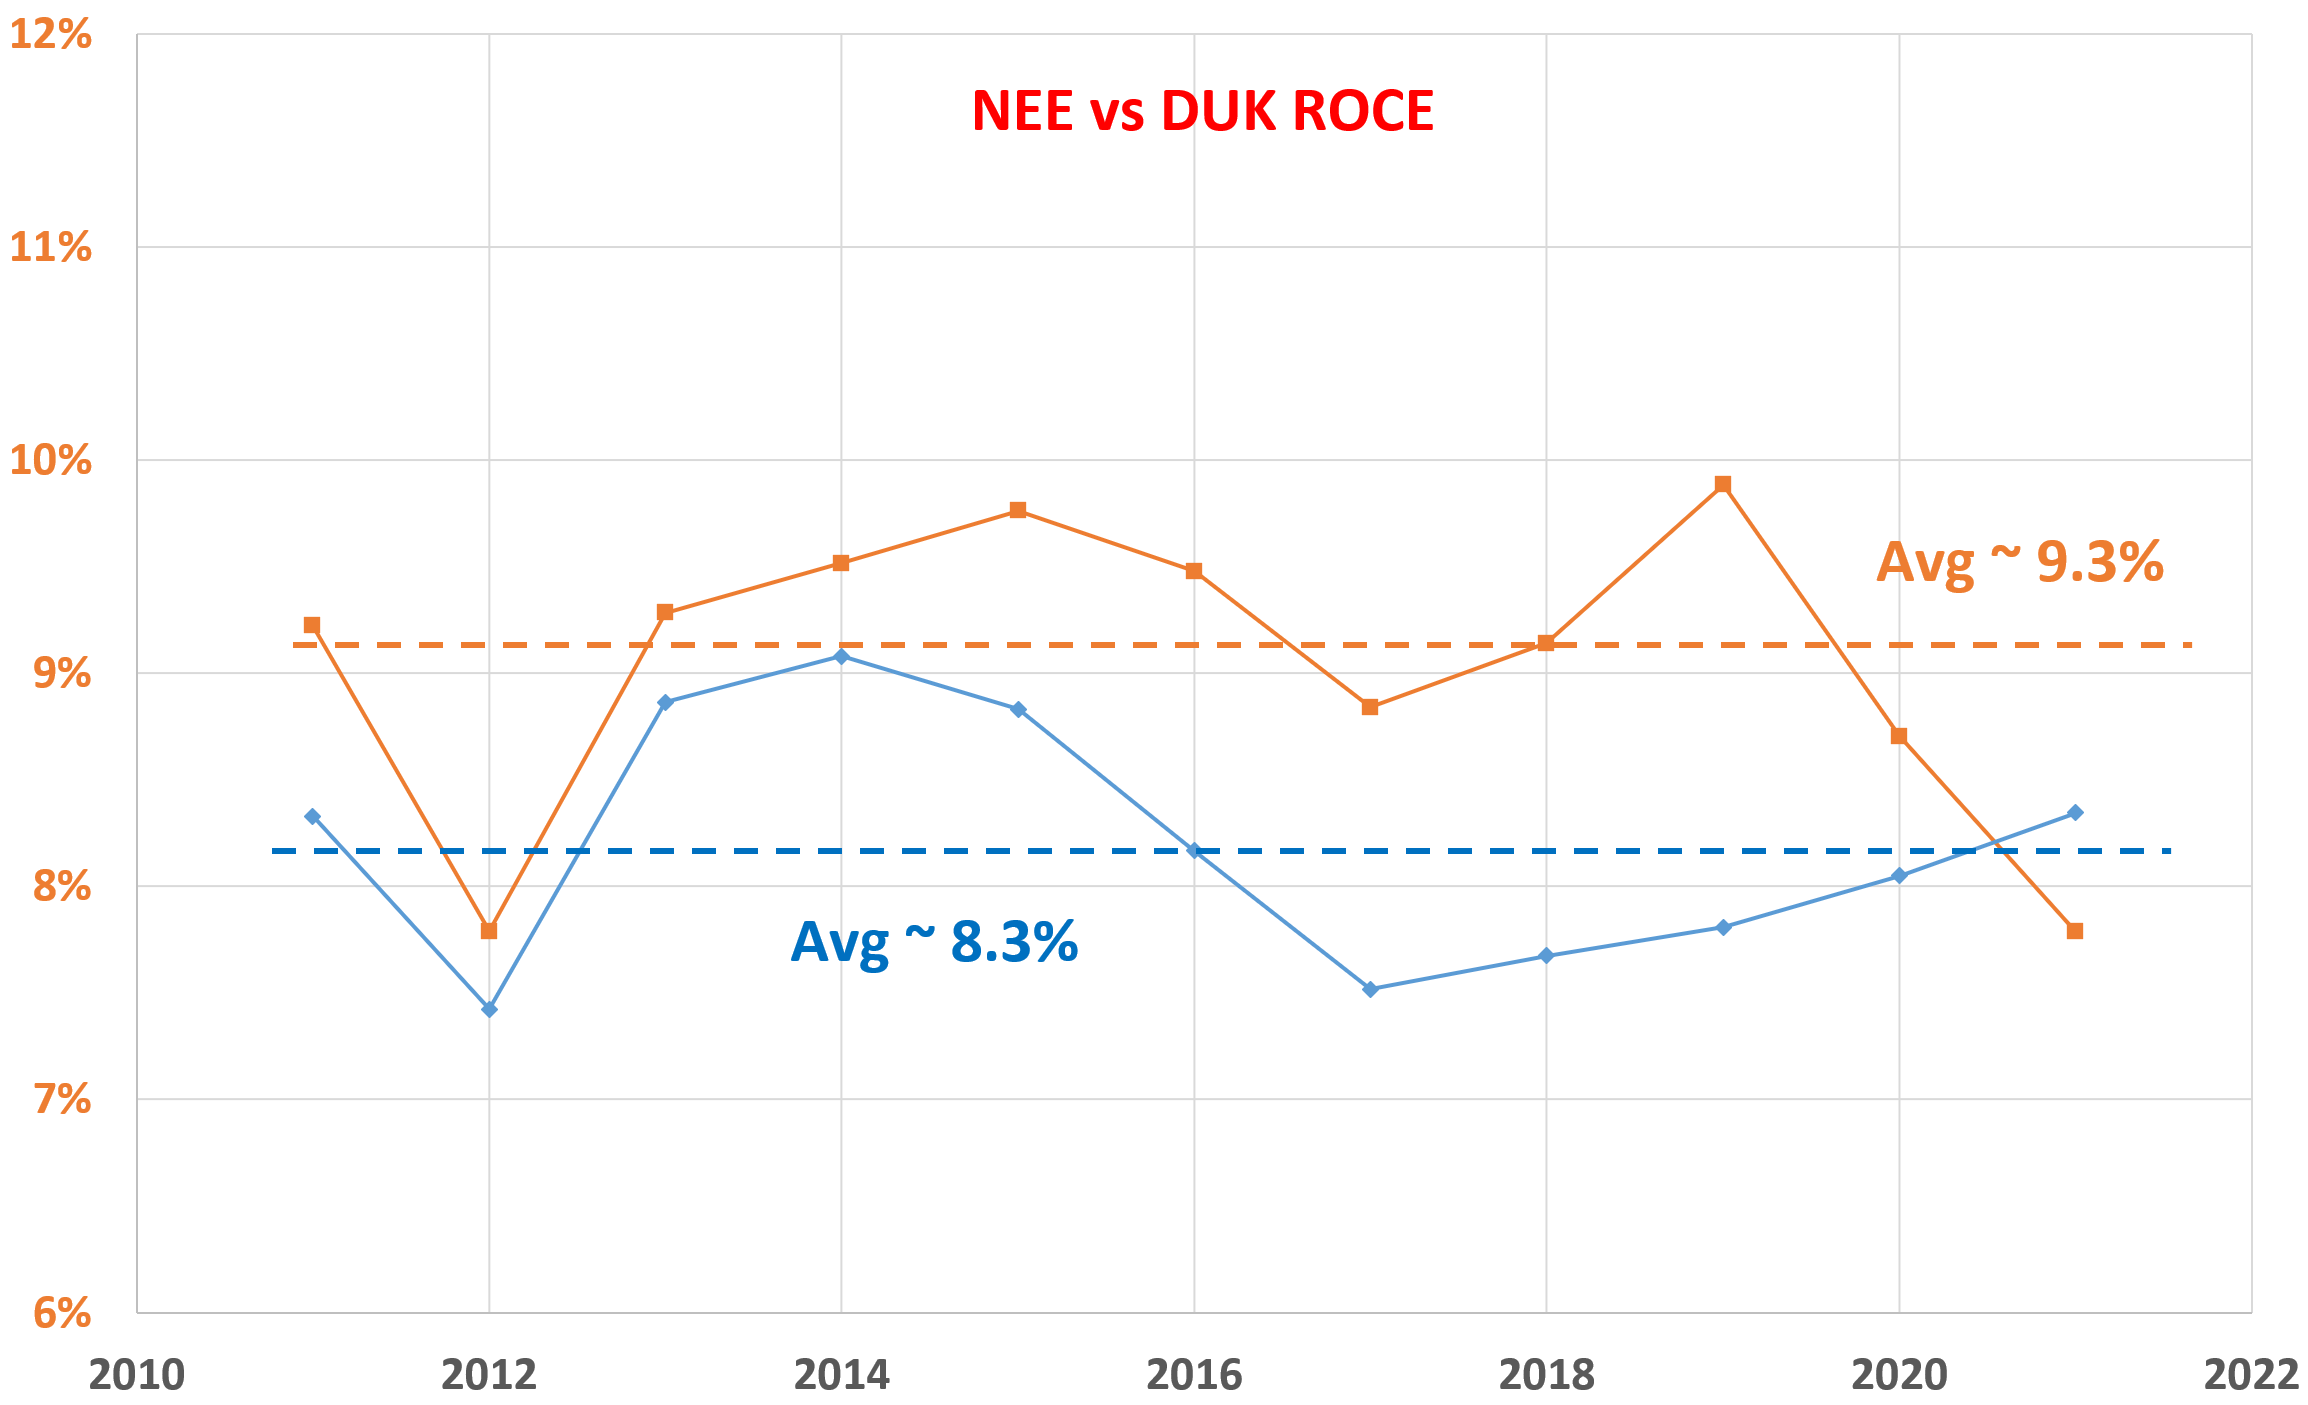
Valuation and Potential returns
Based on the above comparison of profitability, I find NEE’s valuation premium difficult to justify as you can see from the second chart. As aforementioned, NEE’s Price to book value ratio is at 4.78x currently, a whopping 2.67x above DUK’s 1.79x. In terms of P/E ratios, NEE’s P/E of 30.9x is more than 51% higher than DUK’s 20.3x.
Given that utility stocks use relatively heavy leverages, let’s consider valuation multiples adjusted by leverage, such as EV/sales and EV/EBITDA ratios. As seen, the EV/sales ratio also indicates NEE’s substantial valuation premium (11.6x vs. 5.97x) too. And the premium is even more dramatic in terms of EV/EBITDA ratios. NEE’s EV/EBITDA ratio of 36.8x on a TTM basis is more than 2.72x above DUK’s 13.5x.
Seeking Alpha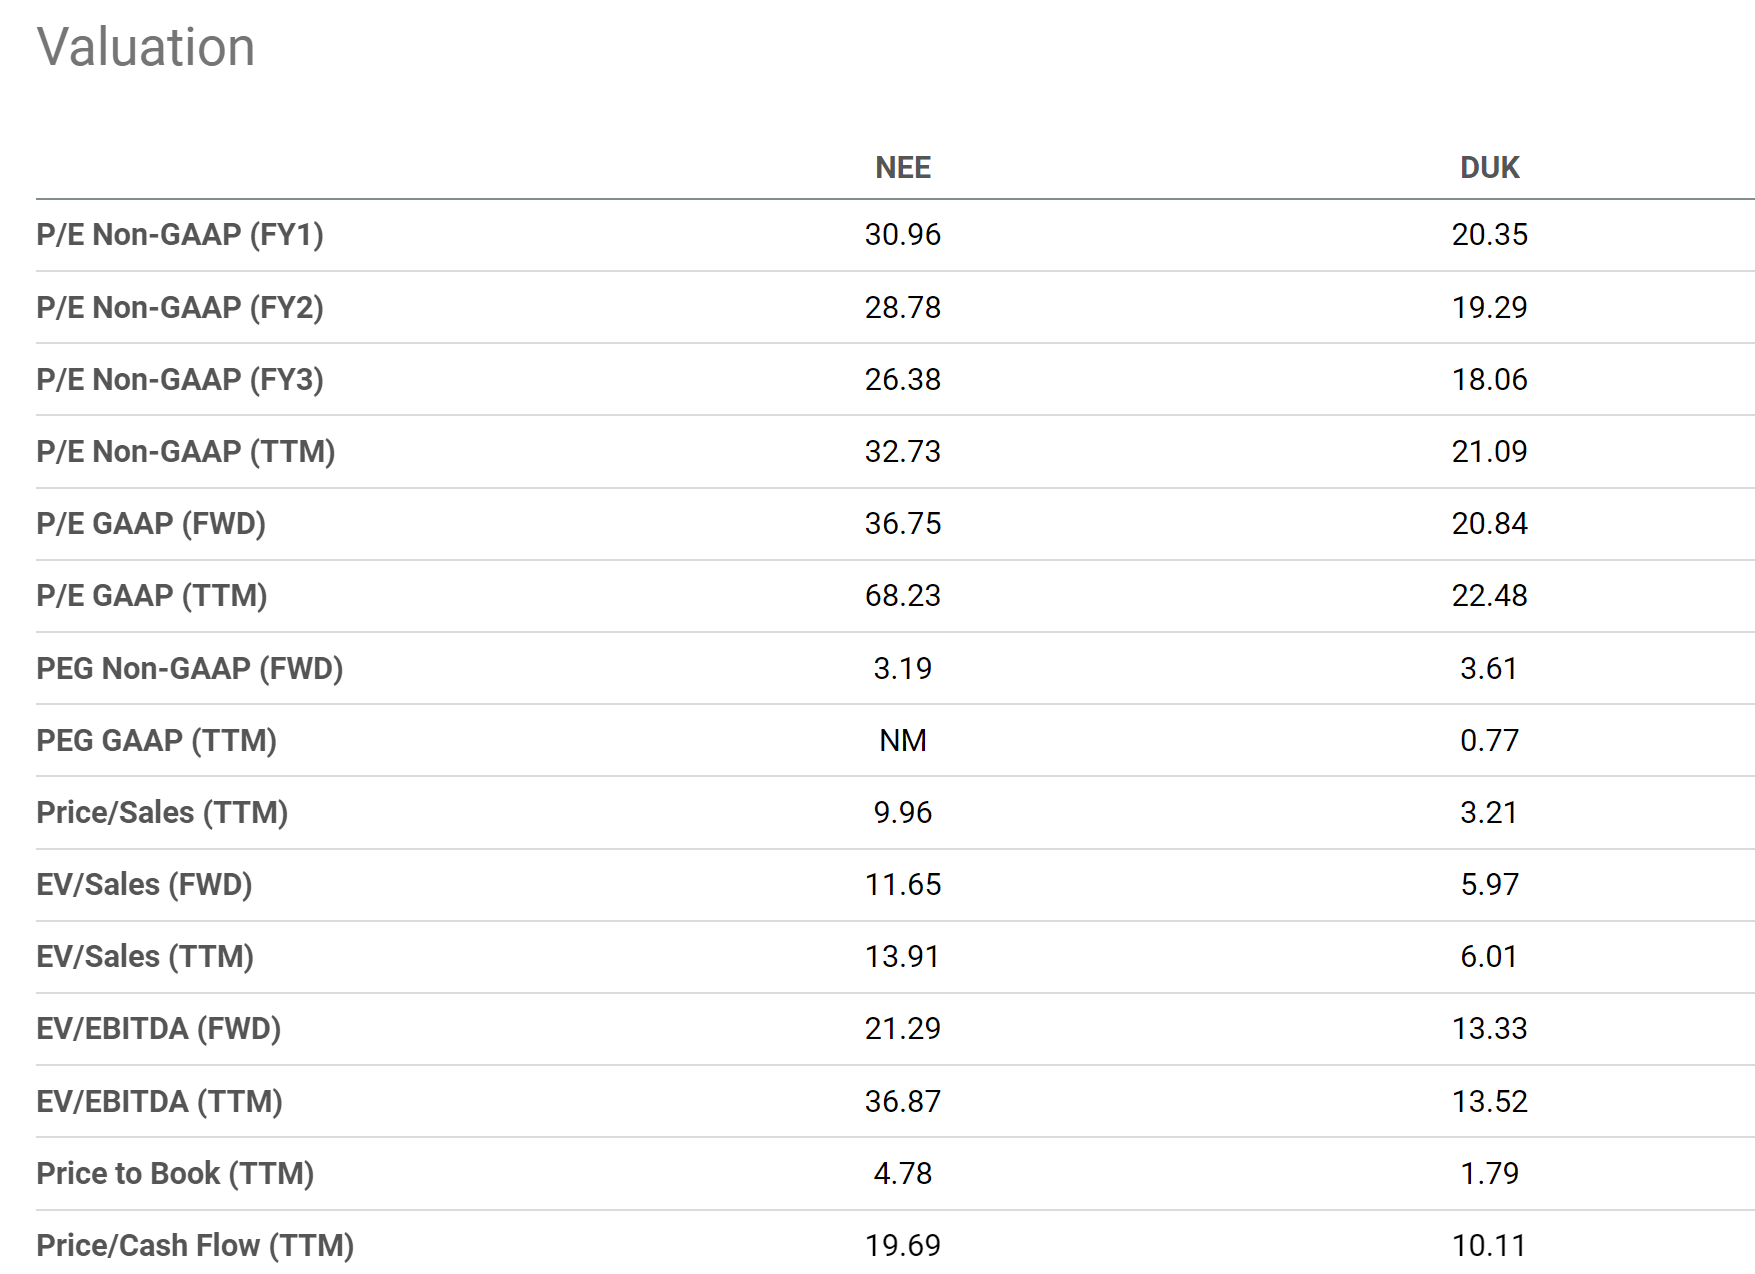
Based on the profitability and valuation analyses above, the following chart shows their return projections. As seen, I expect both of them to underperform the overall market in the years to come. And between the two of them, DUK is the one with slightly lower risk premiums and higher return potentials.
The building and underlying mechanism of this chart roadmap are detailed in our earlier article. In short,
1. The long-term ROI for a business owner is simply the summation of two things: A) the price paid to buy the business and B) the long-term growth rate of the business. More specifically, part A is determined by the owner’s earning yield (“OEY”) when we purchased the business.
2. Part B, the long-term growth rate, is governed by ROCE and the Reinvestment Rate. These are the two most important growth engines, and they mutually enhance each other.
3. Longer-Term ROI = valuation + quality = OEY + Growth Rate = OEY + ROCE*Reinvestment Rate.
The chart assumes a 10% reinvestment rate for both these stocks and the overall economy, which is close to their average level in the long term. And under this assumption, DUK is projected to deliver a total annual return of around 6%, compared to about 4.3% from NEE.
Author 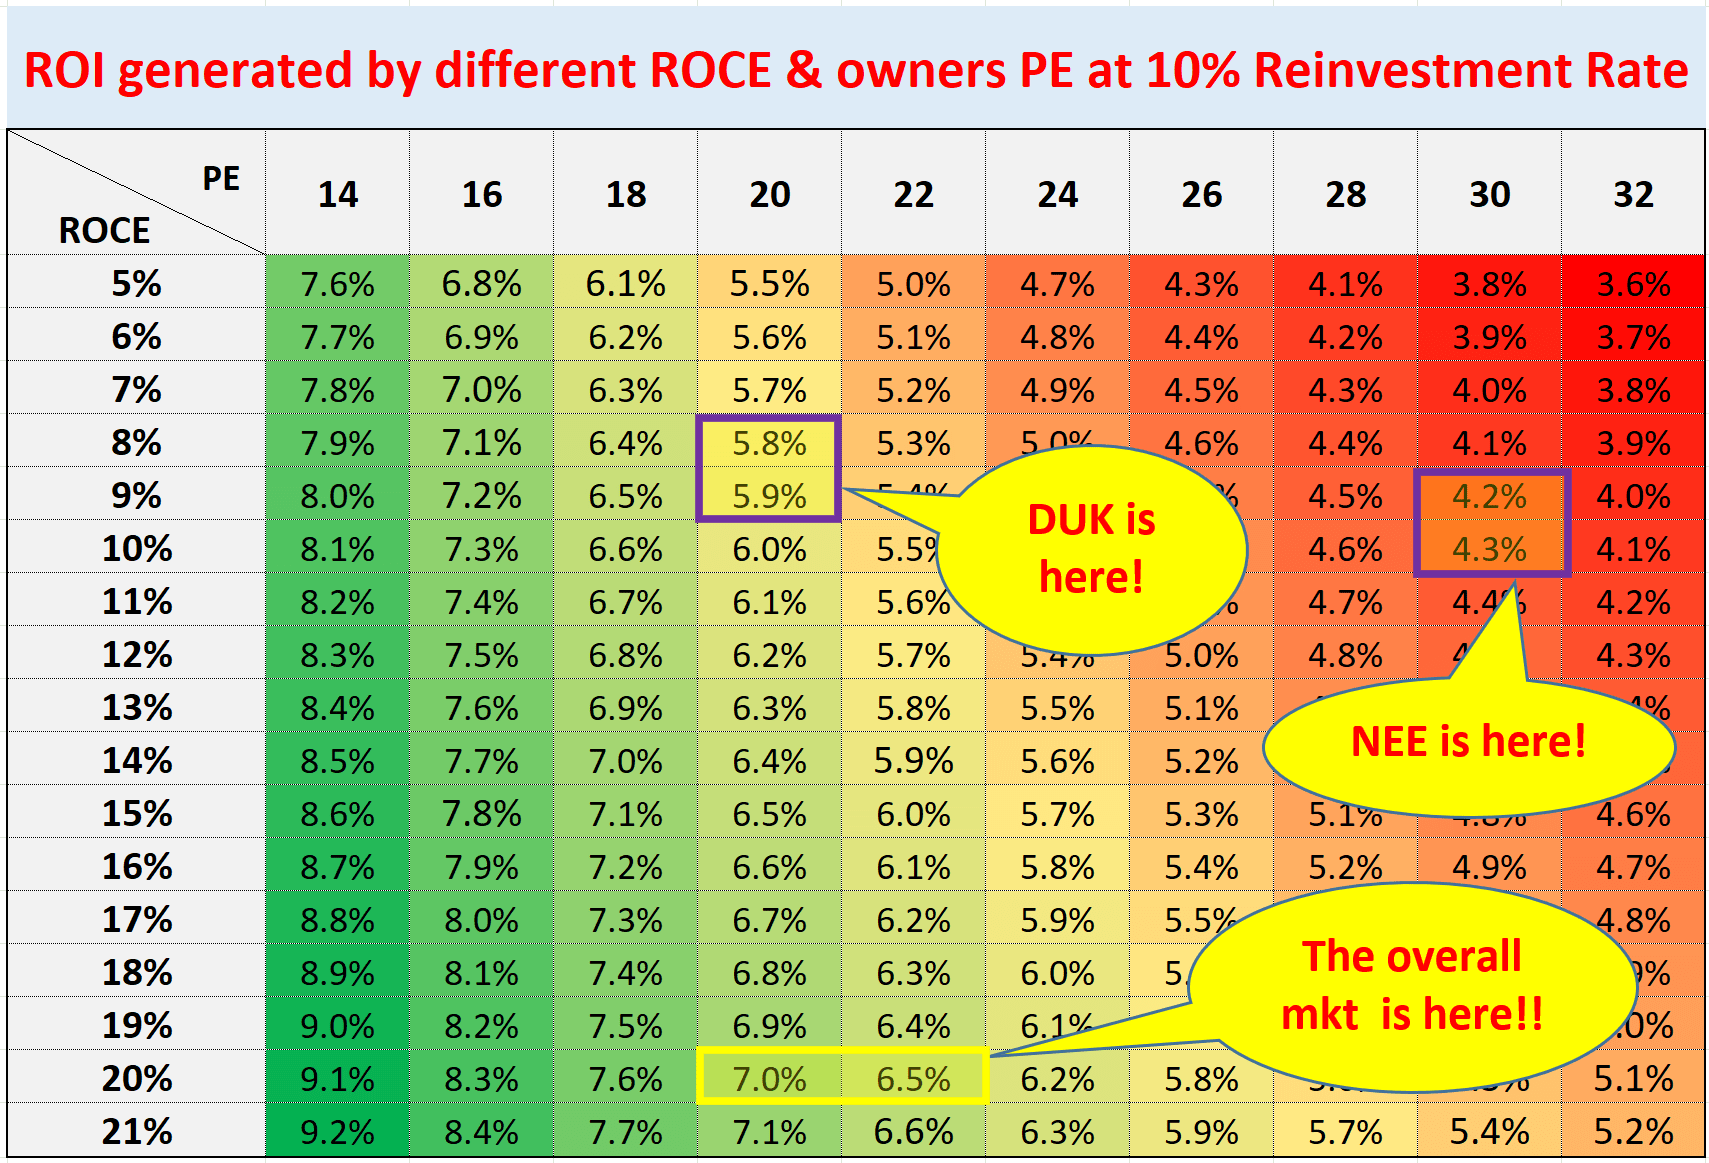
Final thoughts and other risks
In summary, I feel the potential returns for both DUK and NEE (and the whole utility sector too) to be limited in the years to come given their limited growth potential and valuation premiums. However, these leading stocks do have their advantages, including their relatively high dividends and stability (as you can see from their low beta below).
Between them, I feel Duke offers slightly lower risk premiums and higher return potentials. NEE’s valuation premium over DUK is difficult for me to justify either in terms of ROE (which is misleading already) or especially in terms of ROCE (where the difference is only about 10%). Furthermore, DUK’s current 3.57% dividend is almost 2x higher than NEE’s 1.83%, providing better support for the returns.
Seeking Alpha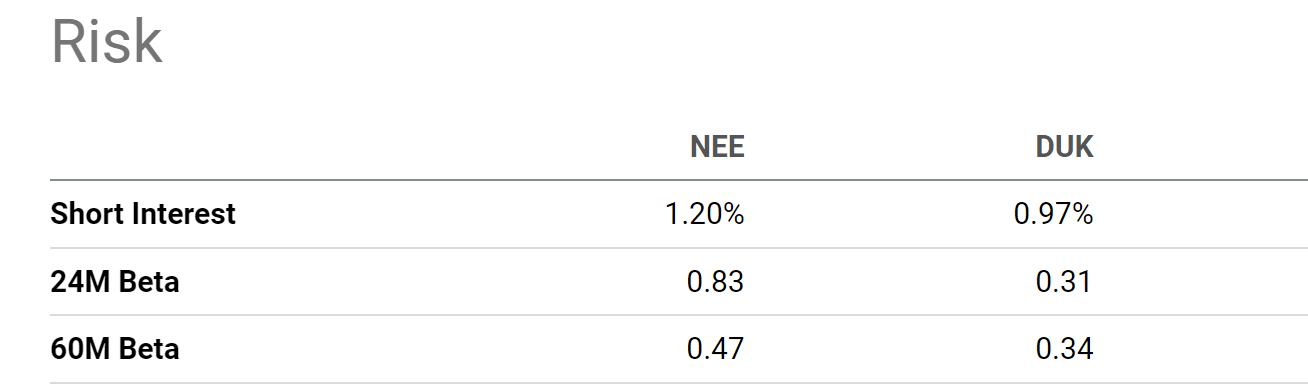
Finally, risks. Besides the valuation risks and interest rate risks mentioned above, there are some risks specific to these stocks too. Their rates always face some regulatory uncertainties. For example, in Ohio, DUK’s rate case is still pending. And for NEE, a major uncertainty involves its solar segment. The U.S. Department of Commerce is currently looking into the importation of solar panels including wafers fabricated in China. Depending on the duration and pace of the inquiry, various NextEra projects could be delayed and face cost overruns as a result of tariff increases and increased supply-chain issues.
Be the first to comment