

MadamLead
Thesis
This is an updated coverage of Duke Energy Corporation (NYSE:DUK) following an article I published back in May 2022. In that article, I cautioned readers about the expensive valuation of the utility sector. At that time, it was the most expensively valued sector relative to risk-free rates, and its leading stock DUK even more so.
This update is motivated by the following considerations:
- The interest rates have increased substantially from May 2022 to now. Take 10-year treasury rates as an example, the rates climbed by about a whole 1% over the past 6 months from below 3.0% to the current level of 4.01% as of this writing.
- Since my May article, the sector fund, the Utilities Select Sector SPDR ETF (NYSEARCA:XLU), has already announced its Q3 dividend payouts. XLU increased its quarterly dividend to $0.501 per share in September 2022, a token increase of 0.4% from $0.499 a year ago, signaling profitability pressure ahead in my mind.
- Finally, both DUK and XLU stock prices have also been under pressure and suffered some corrections since my last article.
In this article, you will see that after all the above updates are considered, my conclusion is that now is the worst time to buy utilities, either the sector fund XLU or its leading component stock like DUK (actually, especially DUK the way I see it). The risk premium of DUK relative to risk-free interest rates is at the highest level since 2008, and also at a secular peak relative to XLU.
Utilities and our market dashboard
As detailed in my earlier article:
We follow a top-down investment approach. We first check the market at a sector level to see the forest and then check a few leading stocks to see the trees. The following is what we see at the sector level. With the 10-year treasury rates pushing beyond 4%, many “safe” sectors and stocks such as utilities and consumer staples are no longer safe, as you can see from our market dashboard below. The utility sector is actually the most expensively valued sector relative to the risk-free rates. The mechanics of the market dashboard are detailed in our earlier article here and you are welcome to download it here.
To wit, with the recent interest rate hikes since my last writing, the utility sector is the most expensive sector judging by the dividend spread Z-score among all the major sectors. As seen, its current yield spread Z-score is -2.99, even more, negative than the technology sector. A Z-score close to negative 3 approximately translates into a so-called 3-sigma event, indicating extreme high risk premium in my view.
Next, let’s review some basics of DUK and XLU, and see why I feel DUK’s risk-premium is even higher than the sector.
Source: Author based on Seeking Alpha data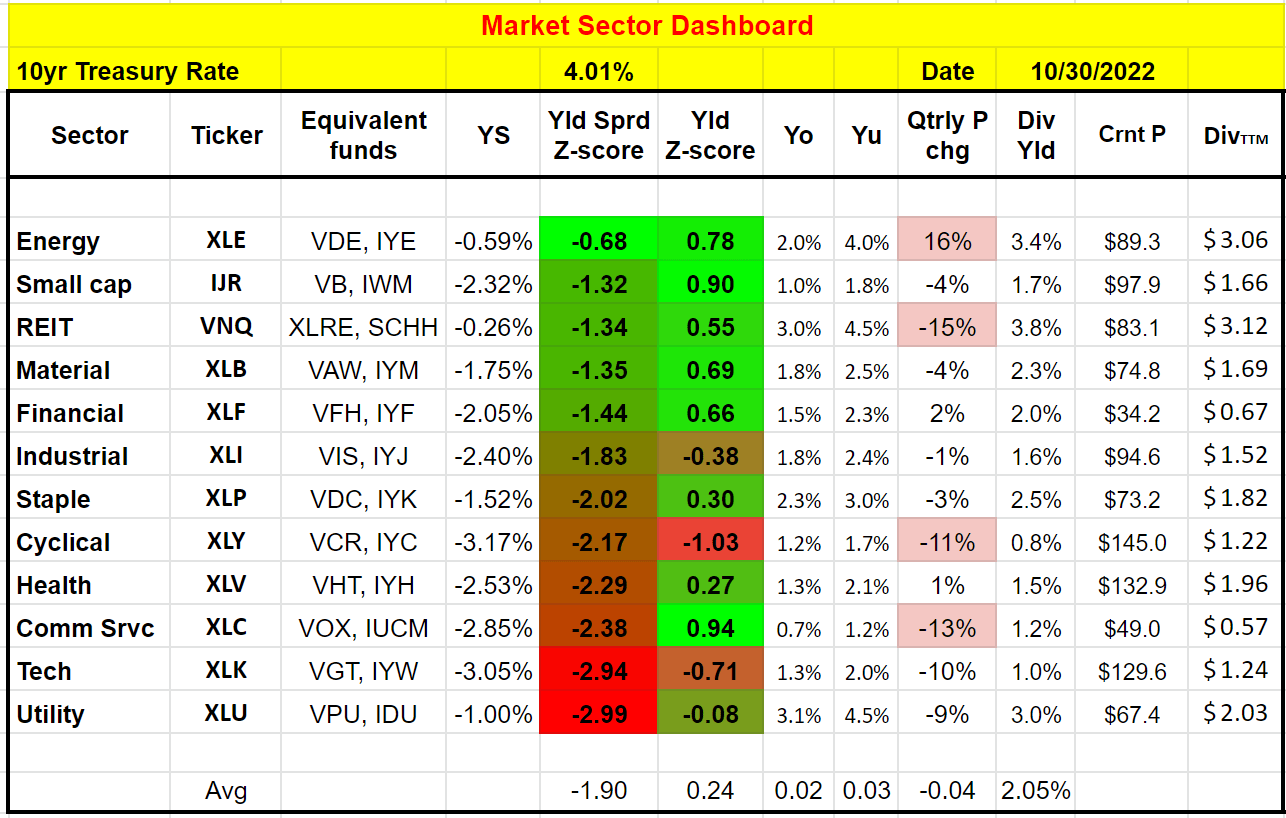
XLU and DUK – Basic information
The XLU is probably the most popular utility fund and needs little introduction. As seen in the chart below, it invests exclusively in utility companies. The fund is top-heavy, and DUK is its second-largest holding, representing 8.4% of its total asset. The top two holdings (NEE and DUK) represent more than a quarter of its total assets.
Source: Yahoo Finance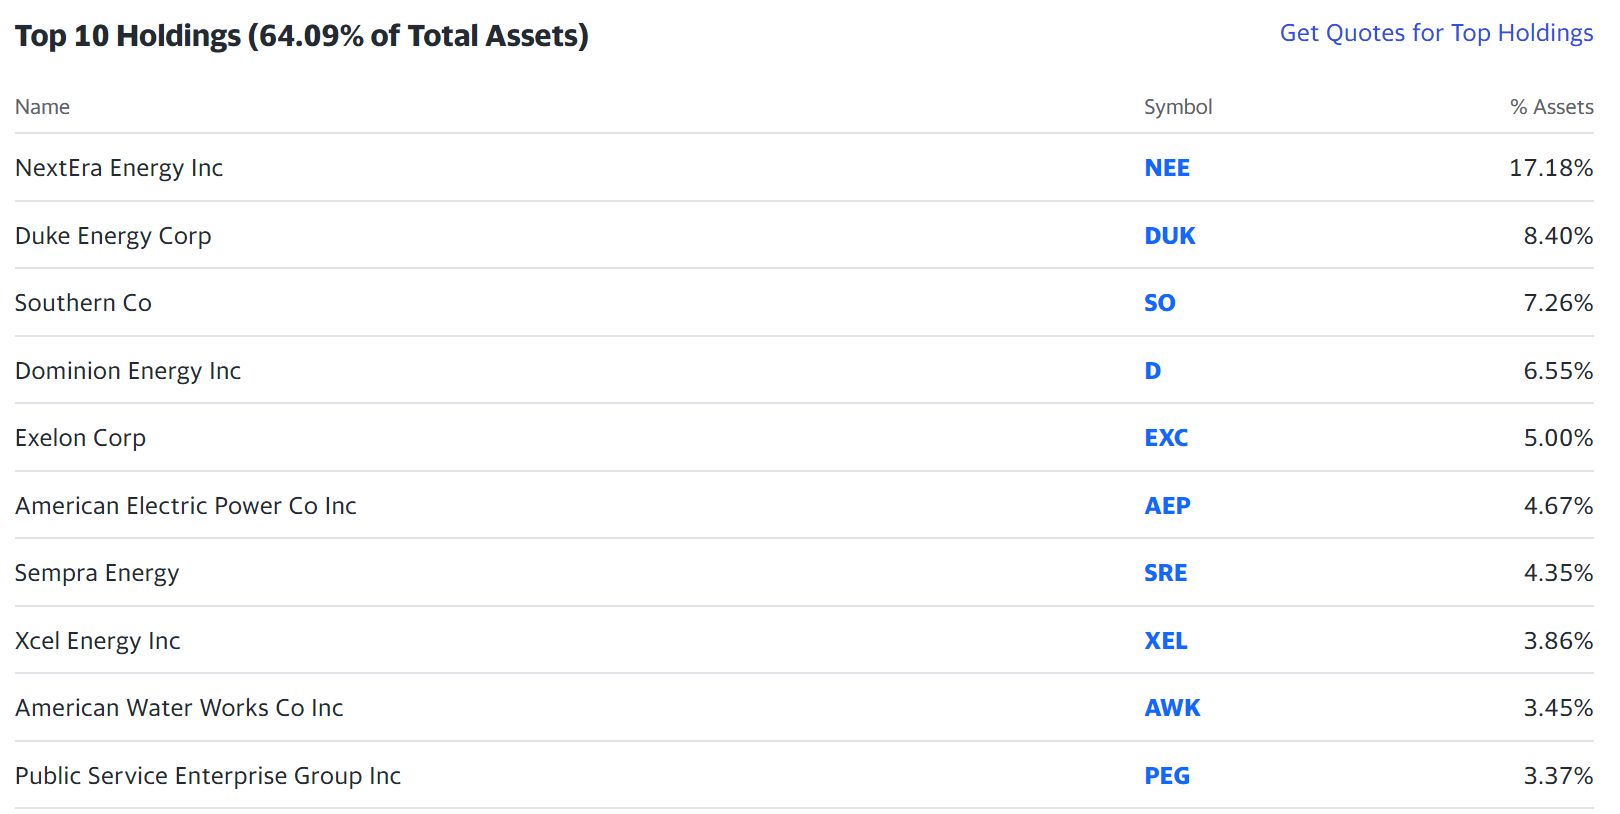
DUK, XLU, and rising interests
The first reason against buying utilities now is the rising interest rates. As argued in my earlier article:
Utilities have been helped by the secularly low-interest rates in the past decade. And now interests are on the rise and will pose a headwind. All utilities heavily depend on delta financing (and hence utility funds like XLU depend on debt financing too subsequently). And rising rates will cause increased interest rates and pressure their profits.
As aforementioned, such pressure on the sector’s profitability has already been reflected in the lack of meaningful dividend raises in the past quarter. And such profitability, in turn, translates into pressure on their prices.
As you can see from the chart below, both DUK and XLU stock prices have been under pressure as the target federal funds rates hiked from about 1% back in May to the current level of 3.25%. To wit, the price of XLU corrected from about $72 to the current level of $67.4 (about a 7% decline) since my last writing. And the price of DUK corrected even more, from about $110 to the current level of $94, by more than 15%.
Looking ahead, I do not see the rising trend of interest rates reversing in the near term, given the persisting inflationary pressure. Furthermore, next, you will see that the above price corrections are not enough to compensate for the interest rate risks.
Source: Seeking Alpha data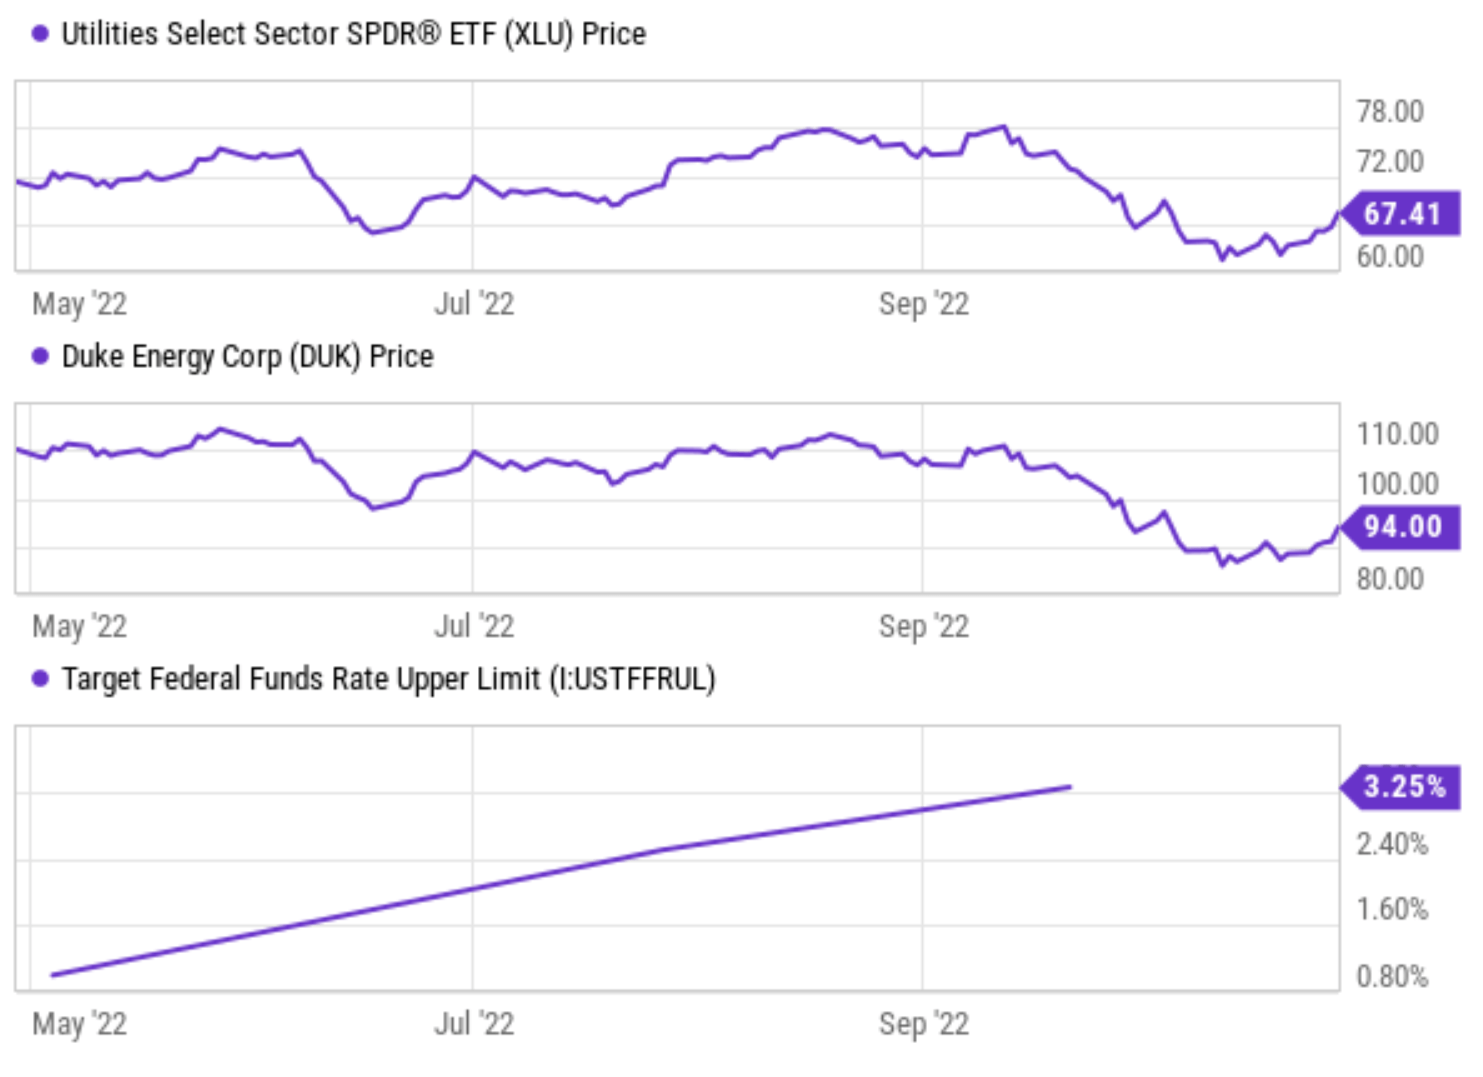
XLU and DUK: Thinnest yield spread since 2008
As detailed in our earlier article, dividend yields and yield spread are what we first check before making any investment decisions. We’ve fortunately had very good success with this approach because of:
- The common P/E or Price/cash flow multiples provide partial and even misleading information due to the differences between accounting earnings and owners’ earnings.
- Dividends provide a backdoor to quickly estimate the owners’ earnings. Dividends are the most reliable financial information and least open to interpretation.
- The dividend yield spread (“YS”) is based on a timeless intuition. No matter how times change, the risk-free rate serves as the gravity on all asset valuations and consequently, the spread ALWAYS provides a measurement of the risk premium investors are paying relative to risk-free rates.
With this background, you can see from the two charts below both XLU and DUK’s current valuations are at the most expensive level relative to risk-free rates since 2008 despite their recent price corrections.
To wit, the first chart below shows the yield spread between XLU and the 10-year treasury rates since 2007. As can be seen, the spread is bounded and tractable within a range between about 2.25% and negative 1.0%. Suggesting that when the spread is near 2.25%, XLU is significantly undervalued relative to 10-year treasury bonds. And when the yield spread is near or below -1.0%, it means the opposite.
Now with XLU yielding about 3% and the 10-year treasury rate above 4%, the spread is at negative 1%, the lowest level since 2008, as you can see.
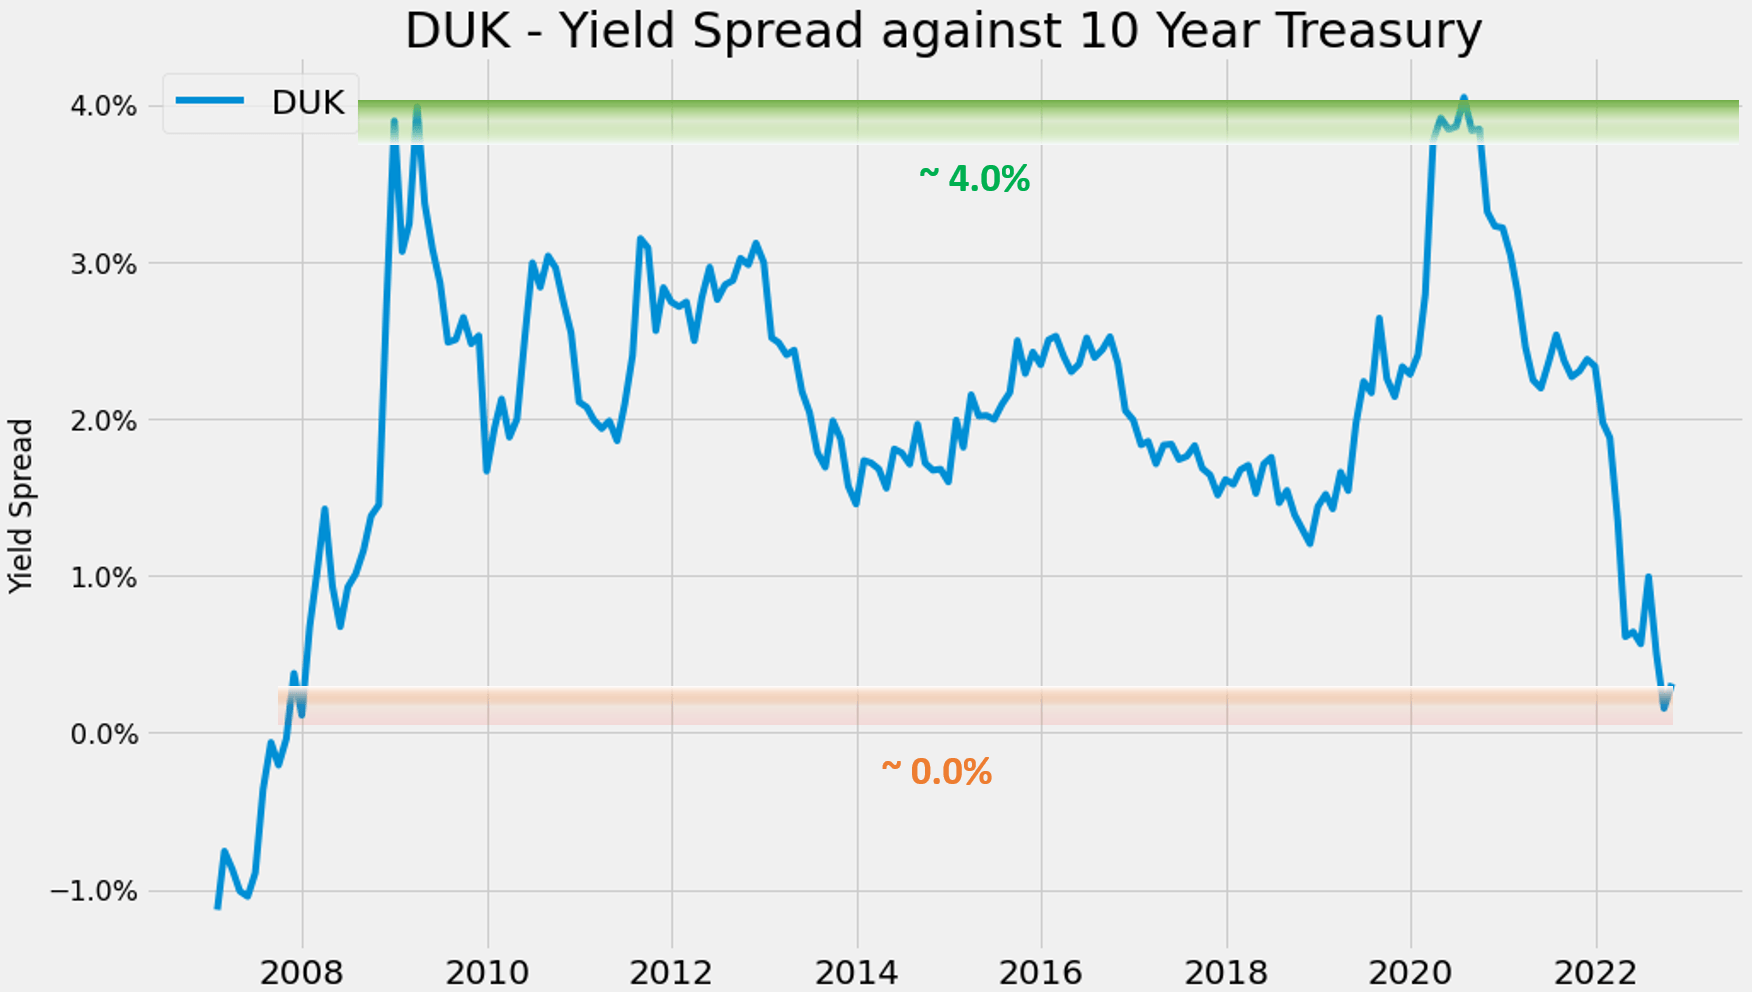
The picture for DUK is very similar, as you can see from the second chart below. More specifically, the spread between DUK and 10-year treasury rates is again bounded and tractable between about 4.0% and negative 0.0%. And now, with DUK’s 4.2% dividend yield, the yield spread is close to zero, again the thinnest level since 2008.
Source: Author based on Seeking Alpha data Source: Author based on Seeking Alpha data
Finally, for readers familiar with our analyses, you know that short-term returns are closely correlated with the yield spread for funds or stocks that have demonstrated stable dividends, such as XLU and DUK. As an example, the chart below shows the 2-year total return (including price appreciation and dividend) from DUK when the purchase was made under different yield spreads. You can see that there is a strong positive correlation (and the Pearson correlation coefficient is 0.76). And as you can also see from the chart, when the yield spread is close to zero, the total returns in the 2 years have all been historically negative. While on the opposite, when the yield spread is above 2%, the total returns in the next 2 years have all been positive and in many cases as large as almost 50% as highlighted by the data points in the orange box.
Source: Author based on Seeking Alpha data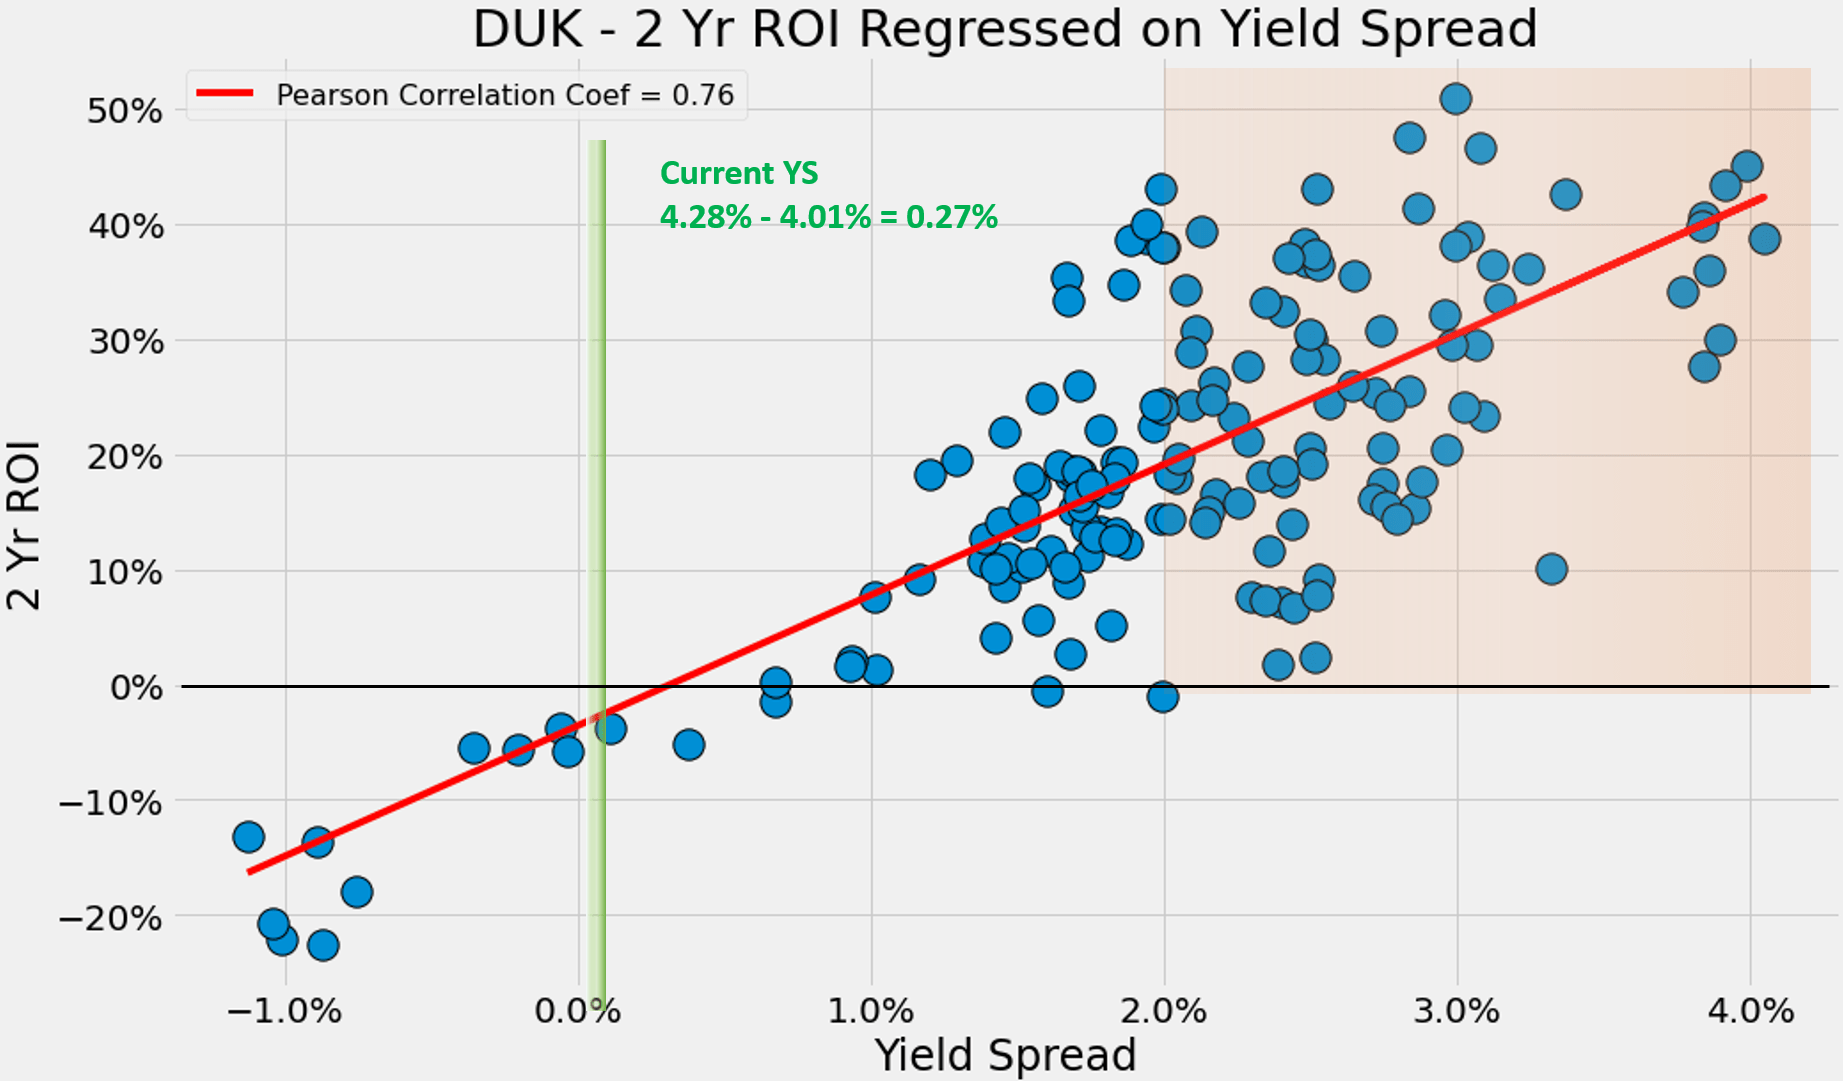
If you must buy utilities, buy XLU
Finally, if you must hold utility for some reason (e.g., income generation or diversification), we see XLU as the lesser of the evil here, for a couple of reasons.
First, XLU has provided higher Sortino ratios than DUK historically (which means XLU has suffered lower volatility risks for the same amount of return). As you can see, in the long term both XLU and DUK have delivered very similar returns (6.98% for DUK and 6.99% for XLU), both leading the overall market’s 6.47% CAGR. However, DUK has suffered far larger volatility risks than XLU. In terms of standard deviation, DUK’s 20.7% is more than 1/3 above XLU’s 15.2%. In terms of worst-year performance, DUK has suffered 48% worst-year losses compared to only 28% from XLU. And the contrast in maximum drawdown is even more dramatic (68% vs 43%).
Source: www.portfoliovisualizer.com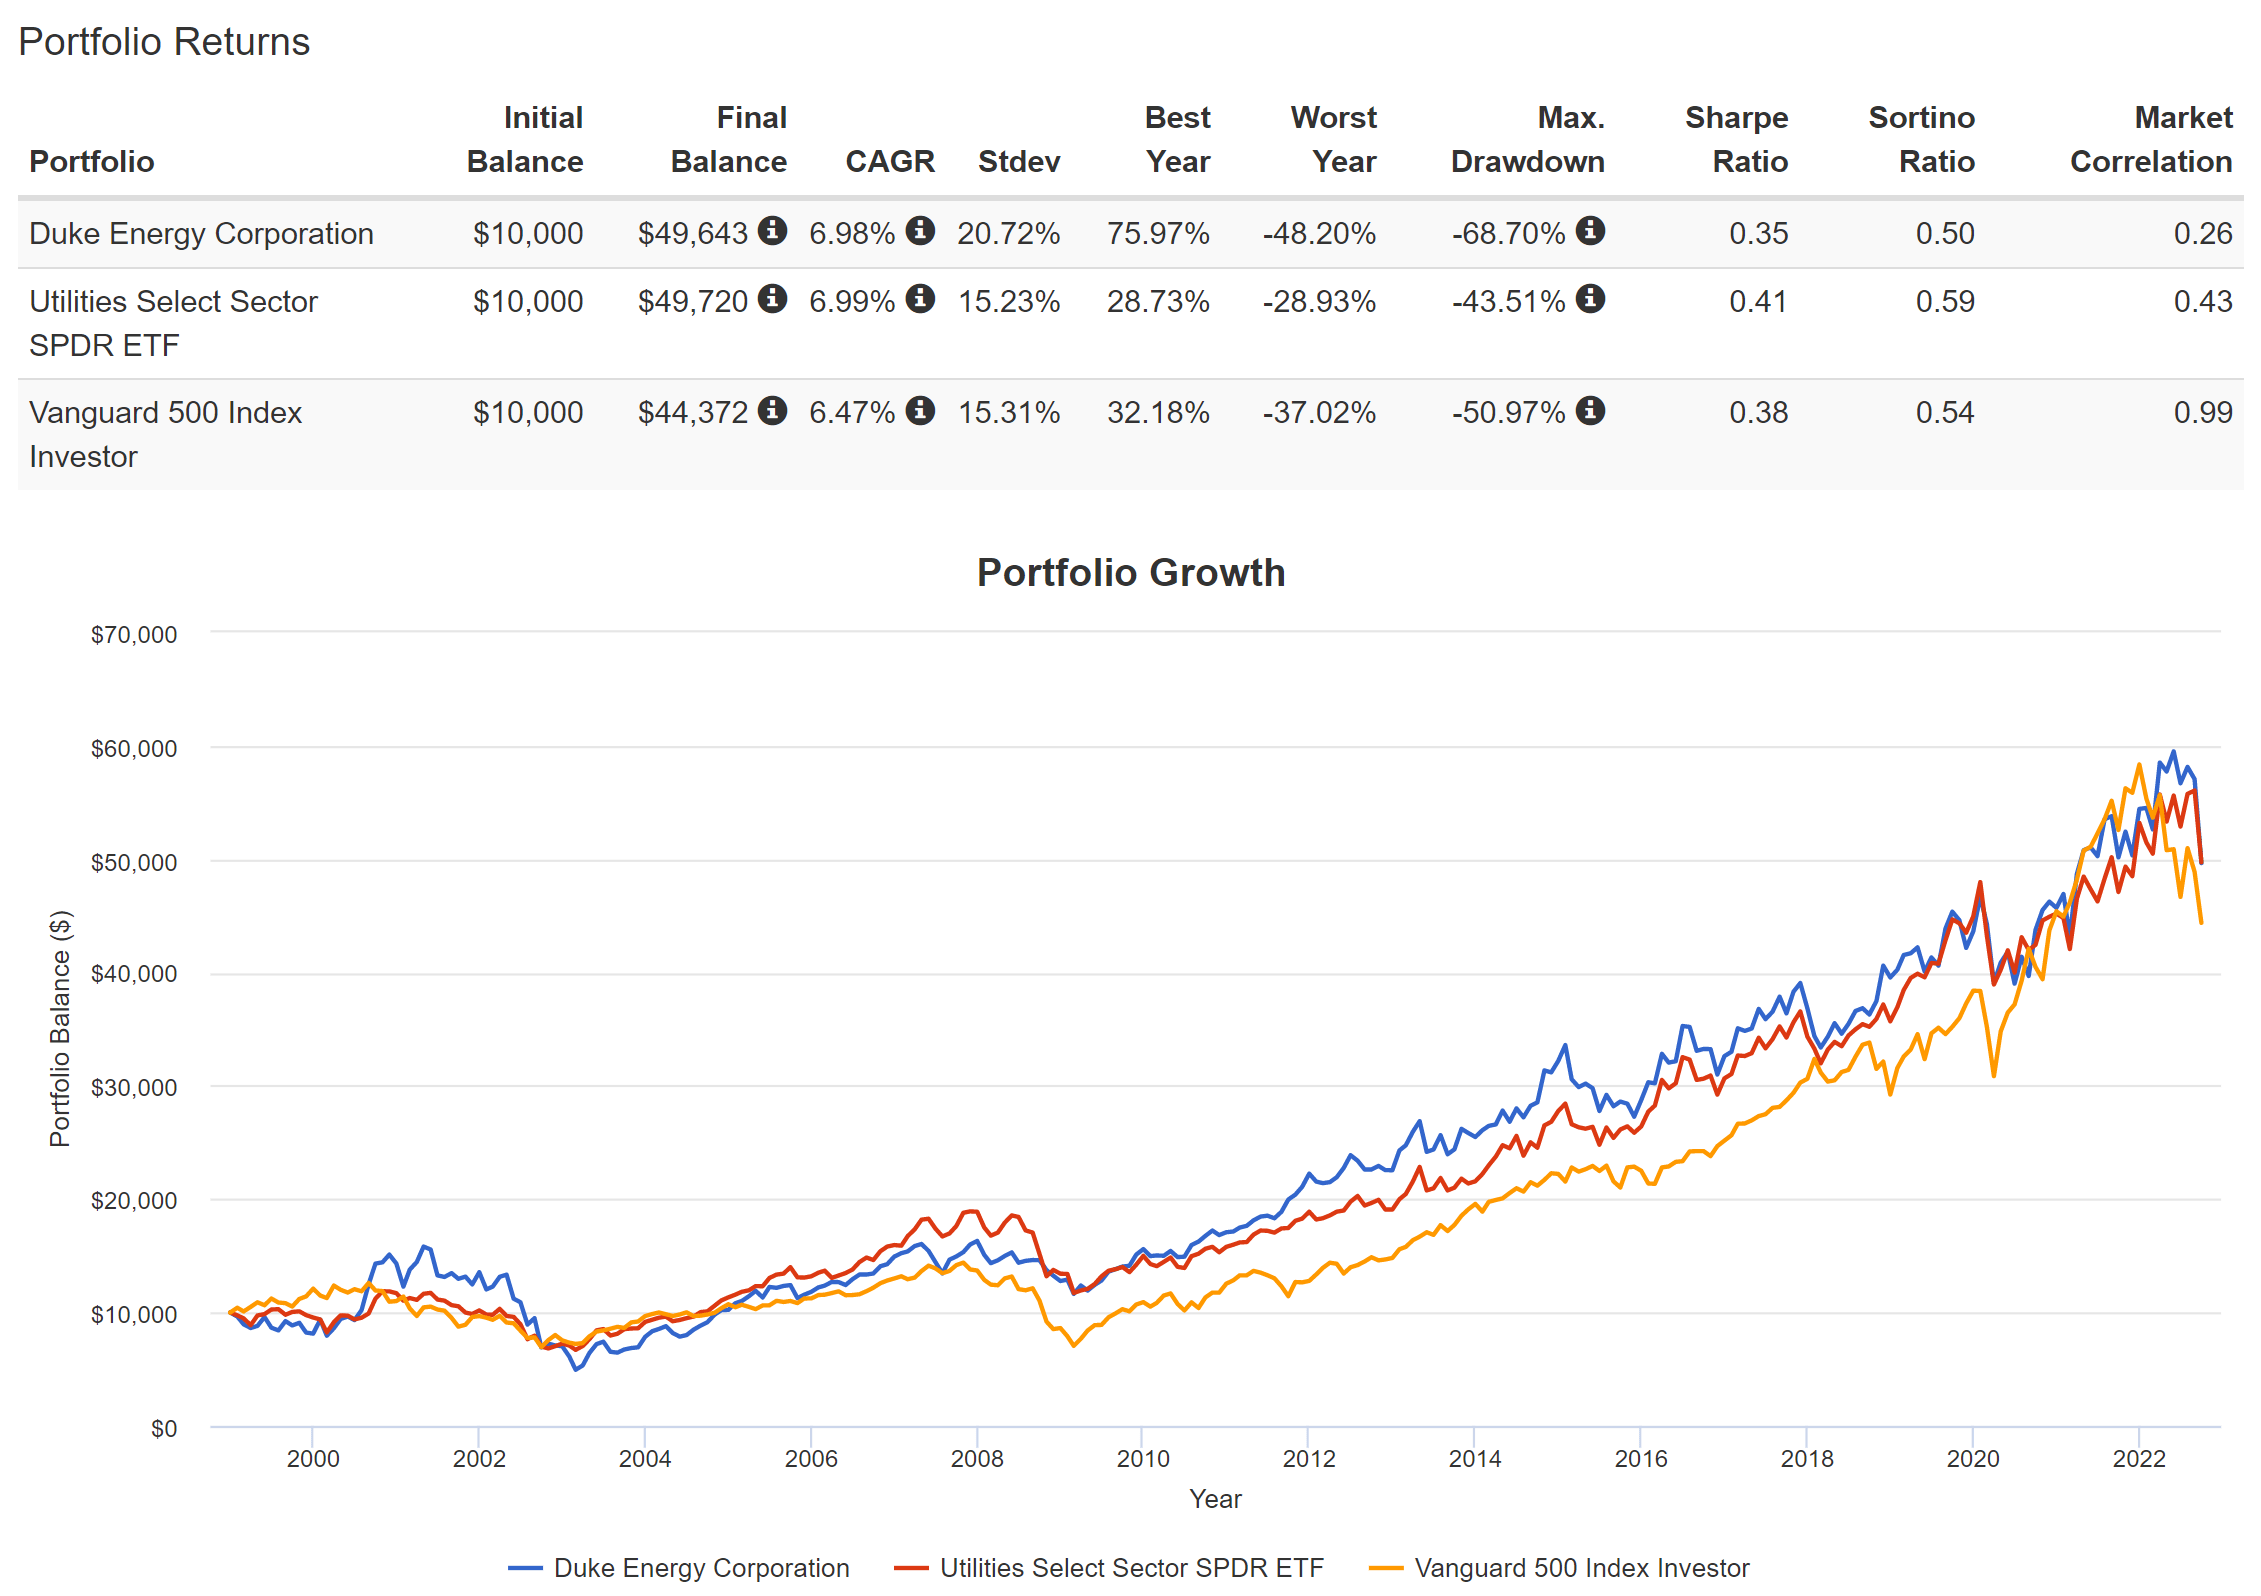
Second, the risk premium of DUK relative to XLU is also near a peak level since 2008 as you can see from the chart below. This chart shows the yield spread between DUK and XLU. The YS relative to the risk-free rate discussed above measures the risk premium relative to treasury rates. Similarly, the YS between DUK and XLU measures the risk premium of DUK relative to the overall utility sector. And you can see that DUK’s current risk premium is also extremely high relative to the utility sector.
Source: Author based on Seeking Alpha data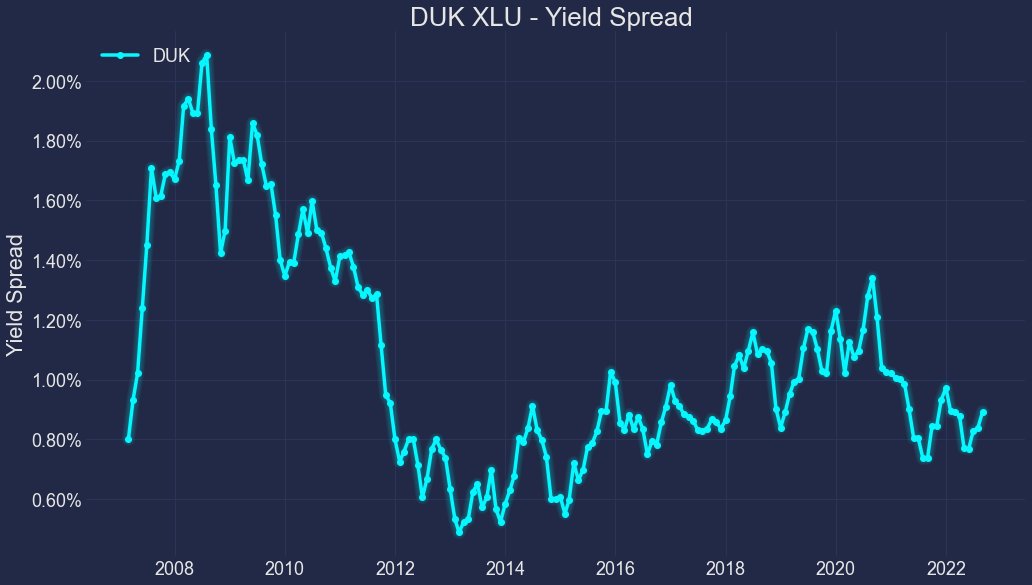
Other risks and final thoughts
Besides the above risks, the utility sector and DUK also face fundamental challenges in the long term, such as climate and environmental concerns. These risks have been detailed by other Seeking Alpha authors (and also in our other articles) and we won’t iterate them here anymore. Instead, we want to caution readers about the risks of relying on dividend yield spread. As detailed in our earlier article,
The use of yield spread is based on the assumption that dividend is a good measure of owners’ earnings for stocks or funds that pay dividends regularly. However, dividend yields do not always reflect business fundamentals due to several factors such as tax law, political climate, the composition of the market index, et al. As a result, we do not directly use the yield spread in our investment or asset allocation decisions. In practice, we first adjust for the above corrections and then use the adjusted yield spread in our investment decision. But the data and approach illustrated here is the first place we check.
To conclude, a few parameters have changed since our last coverage of DUK and the utility sector back in May 2022. Treasury rates have climbed substantially since then. To wit, 10-year treasury rates rose by a whole 1% from below 3.0% then to 4.01% as of this writing. At the same time, both DUK and XLU suffered some stock price corrections (about 15% and 7%, respectively) and partially compensated for the risks brought about by the hikes in interest rates. However, our view is that such corrections are not nearly enough to compensate for the heightened risks. The risk premium of both DUK and XLU are still at the highest level since 2008.
Especially for DUK, investors should not be lured because of its higher dividend payouts than XLU (see the chart below). The stock is exposed to far greater volatility risks than XLU despite similar long-term returns. Furthermore, DUK’s risk premium relative to XLU is also near a peak level since 2008.
Source: www.portfoliovisualizer.com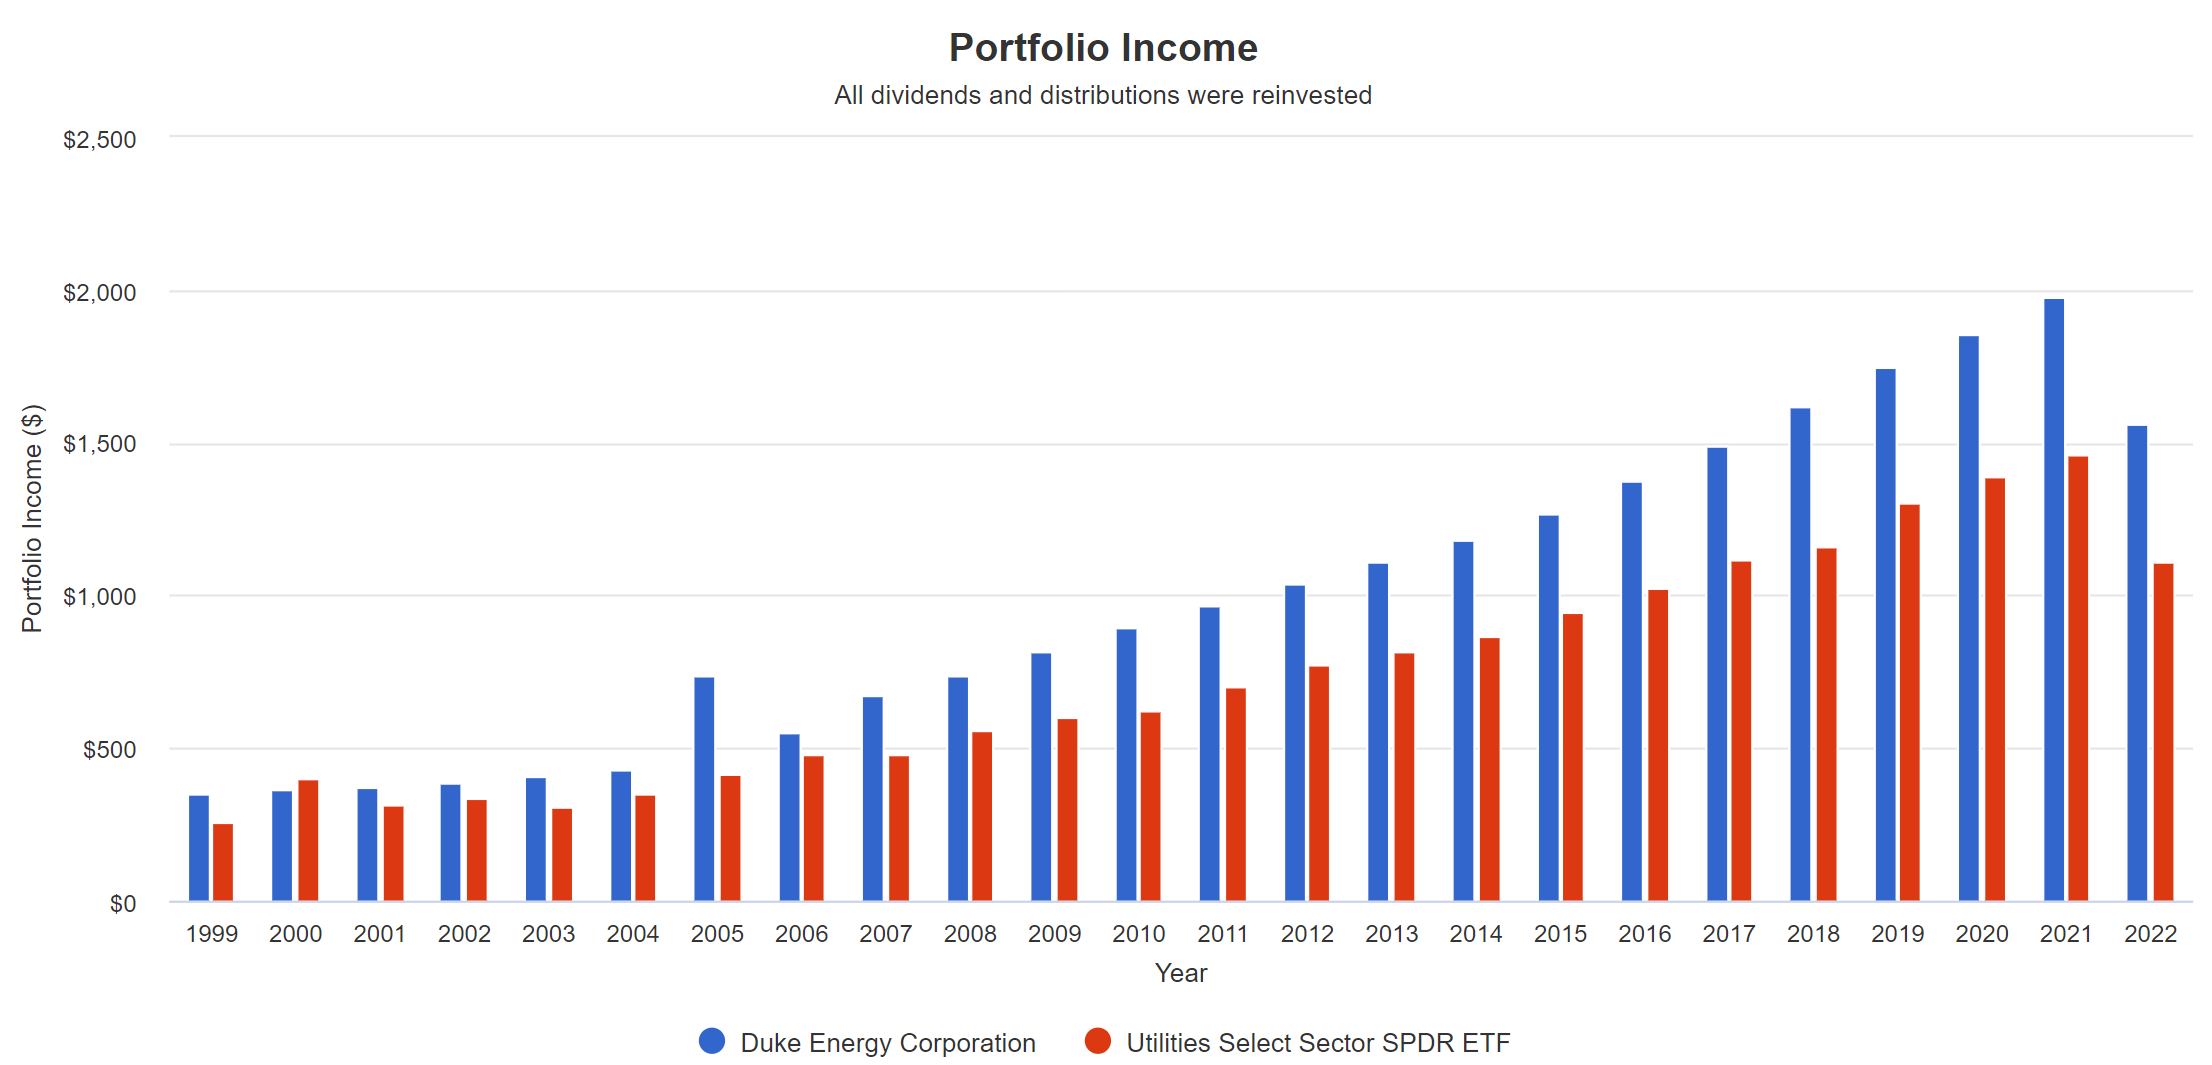
Be the first to comment