

JHVEPhoto
The WisdomTree U.S. Total Dividend ETF (NYSEARCA:DTD) is designed to track the fundamentally-weighted WisdomTree U.S. Dividend Index, or the “WTDI”: “The index is dividend weighted at the annual reconstitution in December to reflect the proportionate share of the aggregate cash dividends each component company is projected to pay in the coming year, based on the most recently declared dividend per share.” That certainly is a mouth-full and – in my opinion – is not a straightforward description. That being the case, let’s take a close look under the hood of the DTD ETF and see what it may offer to investors.
Investment Thesis
As most investors know by now, the dividend category greatly outperformed all other categories during the 2022 bear-market:
WisdomTree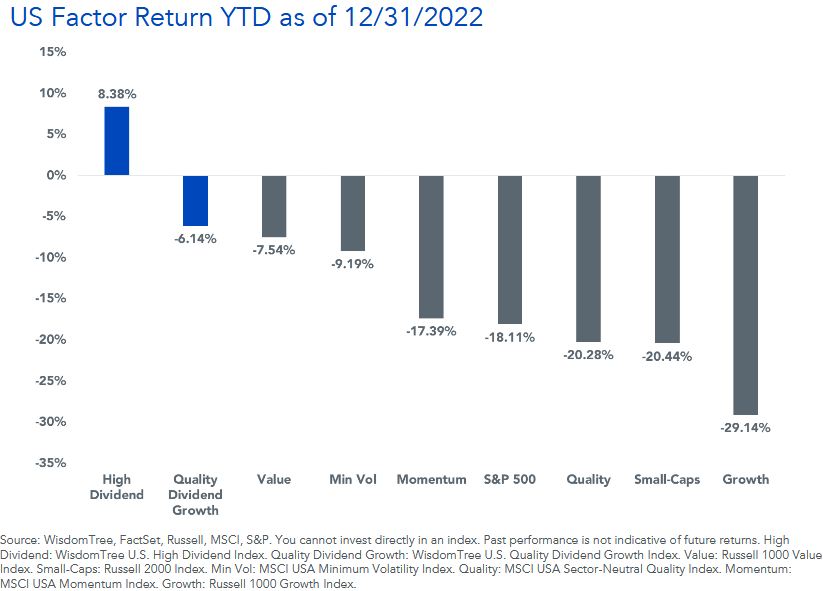
As my followers know, dividend paying and dividend-growth investments are important components of any well-diversified portfolio – and some retired investors actually require dividend income in order to meet their monthly expenses. That being the case, let’s take a look at the DTD ETF to see how it has positioned investors for success going forward.
Top-10 Holdings
The top-10 holdings in the DTD ETF are shown below and were taken directly from the WisdomTree DTD ETF webpage, where investors can find more detailed information on the fund. The top-10 holdings equate to what I consider to be a well-diversified 21.2% of the entire 829 company portfolio:
WisdomTree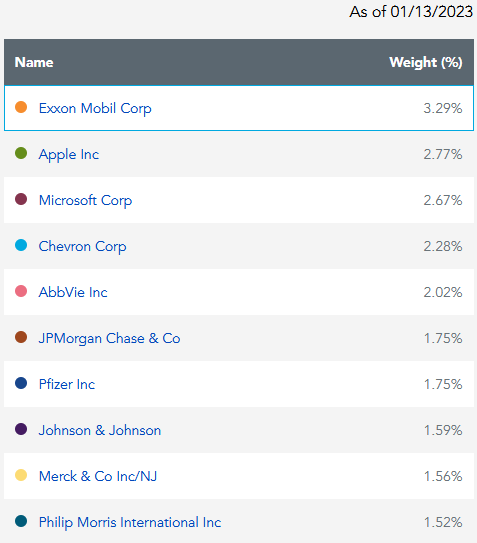
Exxon Mobil (XOM) is the #1 holding with a 3.3% weight. After a decade of very poor returns during the idiotic “drill baby drill” era when O&G companies were overproducing into an already over-supplied market, Exxon has finally discovered cap-ex discipline and, combined with Putin’s horrific war-on-Ukraine that broke the global energy (and food) supply chains impact on O&G prices, is currently generating huge free-cash-flow.
Exxon’s strategy has changed dramatically (for the better …) since Engine #1 won three board seats (see How Tiny Engine #1 Was Able To Turn Exxon Around) and, powered by upstream assets like Guyana and the Permian, is now on track to double earnings and cash-flow by 2027 (as compared to 2019). That being the case, and as the slide below from a recent Investor’s Presentation shows, Exxon is expected to generate tons of free-cash-flow going forward and will reward investors with strong dividends and share buybacks:
Exxon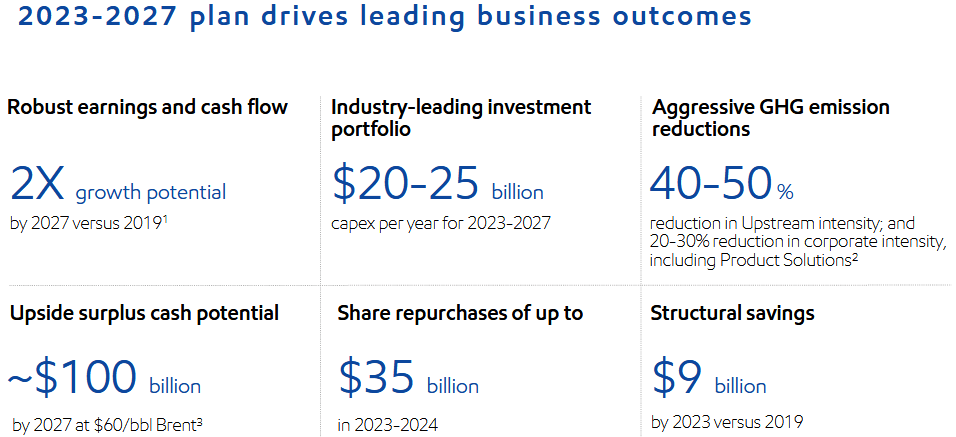
Exxon currently pays a $3.64/share annual dividend and yields 3.22%. However, note that since the company declared a rather anemic 3% increase in the quarterly dividend last year, shareholders arguably did not get a fair-shake. Indeed, as the slide above shows, Exxon apparently plans to over-emphasize share-buybacks going forward. That should be a warning sign for investors who remember the $10’s of billions worth of shareholder capital Exxon wasted on stock buybacks over the past 10-15 years.
The #2 holding with a 2.8% weight is Apple (AAPL) – a rather quizzical choice for a dividend focused ETF given Apple’s rather skimpy $0.92/share dividend and 0.68% yield. And the dividend growth hasn’t been that impressive either: last year, Apple’s quarterly dividend was only raised one penny, from $0.22 to $0.23. That said, perhaps the DTD fund counts share buybacks as “dividends”, and from that standpoint, Apple has been stellar. According to an article in Forbes, Apple has reduced its split adjusted outstanding share count by 22% over the past 5-years and by 39% since 2012:
Forbes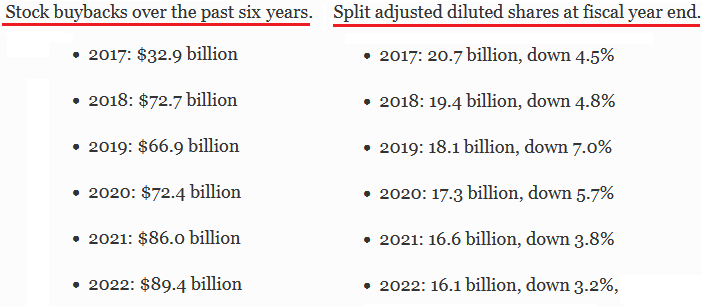
Microsoft (MSFT) is the #3 holding with a 2.7% stake. MSFT pays a $2.72/share annual dividend, and with the stock down some 21.5% over the past year, the yield has risen to 1.14%. For many years now, Microsoft was also ramping up its share buybacks, but as is so typical in corporate America these days, note that after the big decline last year – and when the stock is now arguably a much better value – the buybacks in the last quarter were down by $3.3 billion as compared to the previous quarter:
YCharts
Microsoft is investing heavily in OpenAI – the owner of ChatGPT – as a primary growth strategy going forward. Of course, Microsoft is also still rapidly growing its Azure Cloud operations as well.
The #4 holding is Chevron (CVX) with a 2.3% weight. Chevron is an excellent dividend growth stock with a relatively strong yield (3.2%) considering the stock was up 40% over the past year. Over the past three years Chevron has grown the dividend by an average of 5.8% per year and the dividend has doubled since 2010. Chevron plans to grow Permian production to between 1.2 and 1.5 million boe/d by 2030 and then hold it steady at that level until at least 2040.
Global pharmaceuticals company AbbVie (ABBV) is the #5 holding with a 2.0% weight. Seeking Alpha reports that ABBV has grown its dividend at a 5-year CAGR of 16.92%:
Seeking Alpha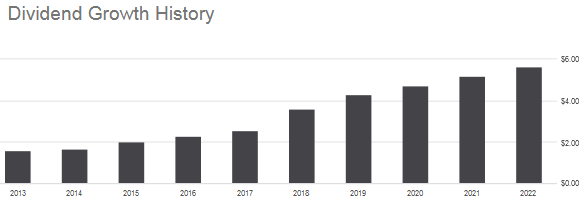
AbbVie currently pays a $5.92/share annual dividend and yields 3.85%
Two other big-pharma stocks are in the top-10 list: Pfizer (PFE) and Merck (MRK), which together equate to an aggregate weighting of 3.3%. These two companies yield 3.43% and 2.6%, respectively.
From a sector perspective, the DTD portfolio is nicely diversified and is most heavily weighted as follows:
WisdomTree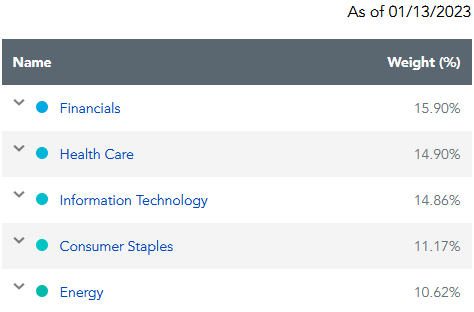
Performance
The DTD ETF has an admirable 10-year average annual total return of 11.40%:
WisdomTree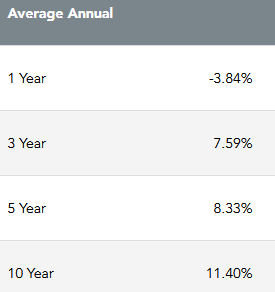
The following graphic compares the 5-year total returns of the DTD ETF versus the Schwab U.S. Dividend Equity ETF (SCHD):
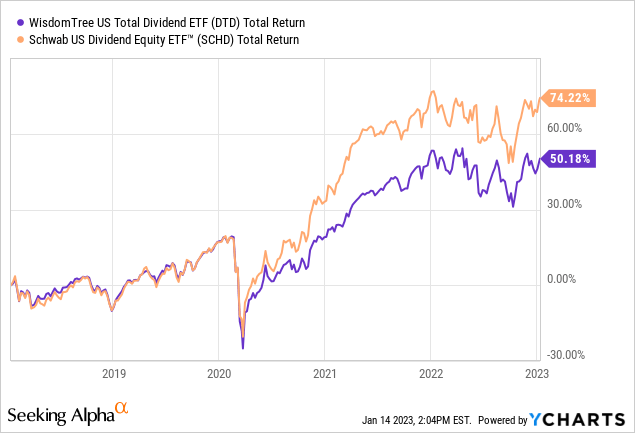
As you can see, the SCHD ETF has outperformed the DTD ETF by ~24% over the past 5-years.
Risks
As you can see by the graphic below, the DTD ETF trades at a significant discount to the S&P500 (shown in red, data by multipl.com):
WisdomTree, multipl.com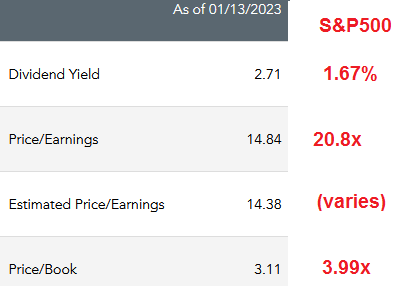
That being the case, the DTD fund has a more defensive stance as compared to the broad S&P 500, and therefore would likely outperform if the market continues to be challenged by headwinds, but also likely to under-perform when the market takes off again (which, as history shows us – it eventually will).
The biggest risk of holding the DTD ETF may be under-performing other dividend focused funds. I don’t know how a dividend focused fund can out-perform by holding 829 companies – the 300+ more than the entire S&P500. SCHD, by contrast, holds only 103. Perhaps the super large number of holdings in the DTD ETF is an attempt to justify its relatively high expense ratio.
Summary & Conclusion
As with most dividend oriented funds, I judge the DTD ETF by what is arguably considered the gold standard in the category: the SCHD ETF. From that standpoint, and with respect to 5-year total returns, the DTD fund failed the test. Note that DTD’s expense ratio is 0.28% – a full 22 basis points higher and more than 4x as compared to the SCHD’s expense ratio of only 0.06%. Meantime, the SEC 30-day yield for DTD (which pays monthly distributions) is 2.46% while SCHD’s is 3.29%.
Bottom line: DTD investors are actually paying more for significantly weaker returns as compared to the SCHD ETF. That being the case, I advise investors to SELL the DTD fund and move the proceeds into SCHD.
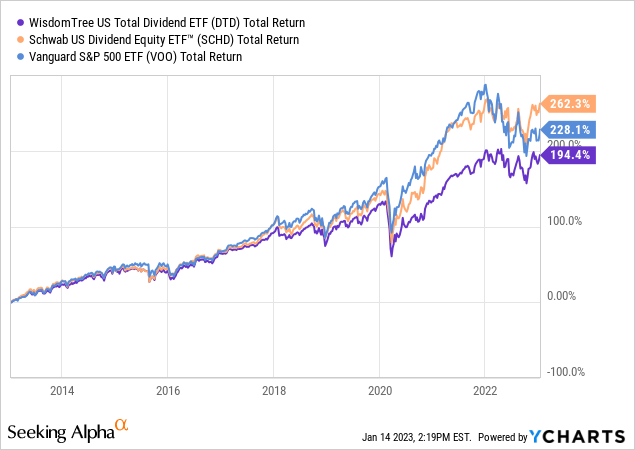
I’ll end with the following graphic, which compares the 10-year total returns of the DTD ETF with SCHD and with the S&P500 as represented by the Vanguard S&P500 ETF (VOO) and note that the DTD ETF under-performs the S&P500 as well:
Be the first to comment