

Scott Olson
We covered and assigned a sell rating to DraftKings (NASDAQ:DKNG) stock in December before its more than 50% capitulation. In this follow-up, we pose a juxtaposition by seeking dominance between a bullish and a bearish contest.
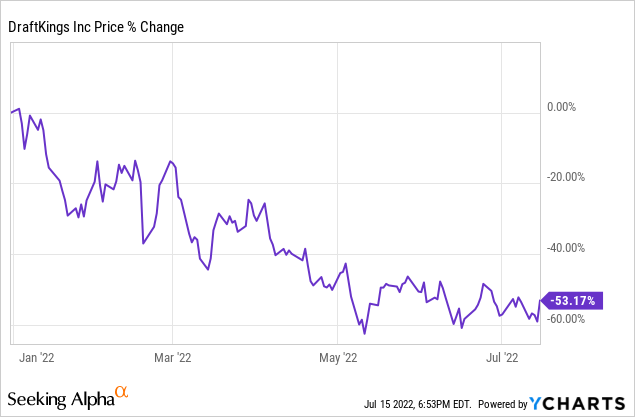
Our analysis leads us to re-affirm our sell rating of DraftKings as we believe its key influencing variables haven’t shifted, and thus it’s likely that the asset will resume its downward trajectory.
In our previous report, we outlined the critical role of the VIX (VIX) and the U.S. 10-year yield in determining DraftKings’ near-term price. We see the high implied spot rates as a continued challenge for DraftKings as contractionary economic policies could wane on consumer cyclical stocks such as DraftKings. Additionally, we’ve identified several other systemic and idiosyncratic variables that could dent DraftKings stock.
We allocate this sell rating with a half-year outlook, after which we’ll revise our position.
A Bullish Case
Operational Dynamics
DraftKings can be classified as a secular growth stock with its revenue surging at a CAGR (compound annual growth rate) of 101.86x. Therefore, in the current market context, DraftKings might be a lucrative investment, given secular growth stocks’ ability to plough through cyclical downturns.
Much of DraftKings’ recent revenue is down to its B2C segment, which surged by 44% year-over-year as per the company’s first-quarter financial results.
Finance Charts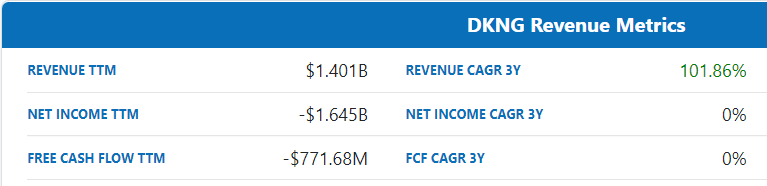
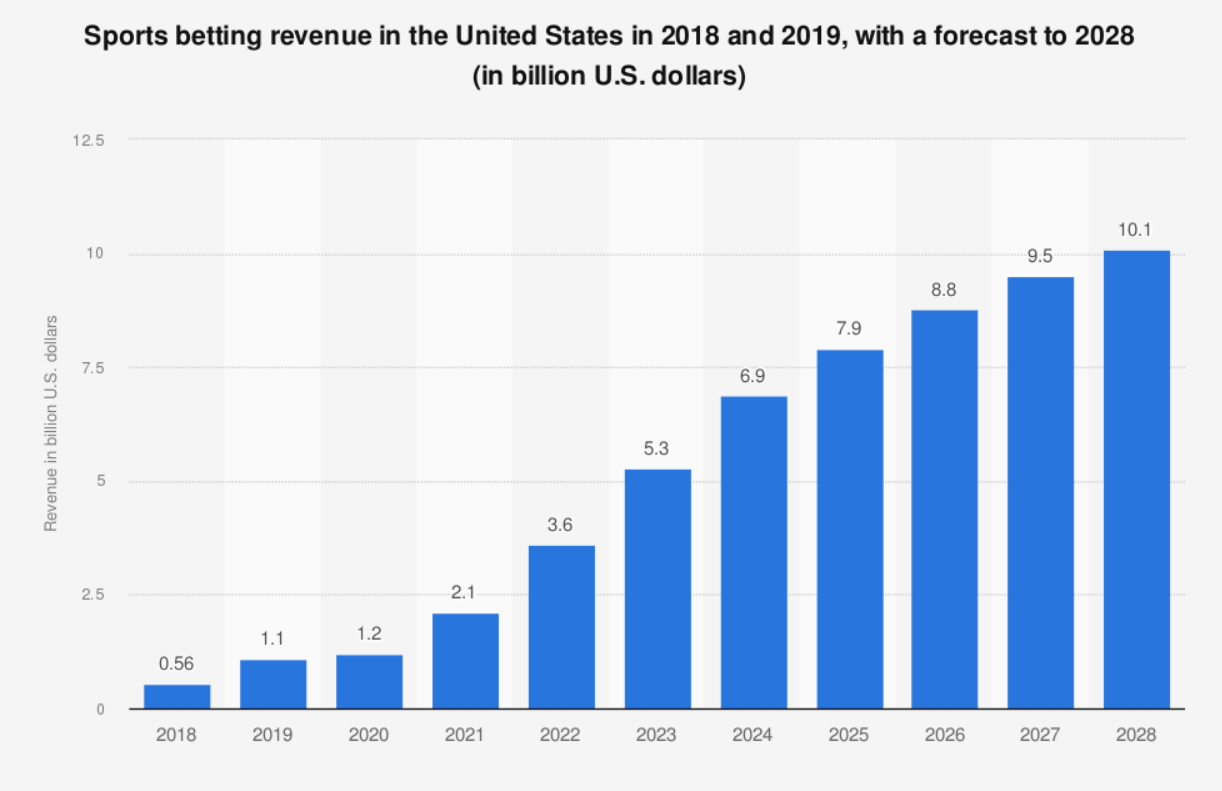
DraftKings’ B2C segment most of the time forms nearly 90% of its revenue mix and is primarily driven by sportsbook betting. As such, there shouldn’t be any surprise that the firm’s segment growth is robust because there’s currently a significant shift toward online betting platforms, as conveyed by the chart below. In addition, U.S. sports betting is growing exponentially and could exceed the $10 billion mark in spending by the year 2028. Therefore, given DraftKings’ projected 20% to 30% year-end market share, it’s possible that the firm could garner substantial growth from the segment.
Furthermore, DraftKings is still at an early stage of its growth cycle as its capacity only spans 36% of the United States. The company’s expansion hinges on legal battles. However, with its already impressive penetration, we could likely see the company expand into other territories soon.
Statista Statista
Price Level Analysis
Further to DraftKings’ organic growth is price level support. The first chart displays short interest, which is a function of the number of shares sold short with respect to the total float. As pictured below, DraftKings was a prime target for short sells during the formation of this year’s bear market. However, short interest has tapered off lately, and it seems as though the stock could rebound if we utilized the short interest ratio in isolation.
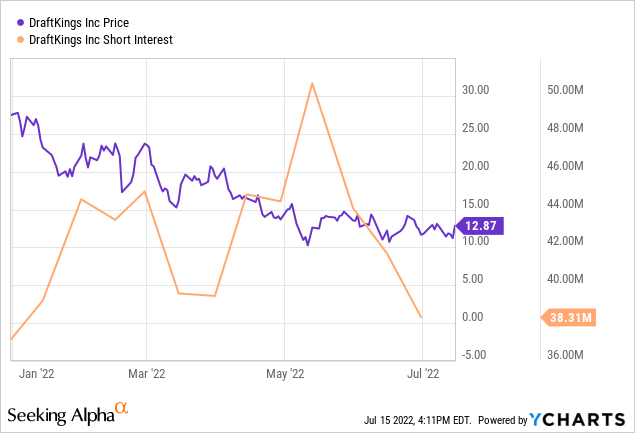
Furthermore, DraftKings exhibits solid technical support. Technical analysis provides helpful support when forecasting a stock’s future price because past price is a valid lagged variable/independent variable to fit into a predictive model.
DraftKings shows support at the $12.85 handle and resistance at the $14.33 handle, presenting an approximate 11.52% value gap.
Seeking Alpha; Trading View
A Bearish Case
Gambling Spending – Looking Ahead
Let’s contest the bullish case by starting off with an economic discussion. Firstly, it’s necessary to recognize that the yield curve has inverted, implying that a recession is en route. Even if a recession isn’t on the way, we’re likely to see a severe economic contraction parallel to interest rate hikes.
Contractionary monetary policies and stagnating economies have repeatedly shown to wane on consumer cyclical stocks, and I anticipate the effect on DraftKings to be no different.
Gurufocus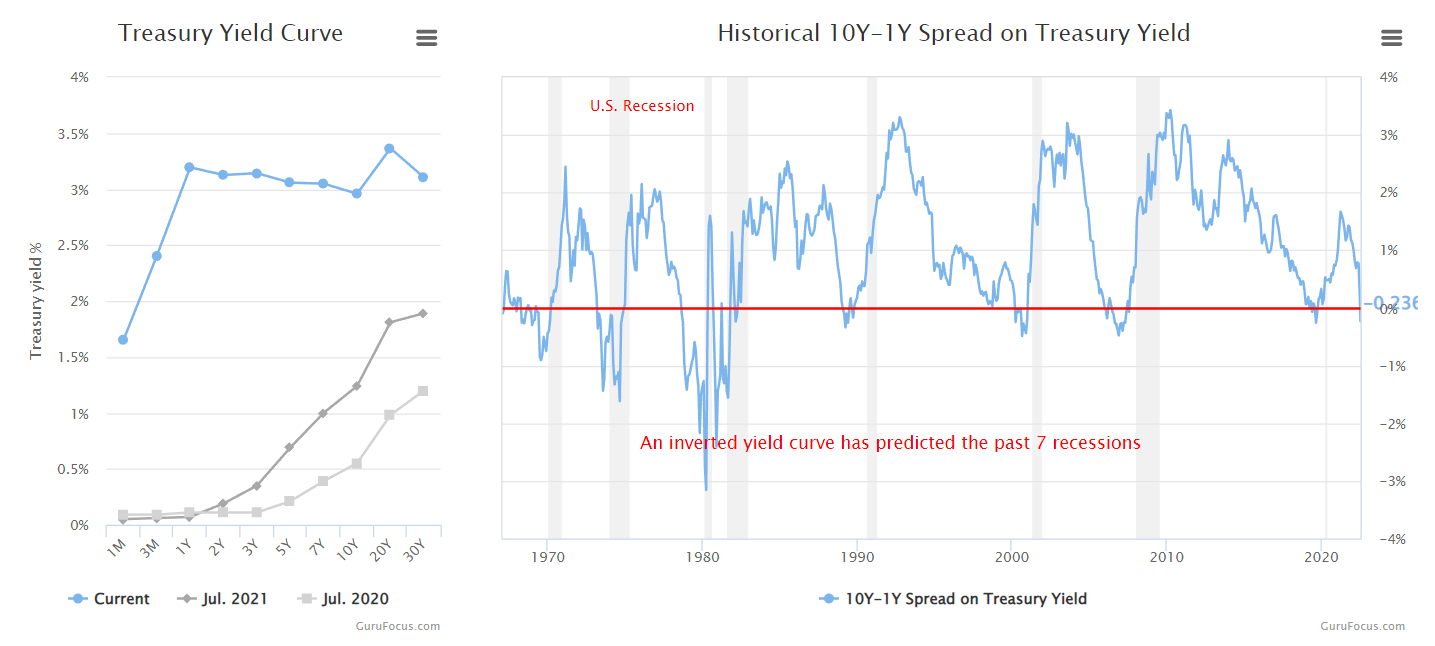
The regression analysis chart below conveys statistical significance based on the alternative hypothesis that investors do spend less on gambling during a recession. The symbol (B0) explains consumer spending during an economic expansion, whereas (B1) is the slope of spending in an economic contraction, which is clearly negative on aggregate. Thus, I expect gambling spending to recede if we’re to enter an economic contraction (stagflation or recession).
ResearchGate; Horvath, C., 2011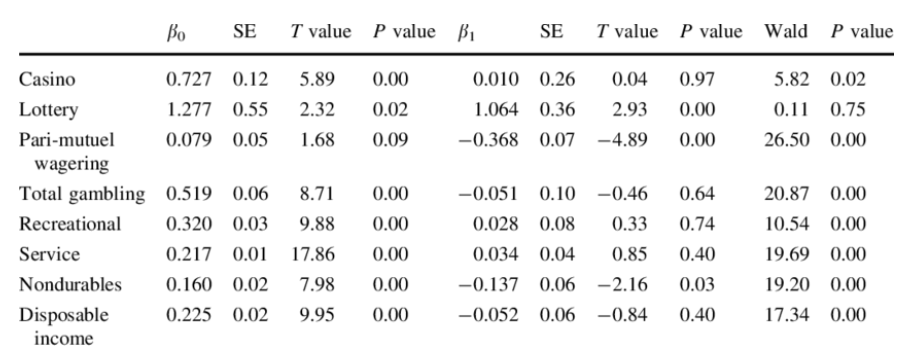
Operational Glitches
The company continues to struggle with input costs. I’m not overly worried about its R&D (research and development) spend as it’s a line item that often adds up to future growth. However, I’m concerned about its selling, general and administrative costs, which are being dragged by the company’s need to advertise aggressively to compete in an intensifying market. Additionally, DraftKings’ constant legal fights to expand its product offerings across all U.S. states could add up to a prolonged period of spending.
In addition, DraftKings’ slim gross margins (34.02%) mean that it doesn’t have much pricing flexibility, especially as its margins underscore its peer average by 7.46%.
Seeking Alpha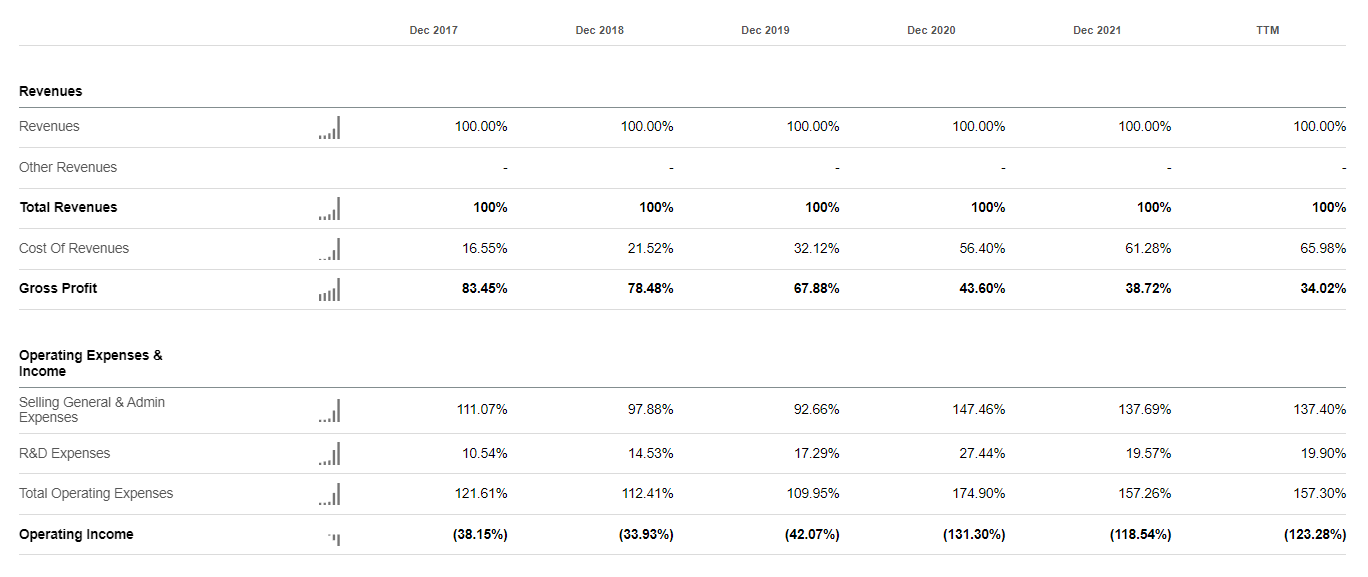
Valuation Concerns
DraftKings stock is overvalued based on relative valuation metrics. The company’s EV/Sales ratio might not be in tatters, but it’s trading at a 1.68x surplus to its peer group, implying that DraftKings isn’t a “best in class” gambling stock.
Furthermore, DraftKings stock is trading at 3.25x its sales. Many price multiples are often of little use when it comes to high-growth technology stocks. Nevertheless, because the price-to-sales ratio measures the firm’s top-line relative to its stock price, the ratio can be utilized throughout industry and company lifecycles. Thus, with a price-to-sales ratio of 3.025x, DraftKings is considered an overvalued asset.
| Enterprise Value/Sales | 3.02x |
| Price/Sales | 3.25x |
Source: Seeking Alpha
Quantitative Risk
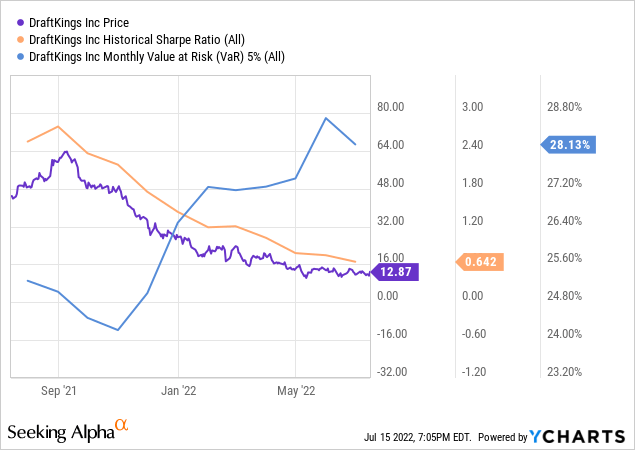
DraftKings stock possesses a risk/return imbalance. The stock’s Sharpe Ratio is below 1.00, indicating that its return metrics aren’t attractive given the broader market volatility. Moreover, the stock’s value at risk measure implies that DraftKings will likely lose 28.13% in 5% of its traded months.
These metrics wouldn’t be a problem during a minor market dip. However, we’re in a deep bear market with recession fears spanning the financial markets. Thus, the metrics in the chart below shouldn’t be taken lightly.
Concluding Thoughts
We reaffirm our sell rating on DraftKings. Based on our analysis, the company’s high ex-post growth rates will likely be overshadowed by softening in sportsbook spending, given the economic climate. In addition, cost issues could hinder DraftKings’ pricing power and ad-spending moving forward. Lastly, technical analysis indicates that DraftKings has reached a support level; however, the stock remains overvalued, and a quantitative risk analysis conveys trouble.
Be the first to comment