

Lemon_tm
Introduction
Upon entering the year, Dow Inc. (NYSE:DOW) saw a desirable outlook for shareholder returns during 2022, as my previous article highlighted. Despite seeing stronger than expected financial performance thus far into the year, it nevertheless still seems that everything is up apart from their dividends. They currently offer a moderate yield of 5.46%, as discussed within this follow-up analysis that also reviews their recently released first half of 2022 results.
Executive Summary & Ratings
Since many readers are likely short on time, the table below provides a very brief executive summary and ratings for the primary criteria that were assessed. This Google Document provides a list of all my equivalent ratings as well as more information regarding my rating system. The following section provides a detailed analysis for those readers who are wishing to dig deeper into their situation.
Author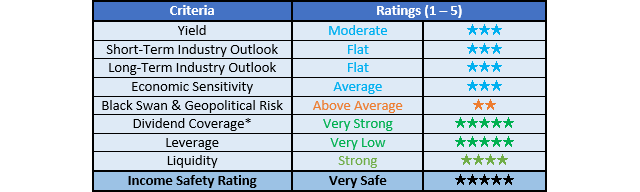
*Instead of simply assessing dividend coverage through earnings per share cash flow, I prefer to utilize free cash flow since it provides the toughest criteria and also best captures the true impact upon their financial position.
Detailed Analysis
Author
Following Dow’s strong performance during 2021, it was positive to see this momentum continue, with the first half of 2022 marking more improvements as their operating cash flow increased to $3.457b. This was slightly more than twice its previous result of $1.713b during the first half of 2021. Whilst their previous results were held down by a sizeable working capital build, interestingly, the same can also be said for their newest results. If both of these are removed, their underlying operating cash flow for the first half of 2022 increases by slightly more than $2b to land at $5.504b, which is still a massive 55.44% higher year-on-year versus their previous equivalent result of $3.541b during the first half of 2021.
Even if including the impact of this working capital build, their free cash flow of $2.519b during the first half of 2022 still provided very strong coverage of 247.45% to their dividend payments of $1.018b, and thus sees ample spare free cash flow to push their dividends up. When looking ahead into the remainder of 2022, there are reasons to expect this stronger cash flow performance to continue, with their guidance up versus when the calendar rolled around seven months ago, as the table included below displays.
Dow Second Quarter Of 2022 Results Presentation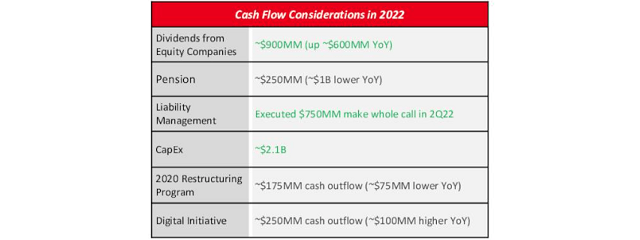
Whilst Dow cannot necessarily provide exact cash flow performance guidance due to the inherent volatility in commodity prices, they still provide guidance for dividends from equity companies, which can serve as a proxy for their core company. It can be seen that they now expect these to reach $900m during 2022, which apart from being up $600m year-on-year is also an impressive $350m up versus their previous guidance for $550m, as per my previously linked article.
It stands to reason that if their equity-accounted companies are expected to continue posting stronger than expected results and thus dividends, so should their core company. Meanwhile, they also edged their capital expenditure guidance for 2022 slightly lower to $2.1b versus its previous guidance for $2.2b, thereby helping push their free cash flow up slightly. On a side note, their “$750m make whole call” refers to an early repayment of debt, which was mostly funded through cash and thus as subsequently discussed, their net debt remained broadly changed.
Since their guidance for 2022 is up along with their stronger cash flow performance, and they clearly have plenty of spare free cash flow, it once again seems odd that there was no mention of also pushing their dividends up, especially given the extent they have now improved their fundamentals since their demerger in 2019, as the table included below displays.
Dow Second Quarter Of 2022 Results Presentation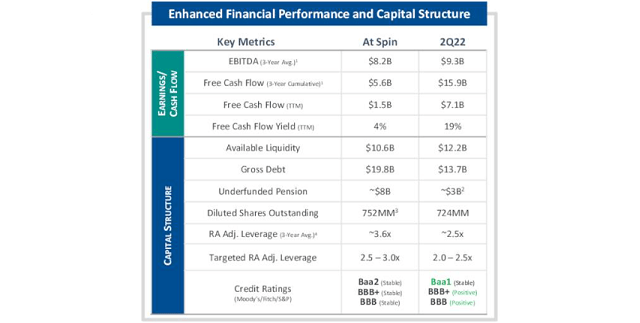
Upon looking further back at their financial performance, it can be seen that everything is up, from their accrual-based EBITDA right through to their free cash flow, apart from their quarterly dividends that remain at their same old $0.70 per share. Meanwhile, Dow’s net debt and thus leverage is significantly improved, thereby also seeing the strength of their financial position up and providing more credence behind what would normally see a company push their dividends up. When reading their latest earnings conference call for the second quarter of 2022, there was no mention nor hint of higher dividends on the horizon, and thus it remains a wait-and-see situation, which in my eyes pulls back on the appeal of their shares heading into the future.
Author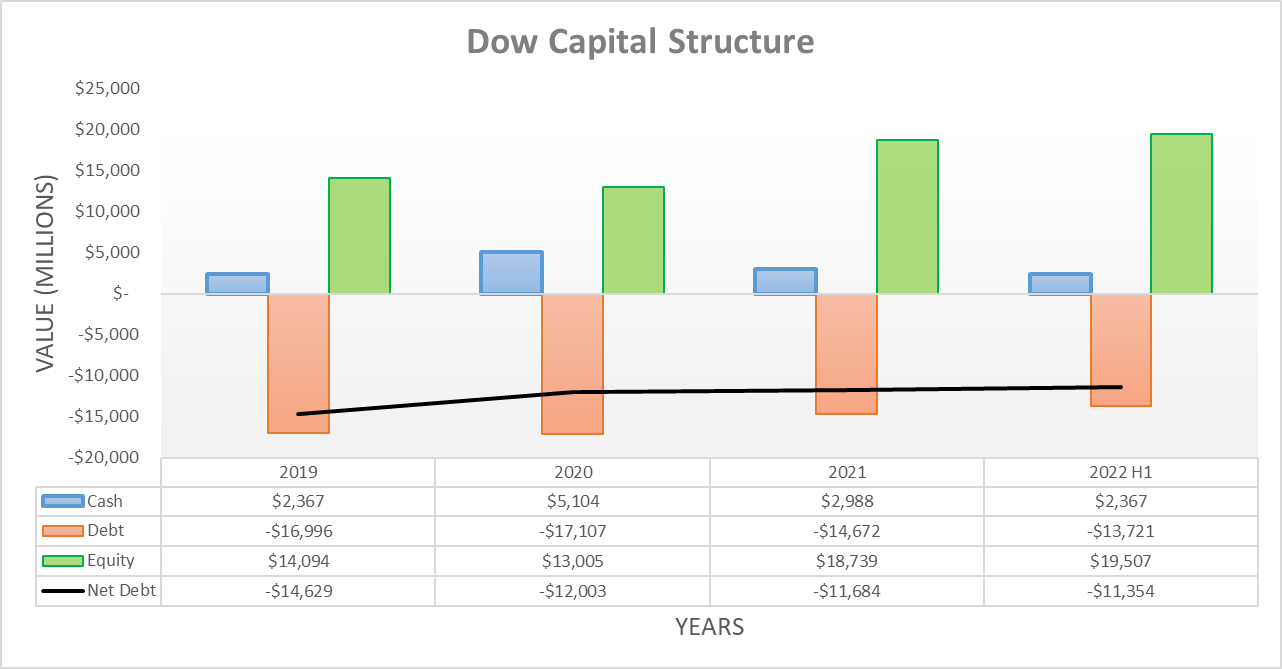
Despite there being several moving parts, overall their capital structure remained broadly unchanged following the first half of 2022, with their most important line item, net debt, remaining barely changed at $11.354b versus where it ended 2021 at $11.684b. Their $1.501b of excess free cash flow after dividend payments was mostly utilized to fund $1.4b of share buybacks with a relatively immaterial net sale of investments accounting for the rest of the change. If not for their sizeable working capital build, their net debt would have fallen circa $2b lower and thus below $10b for the first time in many years. This points favorably for the remainder of 2022 and heading into 2023. Following these only minimal changes, it would be redundant to reassess their leverage and liquidity in detail.
The two relevant graphs have still been included below to provide context for any new readers, which shows that thanks to their stronger financial performance thus far into 2022, their leverage is now very low. This is primarily evidenced by their respective net debt-to-EBITDA and net debt-to-operating cash flow of 0.48 and 0.52 now sitting below the applicable threshold of 1.00, unlike their previous respective results of 1.00 and 1.67 at the end of 2021. Meanwhile, their liquidity remains strong with their respective current and cash ratios of 1.64 and 0.18 that are effectively very similar to their previous respective results of 1.58 and 0.23 at the end of 2021. If interested in further details regarding these two topics, please refer to my previously linked article.
Author
Conclusion
In my eyes, it seems quite odd that after another strong start to a year marking more improvements since their demerger in 2019, which management was happy to promote, their quarterly dividends still remain static with no discussion of them being push up on the horizon. Despite being somewhat disappointing, given their strong free cash flow and higher guidance, I continue to believe that my buy rating is appropriate, but at the same time with a reminder to keep any investment diversified given the risk of a recession on the horizon.
Notes: Unless specified otherwise, all figures in this article were taken from Dow’s SEC filings, all calculated figures were performed by the author.
Be the first to comment