

DOW JONES, NIKKEI 225, ASX 200 INDEX OUTLOOK:
- Dow Jones, S&P 500 and Nasdaq 100 closed +1.46%, +0.60% and -0.33% respectively
- 10-Year Treasury yield retreated to 1.518% as core inflation came below expectation
- Reflation trade is back in centerstage after House approval of the massive fiscal stimulus

Recommended by Margaret Yang, CFA
Get Your Free Equities Forecast
Inflation, Fiscal Stimulus, Yields, US Dollar, Asia-Pacific at Open:
Wall Street equities traded broadly higher as inflation fears eased following a lower-than-expected US February core CPI data. The reading came in at 1.3% YoY, compared to the baseline forecast of 1.4%. The headline CPI reading, which includes volatile food and energy prices, came in line with expectations at 1.7%. As a result, the 10-year US Treasury yield retreated for a second day to 1.518% and the US Dollar index (DXY) fell to 91.79, alleviating pressure on risk assets and precious metals. The Dow Jones index climbed 1.46%, with all sectors ending in the green. This may set a positive tone for Asia-Pacific stocks at open, although the tech sector may lag behind as the reflation trade appears to be dominating again.
Congress has approved the $1.9 trillion US Covid relief package on Wednesday, paving the way for direct stimulus payments to a majority of the US households and an extension of jobless benefits. With the economic recovery outlook brightening, the reflation trade is back in centerstage, resulting in a rotation from tech into cyclically-oriented sectors. Elsewhere, Bitcoin prices surged to above US$ 56k and attempted to challenge its all-time high of US$ 58k last seen in the end of February.
Discover what kind of forex trader you are

Asia-Pacific markets look set to trade in a positive tone, with futures across Japan, mainland China, Australia, Hong Kong, Singapore Malaysia and India pointing to open mildly higher. Australia’s ASX 200 index traded higher at open, but the index quickly swung lower as losses in the technology sector (-2.25%) widened. Cyclical-sensitive sectors were outperforming however, including industrials (+1.71%), energy (+1.29%) and consumer discretionary (+1.15%). Japan’s Nikkei 225 index is poised to trade 0.5% higher at open.
Looking ahead, the ECB interest rate decision and press conference headline the economic docket alongside US weekly initial jobless claims data. The ECB is widely expected to keep the policy interest rate unchanged, but traders will closely scrutinize whether or not the central bank will twist its bond-purchasing program to address rising longer-term yields. Find out more from DailyFX calendar.
Looking back to Wednesday’s close, all 9 Dow Jones sectors ended higher, with 86.7% of the index’s constituents closing in the green. industrials (+3.30%), materials (+2.94%) and financials (+2.30) were among the best performers, while healthcare (+0.08%) and information technology (+0.44%) trailed behind.
Dow Jones Sector Performance 10-03-2021
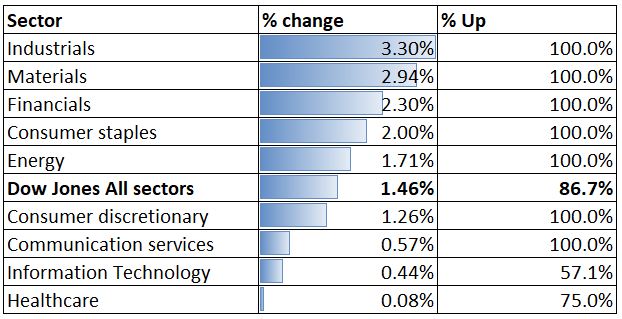
Source: Bloomberg, DailyFX
Starts in:
Live now:
Mar 11
( 16:03 GMT )

Learn about trading global equities
Trader’s Toolbox: How to Identify Price Trends with Trader Sentiment
Dow Jones Index Technical Analysis
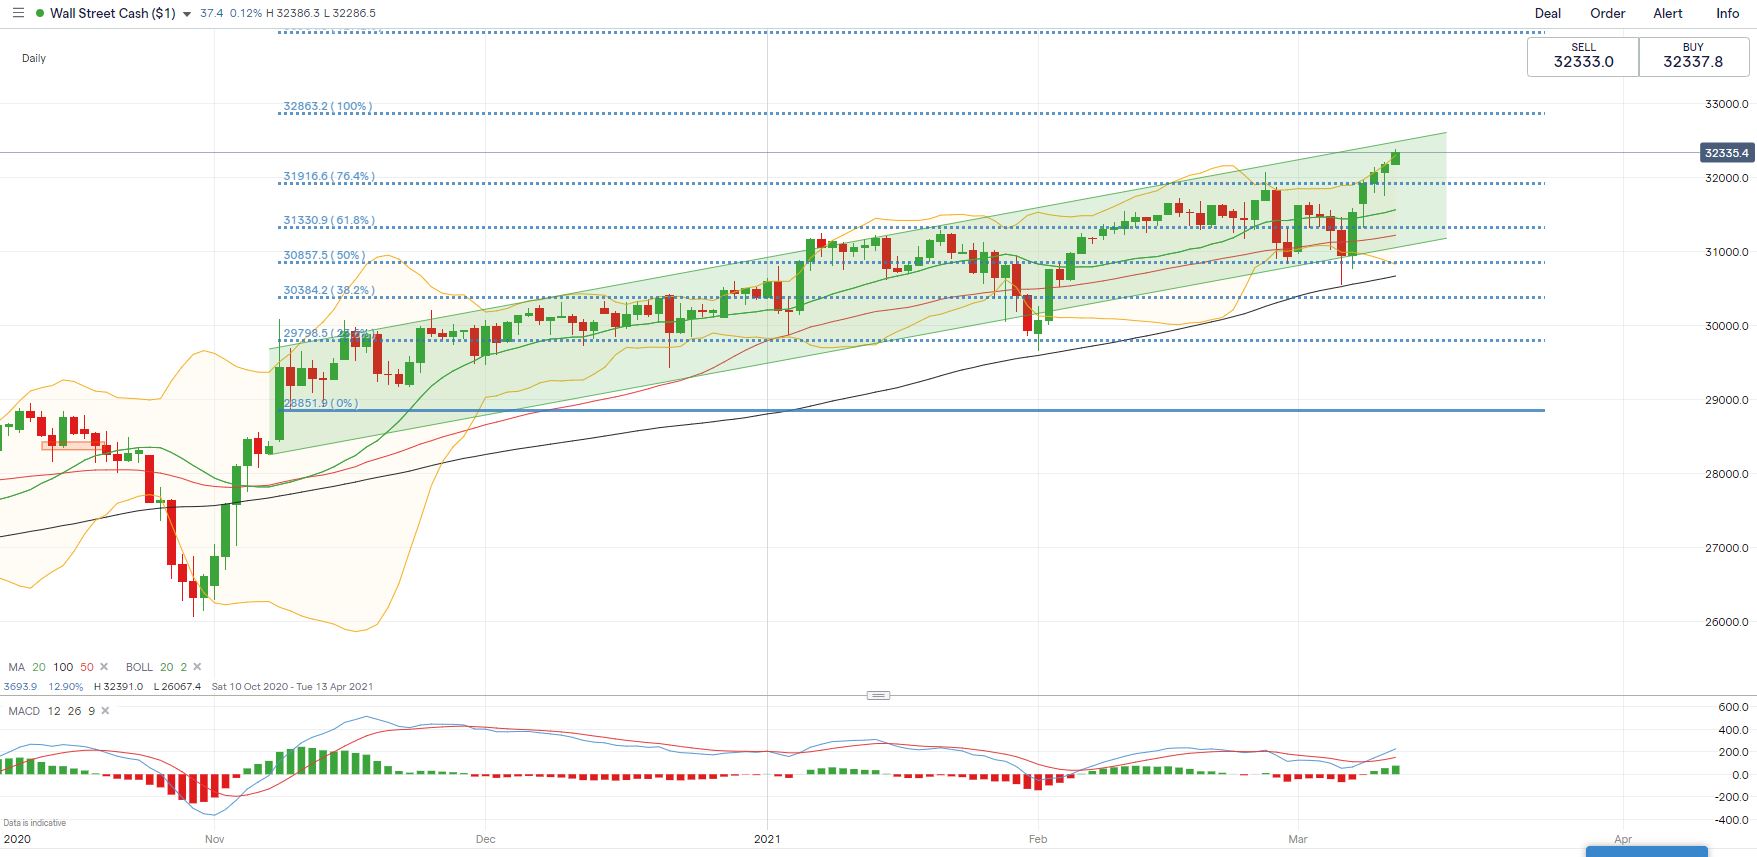
The Dow Jones indexextended higher within the “Ascending Channel” formed since early November 2020 and closed at all-time highs on Wednesday. The ceiling of the channel may serve as an immediate resistance, breaking it may intensify near-term buying pressure and bring the 100% Fibonacci extension (32,863) into focus. The overall trend remains bullish-biased as suggested by the upward-sloped moving averages. The MACD indicator has formed a bullish crossover, underscoring upward momentum.
Dow Jones Index – Daily Chart
Nikkei 225 Index Technical Analysis:
The Nikkei 225 index failed to breach the 161.8% Fibonacci extension level (30,455) and has since entered a technical correction. An immediate support level can be found at around 28,534, where the 50-day SMA and the 100% Fibonacci extension intercept. An immediate resistance level can be found at 29,380 (the 127.2% Fibonacci extension). A daily close above this level would probably intensify near-term buying pressure and bring the next key resistance level of 30,455 into focus. The MACD indicator continued to trend lower, suggesting that near-term momentum is tilted to the downside.
Nikkei 225 Index – Daily Chart
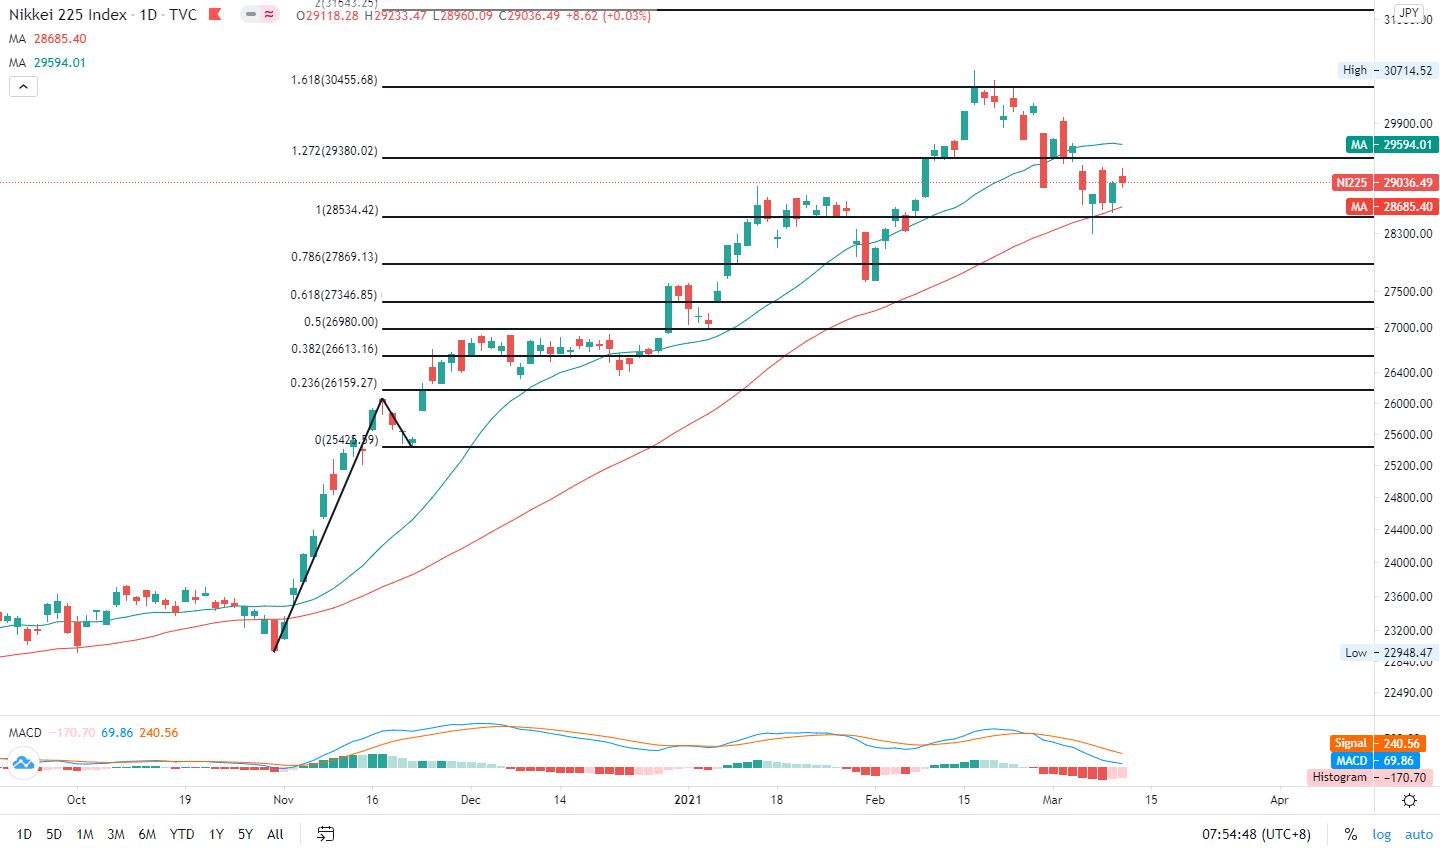
Chart by TradingView
ASX 200 Index Technical Analysis:
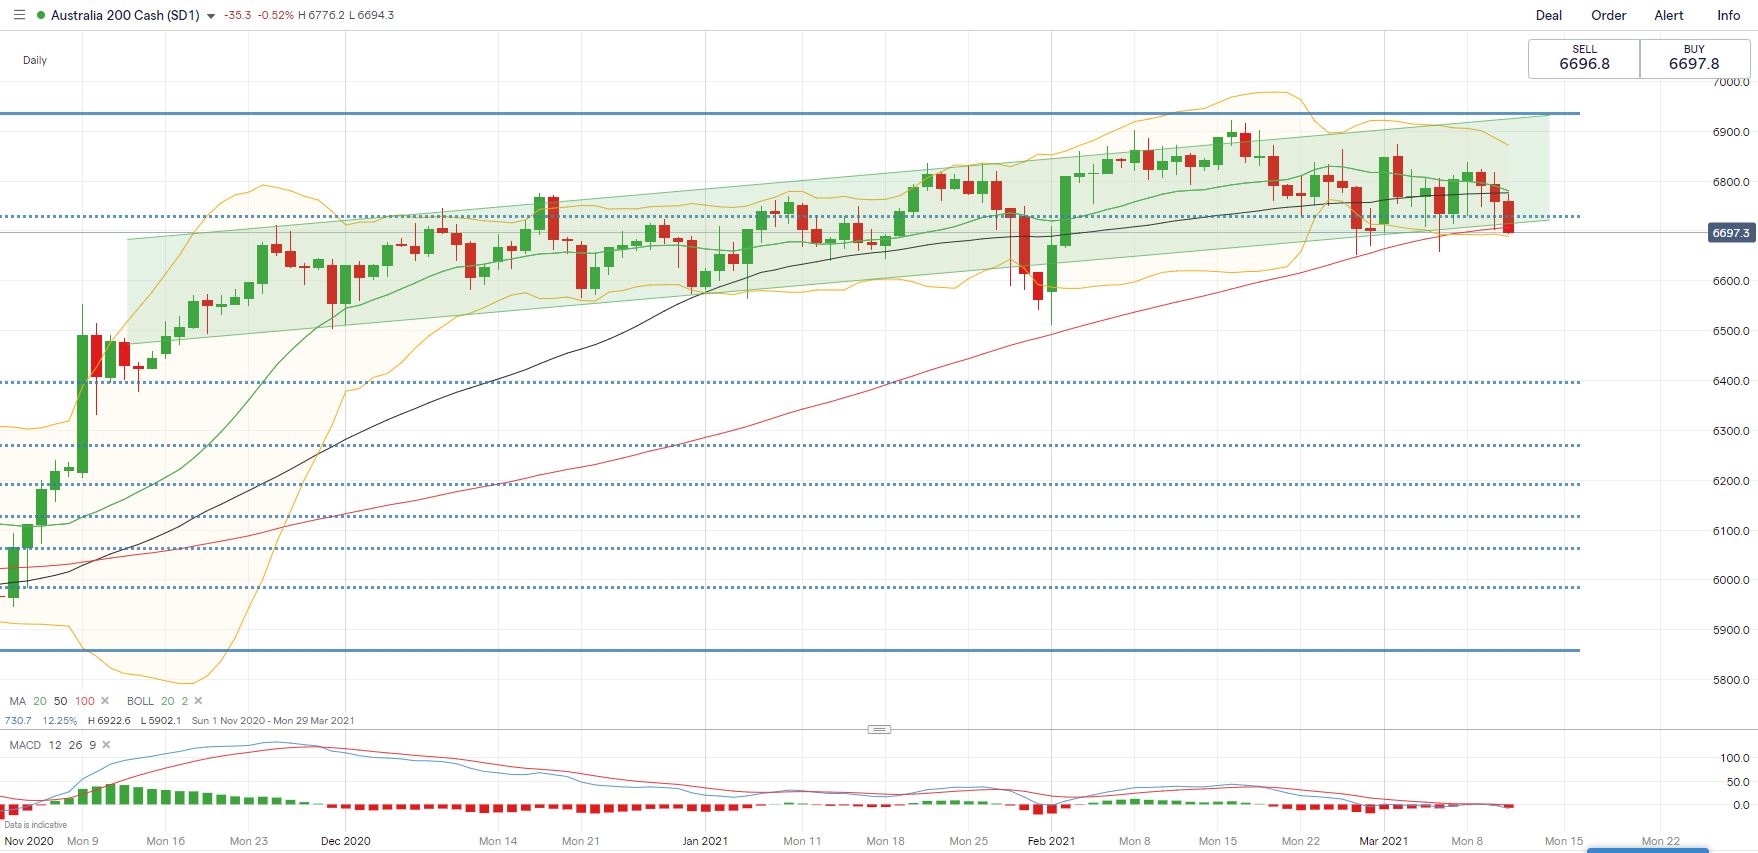
The ASX 200 index is on the verge of breaking below the “Ascending Channel” formed since mid-November. A key support level can be found at 6,700, where the floor of the channel and the 50-Day Simple Moving Average (SMA) line intercept. Breaking this level may intensify near-term selling pressure and open the floor for further losses with an eye on 6,600 for support. The MACD indicator is trending lower beneath the neutral midpoint, suggesting that near-term momentum remains weak.
ASX 200 Index – Daily Chart

Recommended by Margaret Yang, CFA
Improve your trading with IG Client Sentiment Data
— Written by Margaret Yang, Strategist for DailyFX.com
To contact Margaret, use the Comments section below or @margaretyjy on Twitter
Be the first to comment