

Bill Pugliano
Dow Inc. (NYSE:DOW) is a multinational firm that specializes in chemical and materials science products. Dow was founded in 1897 and has a long history of innovation and growth. In this article, I will try to analyze whether Dow would be a good addition to a portfolio of a long-term investor.
Brief introduction of the recent history of Dow
In 2017, Dow merged with DuPont, which created a combined company with a market value of over $130 billion. Relatively quickly after this, at the 1st of April 2019, the group split again, creating the companies of Dow, Corteva, Inc. (CTVA) (which specializes in agricultural chemicals and seeds), and DuPont de Nemours, Inc. (DD).
After the split, Dow focused on materials science products which include plastics, coatings, and adhesives. Its products are used in a wide range of industries, from construction and automotive to packaging and electronics. Dow owns a diverse product portfolio and has a strong presence in several high-growth markets, including electronics, and construction. Its products are also essential to the manufacturing of a wide range of consumer goods, making it a key player in the global economy.
Financials
Let us take a look at some financial metrics to estimate whether Dow could be a good addition to an investor’s portfolio. In my articles I usually focus on long-term investors, since this is what I am myself. I view decent and preferably growing dividends as a plus, and valuation depends on growth prospects and the financial situation of the company I am investigating. Now without further ado, let us look at some graphs of Dow.
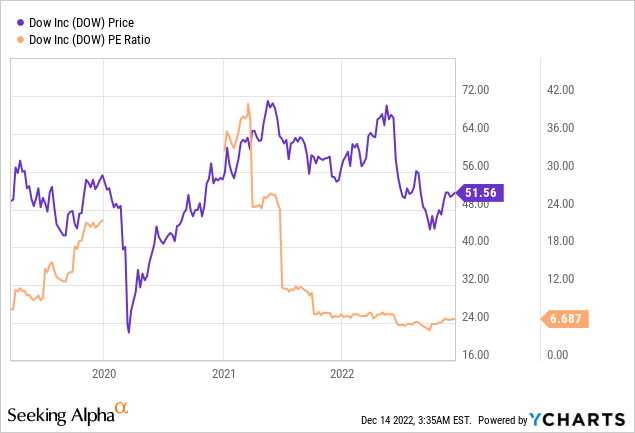
Graph 1: Share price and price-to-earnings ratio of Dow since their split from Dupont.
In this graph, we can see that Dow looks like a very cyclical business: The share price of Dow fluctuated quite heavily, even when we keep in mind that most stocks experienced a strong downturn in the beginning of 2020 due to the covid crisis. Dow’s price-to-earnings ratio varied from more than 40 in the beginning of 2021 to less than 7 now, which seems cheap. Note that the graph does not list values for 2020-2021, since the net earnings of Dow were negative in 2019.
Please note that fluctuating earnings and cyclicality alone are no reason to exclude companies when you are a long-term investor. Actually, long-term investors would be best suited to have a part of their portfolio dedicated to cyclical companies, since the focus on the long term eventually filters out the cyclicality. Now let us look at other metrics to get a grasp on the financial health of Dow.
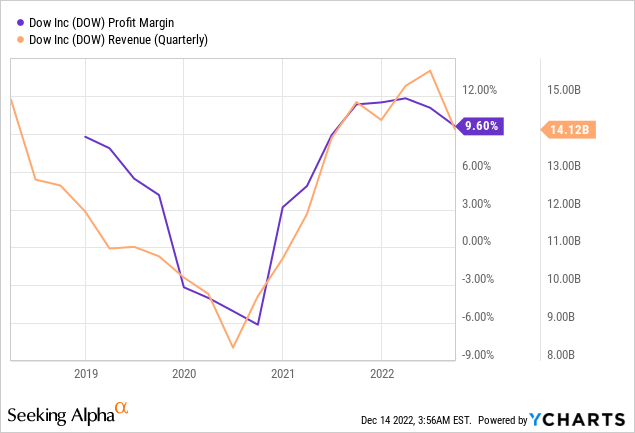
Graph 2: Profit margin and quarterly revenues of Dow since their split from Dupont.
As we can see in Graph 2, Dow’s profit margins and revenues have been fluctuating during the last years. Actually, their revenues are quite high with $14B per quarter when we keep in mind that Dow’s market capitalization is around $36B currently. With a profit margin of almost 10%, that means that currently profits are flowing into the company at a quick rate. But as we saw in the graphs, this has been dramatically different in the past, and in a cyclical industry, this could change quickly.
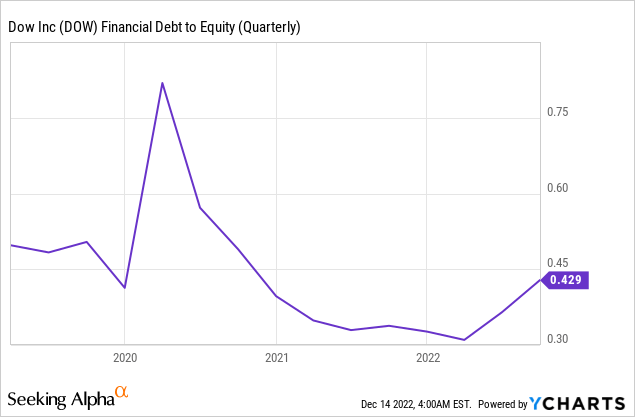
Graph 3: Financial debt-to-equity ratio of Dow since their split from Dupont.
In Graph 3, the financial debt-to-equity ratio of Dow is depicted. Apart from a spike in 2020, which was not due to an extreme increase in debt but rather a sudden decrease in share price, the graph looks quite good. A debt-to-equity ratio of 0.4 is usually not something to be worried about, except maybe when the share price of the company with this ratio is extremely overvalued. And in the previous graphs, we could see that Dow looks anything but overvalued.
Dividend
For long-term investors, dividend is one of the most interesting points of attention when analyzing a company, since dividends can amount to a substantial part of an investor’s returns over the long term. Normally, I would insert a graph here to look at the dividend growth of the company over the last couple of years, but for Dow I can be very brief: Since June 2019, the company paid out a dividend of $0.70 per quarter, with no dividend growth.
This quarterly $0.70 does mean that the dividend yield of Dow is more than 5%, which is quite good compared to many other companies in the Dow Jones (DJI) or S&P 500 (SP500). But the company does not seem to be dedicated to growing its dividend each year, which I find a disadvantage because I focus on long-term holdings with dividend growth.
Of course, Dow might raise their dividend during the coming years, even by a substantial amount, but the fact that they kept their dividend payout flat since 2019 signals to me that investors cannot count on this.
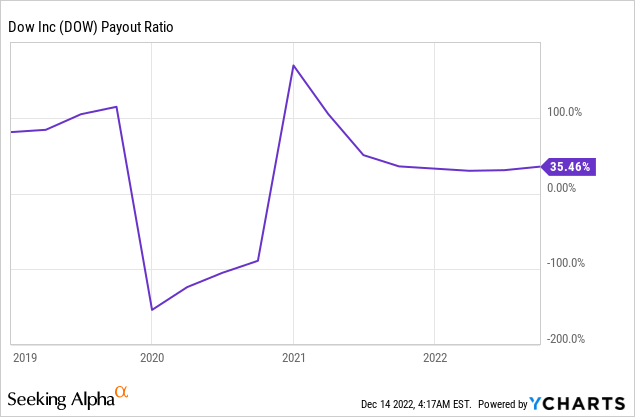
Graph 4: Dividend payout ratio of Dow since their split from Dupont.
A metric which does provide us some interesting information is the dividend payout ratio of Dow, which you can see in graph 4. Here we can see that while the payout ratio is relatively low nowadays with 35%, it has been much higher during the last couple of years and even negative when the company posted negative earnings. This tells me that Dow will likely be careful with potential dividend increases during the coming years, even if earnings continue to be high.
Comparison with peers
Since I’m mostly a long-term investor myself and most of my holdings are very stable dividend-growing investments, it is not fair to compare the company of Dow to the largest part of my portfolio. The best comparison for Dow is to their peers. For this, I selected the companies of Dupont de Nemours, from which Dow split in 2019, Chemours (CC), which was also created as a spinoff of Dupont, and the German company BASF SE (OTCQX:BASFY). Note that for all these graphs, the Dupont data is heavily influenced by the spinoff of Dow on the 1st of April 2019.
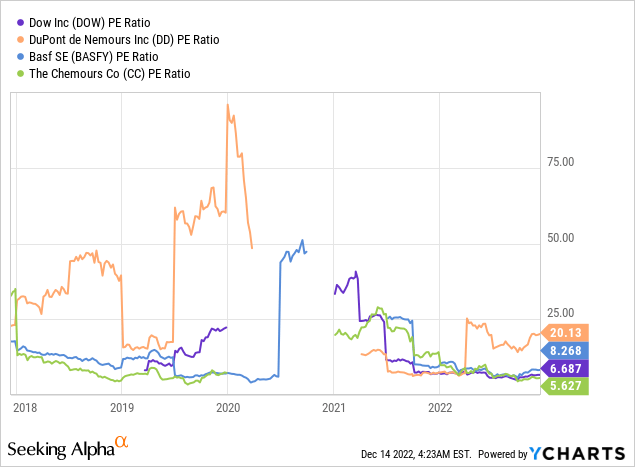
Graph 5: P/E ratio of Dow and some of its peers during the last 5 years.
In Graph 5, we can see the price-to-earnings ratios of Dow in comparison with the peers I mentioned. First of all an interesting conclusion: Dow is likely not even the most cyclical company out of this group, since both Dupont and BASF recorded more extreme P/E fluctuations during the last 5 years. Overall, Dow looks to be one of the cheapest companies in this list, with only Chemours recording a lower current P/E ratio.
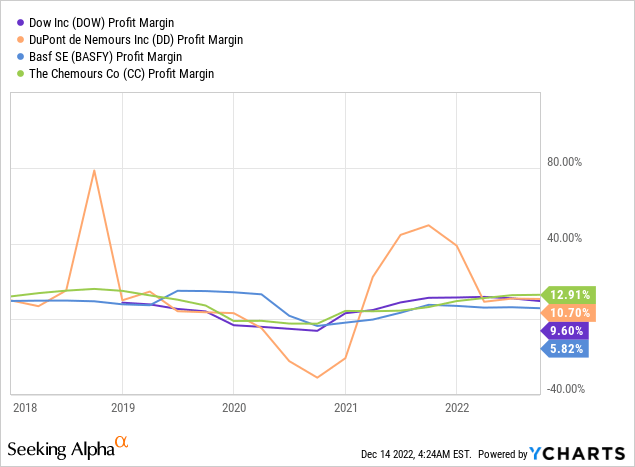
Graph 6: Profit margins of Dow and some of its peers during the last 5 years.
While I previously concluded that the profit margin of Dow was quite volatile when only looking at Dow’s data, we can see that the data of Dupont is even more extreme. The other companies more or less follow the same pattern as Dow’s profit margin, which has likely been heavily influenced by economic conditions. Worth noting is that the profit margin of BASF is quite low at the moment: below 6% while the others are around 10%.
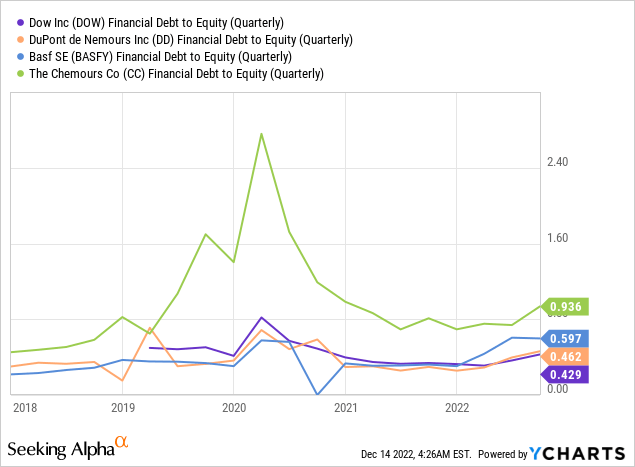
Graph 7: Financial debt-to-equity ratio of Dow and some of its peers during the last 5 years.
With regard to the debt-to-equity ratio, Chemours is the outlier. They seem to have taken on relatively much debt, although we also saw in the graph where we listed the P/E ratio that they stock was relatively cheap (so if their share price increased to match the P/E ratio of their peers, their debt-to-equity ratio would also contract). In graph 5 we saw that Dupont has by far the highest current P/E ratio, which if it would decrease to lower levels would indirectly lead to a large increase in their debt-to-equity ratio. Since this article is about Dow, I won’t delve deeper into this, but this could be a serious risk for investors in Dupont, which seems to have taken on relatively more debt than Dow and BASF.
Conclusion
Dow is an interesting investment for people who want to gain exposure to materials science. Their financial metrics look good and their stock looks very cheap with a P/E ratio of less than 7 and a dividend yield of more than 5%.
Still, investors should keep in mind that Dow operates in a very cyclical sector. If the economy would contract, Dow’s revenues and profits are likely to take a big hit. With the current economic developments, now could prove to be a very bad time to purchase shares of Dow. Furthermore, Dow has not increased its dividend since 2019, and their payout ratio looks very volatile. Therefore I am not convinced at all that they will grow their dividend during the coming years.
In comparison with some of their peers, Dow looks better suited than Dupont and Chemours on the debt front, though Chemours’ stock is even cheaper on a P/E basis than Dow’s. When compared with BASF, the largest difference is that the profit margin of Dow is much higher than the one of BASF. This could mean that Dow is a more efficient company, but it could also mean that BASF has a much larger scope of improvement than Dow on the profit front.
Even though both Dow and BASF look like viable investments, since I often err on the safe side, I would sit out a potential economic downturn before I would gain exposure to any of the companies I mentioned in this article.
Be the first to comment