

Dow, Nasdaq 100, S&P 500, FOMC, AUDUSD and EURUSD Talking Points:
- The Market Perspective: USDJPY Bearish Below 146; EURUSD Bullish Above 1.0000; Gold Bearish Below 1,680
- October has come to a close and the Dow Jones Industrial Average may represent the broader market’s winner for the month with a nearly 14 percent rally – the best charge since January 1976
- As we move into November trade, seasonal expectations are deeply engrained but the most prominent distortion may be the anticipation for Wednesday’s FOMC decision
Recommended by John Kicklighter
How are DFX Analysts Favorite 3Q Markets Performing?
The Biggest Dow Rally in Nearly 50 Years and a Distinct Contrast to Tech
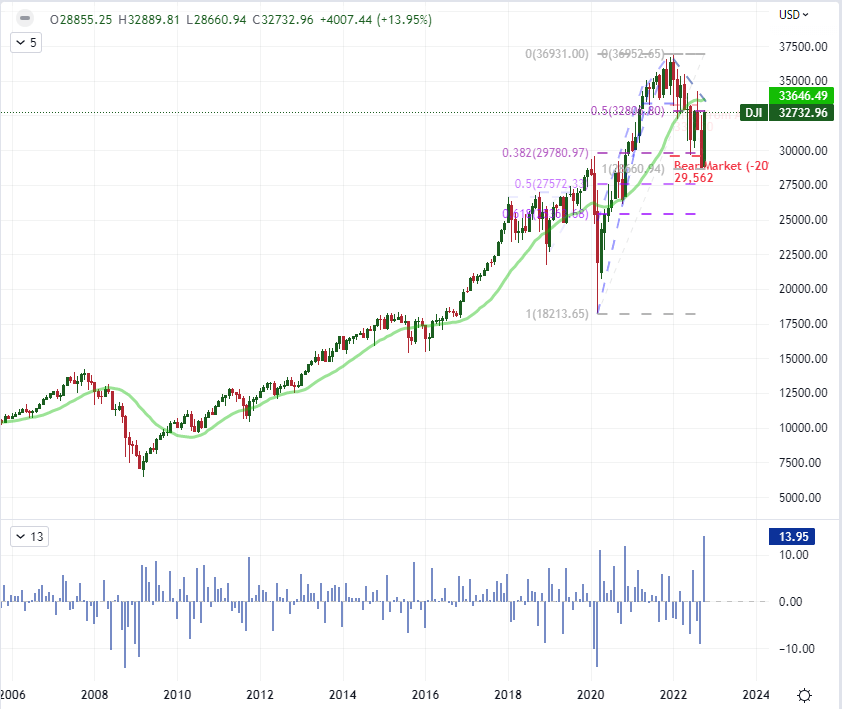
The month of October has been called to a close and we are entering November trade. The seasonal expectations on the longer horizon (monthly) suggest the course ahead is more staid with a bias that favors the bulls – though conditions in 2022 seriously upset that norm. Through the shorter term, the anticipation of this week’s top even – the FOMC rate decision – will likely curb the momentum that feeds into systemic trend development and instead relegate volatility to a short-lived burst of activity and little more until the central bank has its say. In the meantime, there is a serious wind to certain speculative benchmarks’ backs. While the US indices as a group performed well, the Dow Jones Industrial Average has managed to outstrip its major counterparts to a serious degree. Through November, the Dow booked a near-14 percent rally. That is a markedly stronger performance relative to the S&P 500’s 8 percent charge and the Nasdaq 100’s mere 4 percent gain. In fact, the DJIA’s exceptionally rally represents the biggest charge over the monthly time frame since January of 1976. Is that ‘value’ building a foundation for bulls or the epitome of a ‘bear market bounce’?
Chart of Dow Jones Industrial Average with 20-Month Moving Average and 1-Month ROC (Monthly)
Chart Created on Tradingview Platform
There is a very nascent feel to the charge in US indices this past month, whether we are referencing the Nasdaq’s crawl or the Dow’s surge. Trend changes begin somewhere, but there is very limited fundamental backdrop at the moment to support enthusiasm short of an assumption that ‘the worst is behind’ – which I believe there is very little tangible evidence to support. Meanwhile, other venues of sentiment extended their respective slide from emerging markets to high yield fixed income assets. I still consider Nasdaq 100 to Dow ratio a remarkable sign of erosion in underlying speculative confidence. This ‘growth’ to ‘value’ comparison experienced an -8.6 percent slide through October which (next to April’s slightly steeper drop) was the biggest plunge since September 2008 – the height of the Great Financial Crisis. While some may chalk this up to the slide in prominence for a previous favorite in ‘tech’, I consider it the receding tide of interest in ‘the market’ which was led by the largest market capitalized tickers which centered on the FAANGs, the Nasdaq darlings.
Chart of Nasdaq 100 to Dow Average Ratio with 20 and 200-Day SMA and Gaps (Daily)
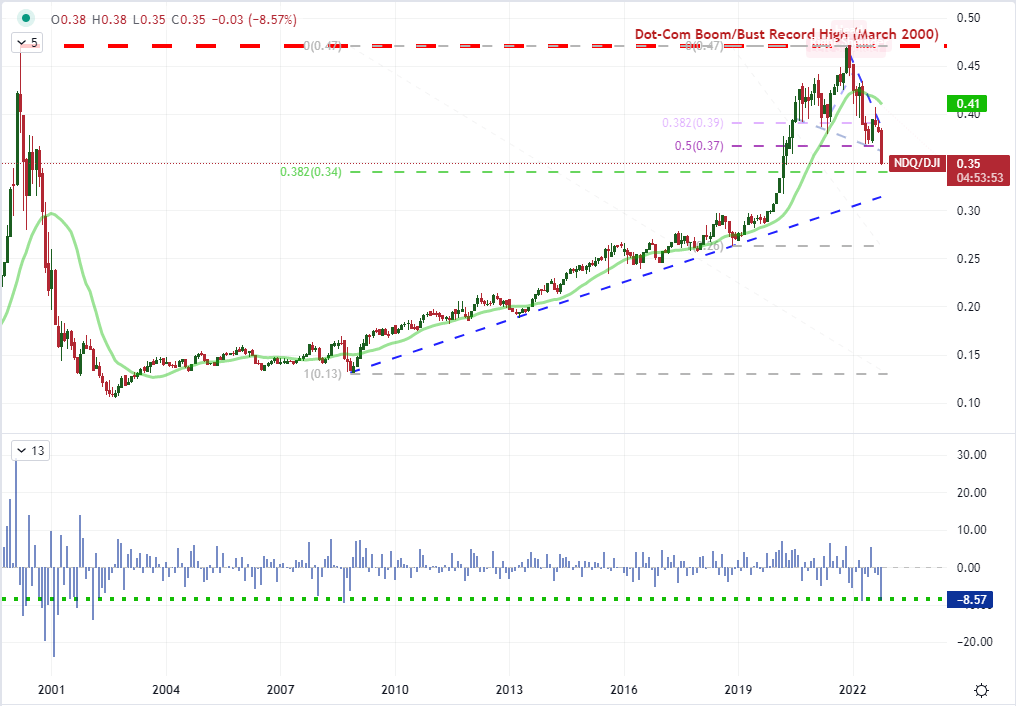
Chart Created on Tradingview Platform
Seasonality for the Long-Term and the Short-Term
As we move into the penultimate month of the year, the historical averages make for a significant impression. Historically, the month of November has averaged the second best rate of return for the benchmark S&P 500 of the calendar year – though that is very much a disperse set of returns dependent on the particular year’s fundamental considerations. More consistent is the trend in both volume and volatility for the index which sees a serious drop on both from the peak established in October. A ‘bear market rally’ is not an unprecedented sight in the kind of conditions we have witnessed, but how much further is the climb we have witnessed thus far likely to reach? For the Dow, the past three weeks saw a recovery of 50 percent of the total slide in 2022. With practical concerns of persistent inflation, a rate hike overcorrection and general recession; a true reversal in favor of the bulls seems a dubious notion.
Chart of Seasonal Performance of S&P 500, Volume and VIX Volatility
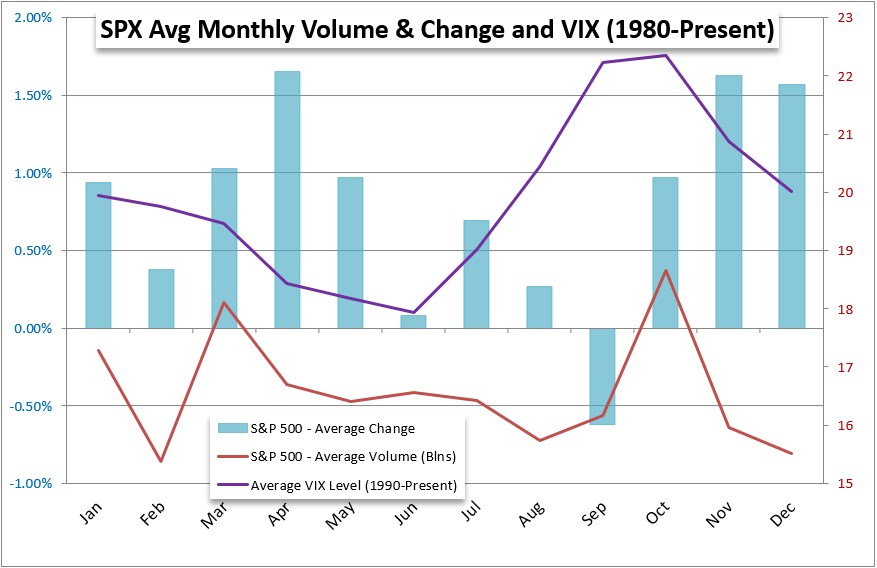
Chart Created by John Kicklighter
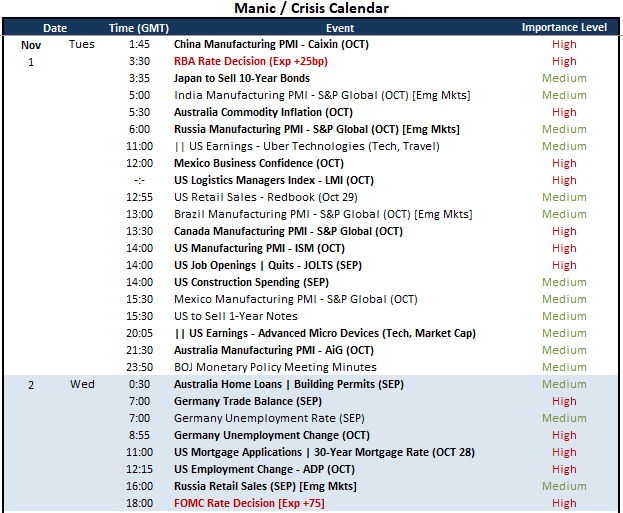
Over the next 48 hours, my expectation for market development are very heavily influenced by anticipation for Wednesday’s prominent FOMC event. The US central bank’s decision as to whether it should hike rates 75 basis point for a fourth consecutive meeting or not hangs heavy in the air. Whether or not they keep that temp going for another meeting will likely result in a degree of surprise for some segment of the market. That translates into probable volatility. Yet, such capacity to rouse the market is likely to also translate into a curb on market development until the big headline is cleared. Between now and that Fed decision, there are some important listings; but ‘important’ doesn’t always translate into ‘market moving’. For the US docket itself, the run of the ISM’s manufacturing report, Jolts job openings and a run of earnings is meaningful but perpetually underwhelming.
Critical Macro Event Risk on Global Economic Calendar for Next 48 Hours
Calendar Created by John Kicklighter
AUDUSD and EURUSD: Two Pairs to Watch Moving Forward
For general fundamental themes, I can’t say that the AUDUSD is one of the most indicative pairs. Relative growth considerations are skewed by the size difference while the safe haven capacity of the US Dollar draws serious questions. That said, the relative yield forecast has shifted significantly in favor of the Greenback. In fact, the ‘medium-term’ (2-year) yield differential between the countries’ sovereign debt and the exchange rate holds a very strong 60-day (3-month) correlation coefficient. That makes Tuesday’s morning’s RBA rate decision that much more interest. Where the yield differential has tumbled to fresh multi-year lows through Monday, AUDUSD is still sporting a relative premium to October’s lows. Will a ‘mere’ 25 bp rate hike from the Australian authority fuel a further retreat? What would a hold or 50bp hike do?
Recommended by John Kicklighter
How to Trade AUD/USD
Chart of AUDUSD Overlaid with AU-US 2-Year Yield Spread, 20 and 60-Day Correlation (Daily)
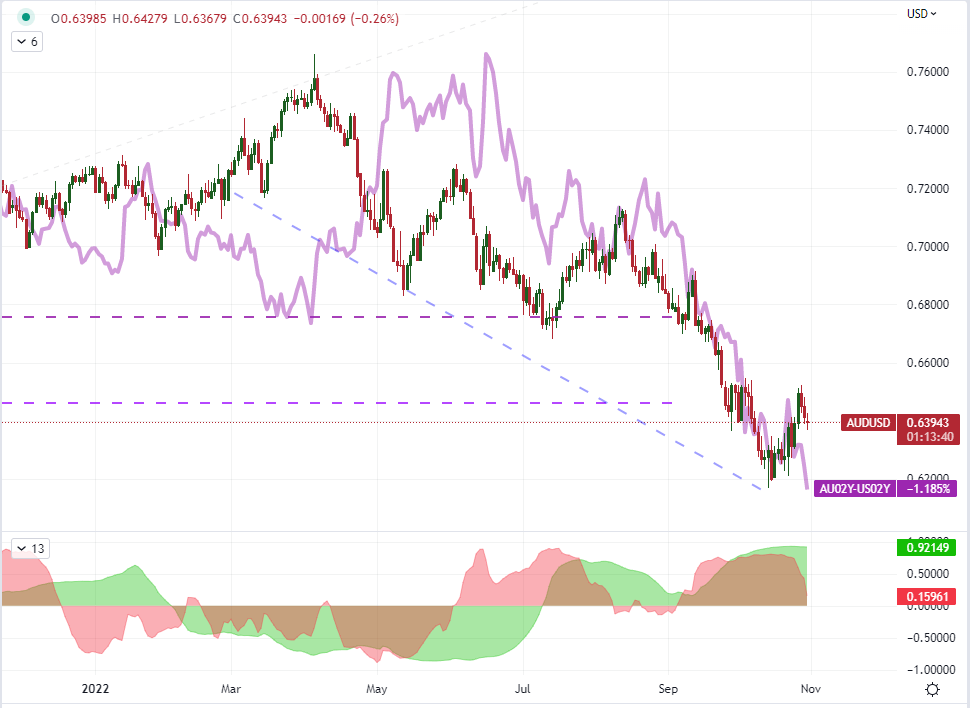
Chart Created on Tradingview Platform
In contrast to the relatively thin AUDUSD, the world’s most liquid currency pair, EURUSD, extended its drop back below parity. There was a stretch of European data to start this week that helped push the benchmark cross below the 0.9900 market, which significantly deflates the premium behind the Euro heading into Wednesday’s FOMC decision. The retreat was helped in large part by the run of data through Monday. While the Chinese government’s PMIs for October slipping below 50 was perhaps the most surprising, the Eurozone’s ‘in-line’ 0.2 percent 3Q GDP reading was very unflattering. Even more problematic was the region’s record 10.7 percent annual headline inflation rate. A record swell in price growth, a probable recession ahead and the perception that the central bank is behind and uncertain of its path: that is not a sound backdrop for the world’s second most liquid currency.
Recommended by John Kicklighter
Get Your Free EUR Forecast
Chart of EURUSD Overlaid with Eurozone-US 2-Year Yield Spread (Daily)
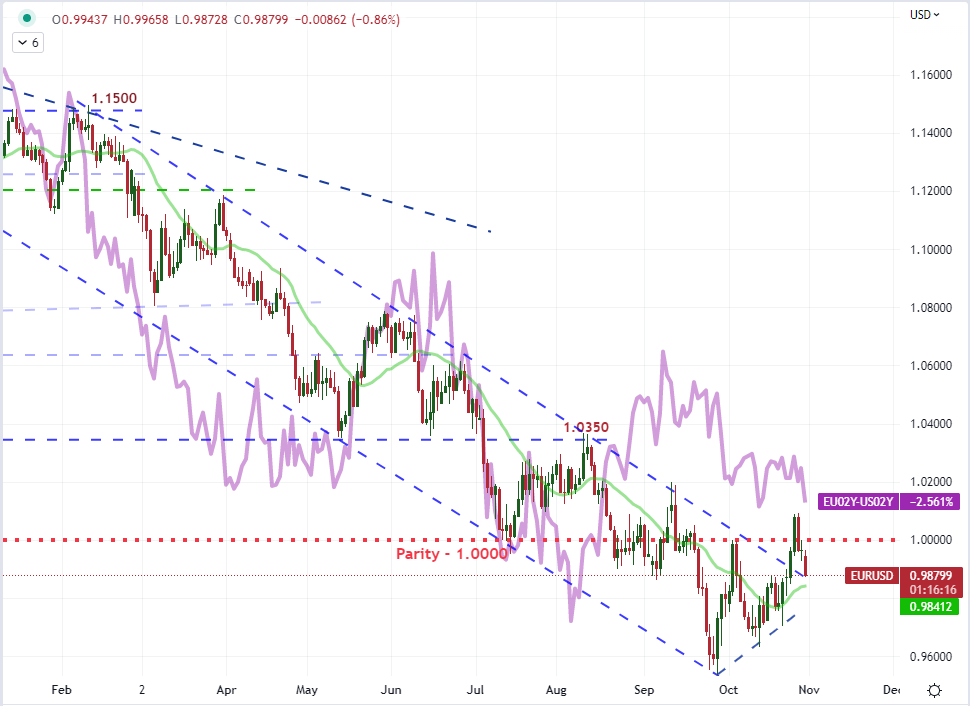
Chart Created on Tradingview Platform
Trade Smarter – Sign up for the DailyFX Newsletter
Receive timely and compelling market commentary from the DailyFX team
Subscribe to Newsletter
Be the first to comment