

choness/iStock via Getty Images
Douglas Emmett, Inc. (NYSE:DEI) is a real estate investment trust (“REIT”) that is the largest office landlord in Los Angeles and Honolulu. In addition to high-quality office properties, they also own a sizeable portfolio of premier multifamily communities in the same two operating markets, catering to affluent tenants in inherently supply-constrained submarkets.
The company’s credibility has been built up over its 50-year history of operating in Los Angeles County. Soon after their IPO in 2006, DEI was tested during the Great Financial Crisis of 2007-2008. But they bounced back and enjoyed a decade of consistent growth.
YCharts – Historical Price Chart Of DEI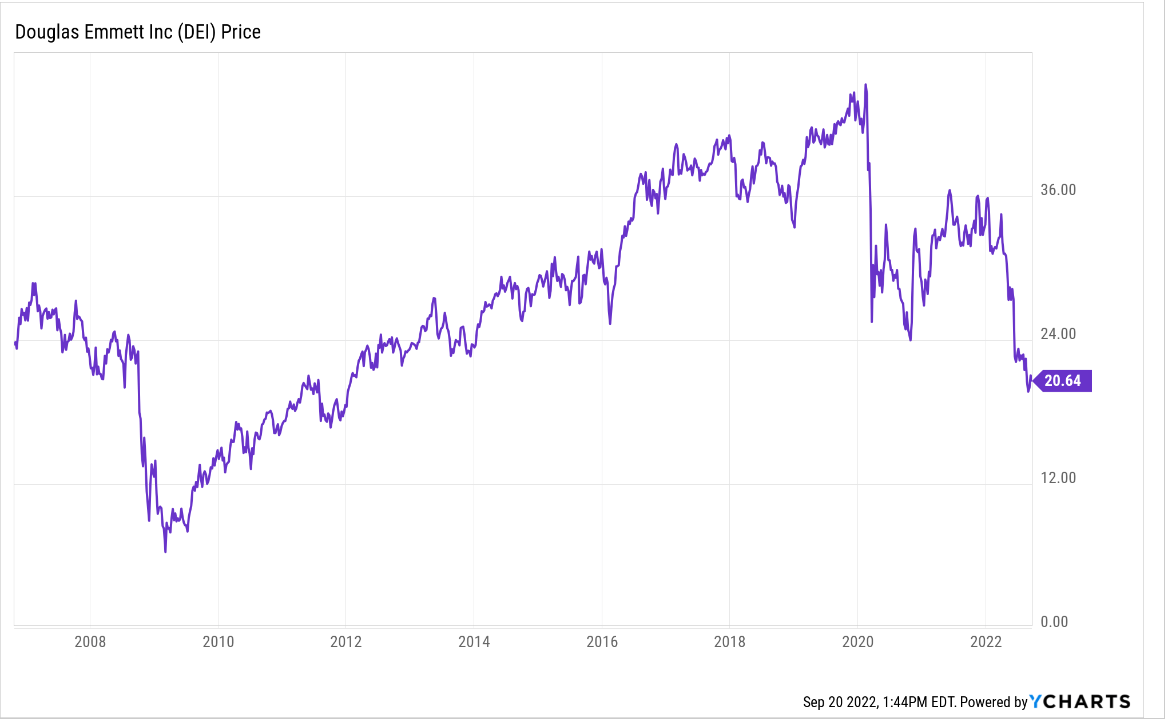
Prior to 2020, DEI generally tracked the S&P 500 index. Since the onset of the pandemic, however, shares have suffered significant investor flight, along with their peers in the office sector. But unlike other pure-play office REITs, DEI obtains about 20% of their revenues from their multifamily units. While not overly significant, it still serves as an adequate buffer against the losses suffered on their office holdings.
YCharts – 5-YR Total Returns Of DEI Compared To S&P 500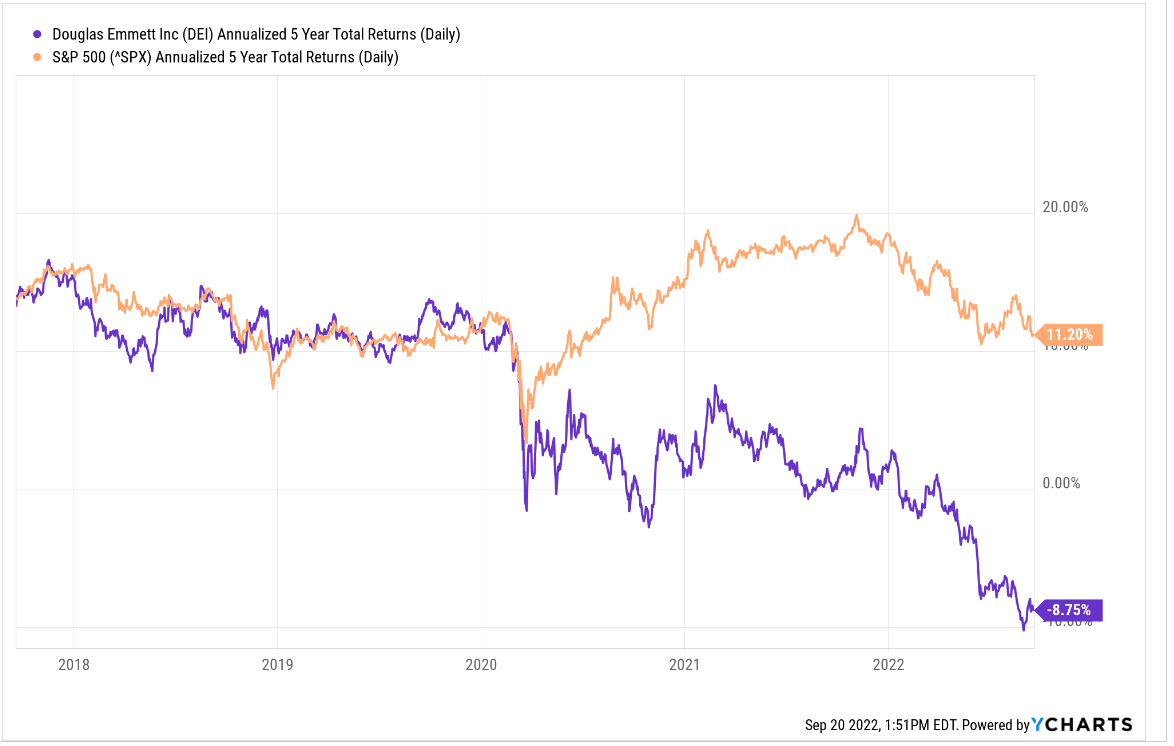
Shares, nevertheless, are still down 35% over the past year and over 40% YTD. Valuations are also significantly depressed, with a forward pricing multiple of just 10x funds from operations (“FFO”) and an implied cap rate of 7%. This is compared to the 4.5% rate the company fetched at the end of 2019. For investors seeking a stock with a favorable risk/reward proposition, DEI may be one worth further consideration.
Largest Office Landlord In Los Angeles and Honolulu
DEI’s total portfolio includes 71 Class A office properties that account for over 80% of total annual rents, in addition to 13 multifamily units. These properties are geographically concentrated in just two primary locations, Los Angeles County, California and Honolulu, Hawaii, both of which are high-barriers-to-entry markets, with restrictive zoning laws and a poor outlook for future supply growth. This limits DEI’s competitive threats and enables them to maintain significant market share in their submarkets, which is running at about 38% in their office portfolio.
June 2022 Investor Presentation – Snapshot Of Current Supply Trends In Los Angeles Vs Other Markets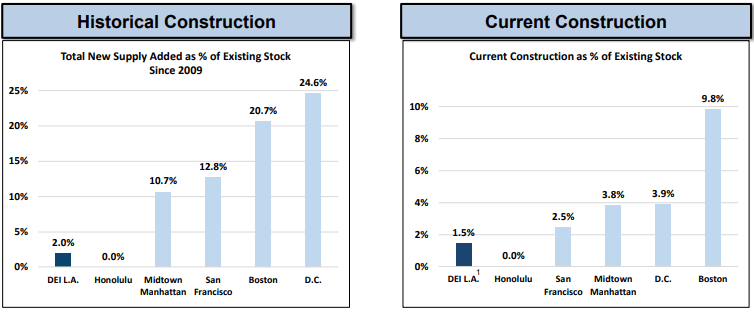
Market leadership in Los Angeles and Honolulu provides several notable benefits to the company. For one, Los Angeles County’s GDP of approximately $1 trillion is among the top three cities in the world and over +$650B larger than that of 43 different U.S. states and Washington, D.C.
In addition, the region has the world’s largest higher education concentration that produces more higher-level degree graduates than any county in America, many of which go on to work in the Silicon Valley tech sector, which has a workforce of over 350k people. While most of these jobs transitioned to a remote setting over the past two years, which has created a secular risk for the office sector, there are indications that many of these jobs will return to the area in some form of hybrid arrangement.
Already, some companies, such as Google (GOOG), Apple (AAPL), and Microsoft (MSFT) have informed their employees that it’s time to come back, at least part of the time. And recently, it was reported that workers are returning to offices at the highest rate since the pandemic began. These are positive signs that should begin to materialize in the company’s leasing and occupancy statistics in later periods.
Smaller Space Minimizes Tenant’s Cost Of Rent Considerations
Another characteristic of their portfolio that helps retain their market leadership is their focus on the leasing of smaller space to a diverse tenant industry mix. Over 95% of their office leases, for example, are under 20k square feet (“SF”), with a median tenant size of just 2,500 SF.
Q2FY22 Investor Supplement – Summary Of Leases By Square Footage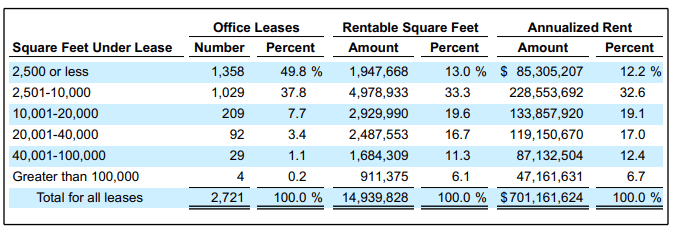
The smaller size results in rent being a small portion of the tenant’s revenue. As such, the cost of rent is not the most significant factor in the tenant’s leasing decision. Instead, the decision to lease is often based on the proximity of the office to the decision maker’s home. In some industries, proximity is even more important.
Of their top four tenant industries, for instance, the Legal and Real Estate industries represent about 30% of annualized rent. And these are two industries that are inherently more office-oriented due to the nature of their work. For these tenants, they are more likely to pay a premium to be in space that is close to their personal residences, especially in Los Angeles, which is notable for their highly stressful commute times. For DEI, this ultimately results in greater portfolio stickiness and higher rent growth over the long run.
Q2FY22 Investor Supplement – Partial Summary Of Top Tenant Industries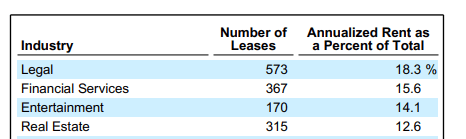
Choppy Office Rent Rolls But Positive Long-Term Potential
Due to the downturn in the office market, rent growth has stalled and is negative on a cash basis, with rent rolls at negative 7% at the end of Q2. Part of this is due to the company’s focus on recovering funds from non-paying tenants following the expiration of commercial eviction moratoriums in their markets. But it also is reflective of the challenges being faced by the industry.
Q2FY22 Investor Supplement – Current Rent Spreads For Office Portfolio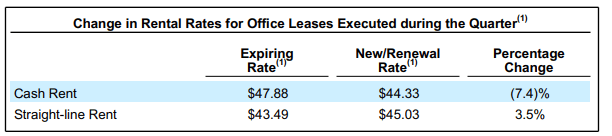
Offsetting this weakness was strength in their multifamily segment, which exhibited spreads of 7.5%. Moving forward, moderation in multifamily rate growth is expected, but the rolls should remain in positive territory.
While office spreads are projected to remain choppy, DEI will have some added protection through their embedded contractual escalators, which are provisioned for annual increases of 3-5%.
In addition, the company has consistent lease expirations from year to year, which limits their exposure in any single year. Moreover, DEI has over 1M SF expiring through the remainder of the year, with average expiring rent that is less than their current cash rates. This should provide an attractive mark-up opportunity at renewal.
Q2FY22 Investor Supplement – Lease Expiration Schedule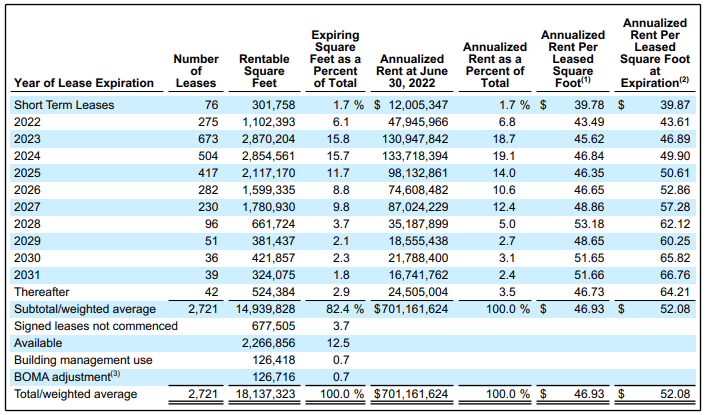
Embedded Upside In Current Occupancy Levels
Also in the quarter, DEI leased over 1M SF of office space, including 350k SF of new deals. On average, these leases were signed for 5-YR terms. For the new deals, terms were for six years, which provides a nod of confidence to office longevity. If offices were truly at secular risk, tenants would not be committing themselves to these long-term arrangements.
Granted, occupancy rates are still down significantly from 2019 levels, with current leased rates that are still 580 basis points (“bps”) below the pre-pandemic benchmark. In addition, despite strong leasing activity during the quarter, their net absorption metric was slightly negative due to their efforts in replacing non-paying tenants upon the lifting of eviction moratoriums.
While these efforts negatively impacted occupancy metrics, they will soon have a positive impact on their financial results since the company has not been recognizing revenue from the tenants in previous periods. As they collect outstanding amounts owed, it should begin to hit their topline figures in the latter half of the year. The eventual backfilling of the vacant space will also improve absorption metrics.
Visibility into future earnings growth is also evident in their physical occupancy rate, which lags their leased rate by 370bps. Nearly half of this backlog is scheduled to move in during Q3, which should provide an immediate boost to cash flows. Steadily increasing office utilization levels, now at over 80% of pre-pandemic levels, also provide clarity on the sector’s direction moving forward.
Still, despite some positive trends, management narrowed their full-year guidance for FFO to a range of $2.03 to $2.07 per share. This is an upward/downward change of a penny at both the low end and upper end of their guidance from Q1.
The Risk/Reward Proposition Clearly Favors A Share Price Rebound
All considered, the outlook for DEI is positive. Though they are geographically concentrated to just two major markets, which increases their risk premium, they have an established operating history with a leading market share in the critical region of Los Angeles County, one of the largest markets in the world.
Disruptions in the office market have weighed on the stock over the past two years. Steadily increasing utilization levels, however, and strong leasing activity that is resulting in widening spreads between physical and leased occupancy levels provide visibility into future earnings growth. With overall occupancy still greatly lagging pre-pandemic levels, there is ample opportunity for internal growth.
While higher interest rates and the possibility of recession are two considerations, the company has a flexible balance sheet with +$271M of cash on hand, in addition to full availability on their revolving credit facility. This provides a solid base to weather any resulting setbacks in the macroeconomic environment. In fact, heightened fears of a recession may even increase employer leverage in bringing employees back to an office setting.
Limited near-term debt maturities further enable DEI to redirect funds to other priorities, such as the quarterly dividend payout, which is currently yielding nearly 5.5% and is well covered, with an adjusted FFO payout ratio of just over 60%.
At the end of 2020, DEI traded at a 16x multiple of FFO and an implied cap rate of 4.8%. But today, even with markedly better operating conditions, DEI trades at just over 10x forward FFO and an implied cap rate of 7%. This is a significant mispricing of the shares. And recent insider activity may provide additional support to this viewpoint.
Benzinga – Recent Insider Activity For DEI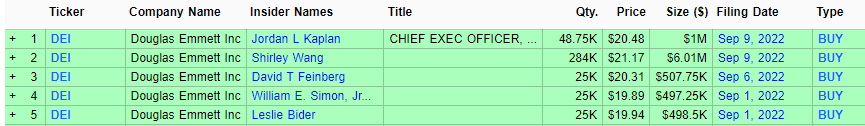
Even at a 13x multiple, shares would be worth over 25% more than their current trading levels. For investors seeking a new addition to their long-term portfolios, the risk/reward proposition for DEI is clearly favorable for further consideration.
Be the first to comment