

Oil Price Talking Points
The price of oil bounces back from the session low ($65.25) following a larger-than-expected decline in US inventories, but the double-top formation established earlier this month remains largely intact as the rebound from the May low ($61.56) fails to spur a test of the March high ($67.98).
Oil Price Forecast: Double Top Formation Intact Ahead of OPEC Meeting
Fresh data prints coming out of the US seems to be shoring up the price of oil as crude stockpiles narrow 1.662M in the week ending May 21 versus projections for a 1.05M decline.
Signs of a stronger consumption may keep the Organization of the Petroleum Exporting Countries (OPEC)on track to gradually restore production over the coming months as the “ recovery is expected to pick up speed in the second half of the year,” and the group may stick to the production adjustment table over the coming months as US production remains at its lowest level since 2018.
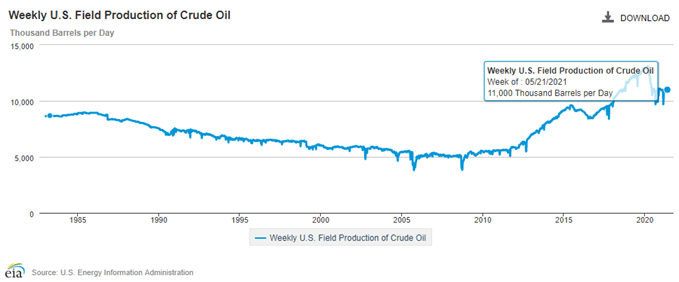
A deeper look at the fresh figures from the Energy Information Administration (EIA) showed weekly field output holding steady at 11,000K for the third consecutive week, and the data may encourage OPEC and its allies to uphold the current production schedule at the next Joint Ministerial Monitoring Committee (JMMC) meeting on June 1 as the most recent Monthly Oil Market Report (MOMR) forecasts world oil demand in 2021 to “increase by 6.0 mb/d, unchanged from last month’s estimate, to average 96.5 mb/d.”
With that said, the price of oil may consolidate ahead of the JMMC meeting with OPEC and its allies on track to gradually restore production, but the double-top formation established earlier this month remainsintact as the rebound from the May low ($61.56) unravels ahead of the March high ($67.98).
Oil Price Daily Chart
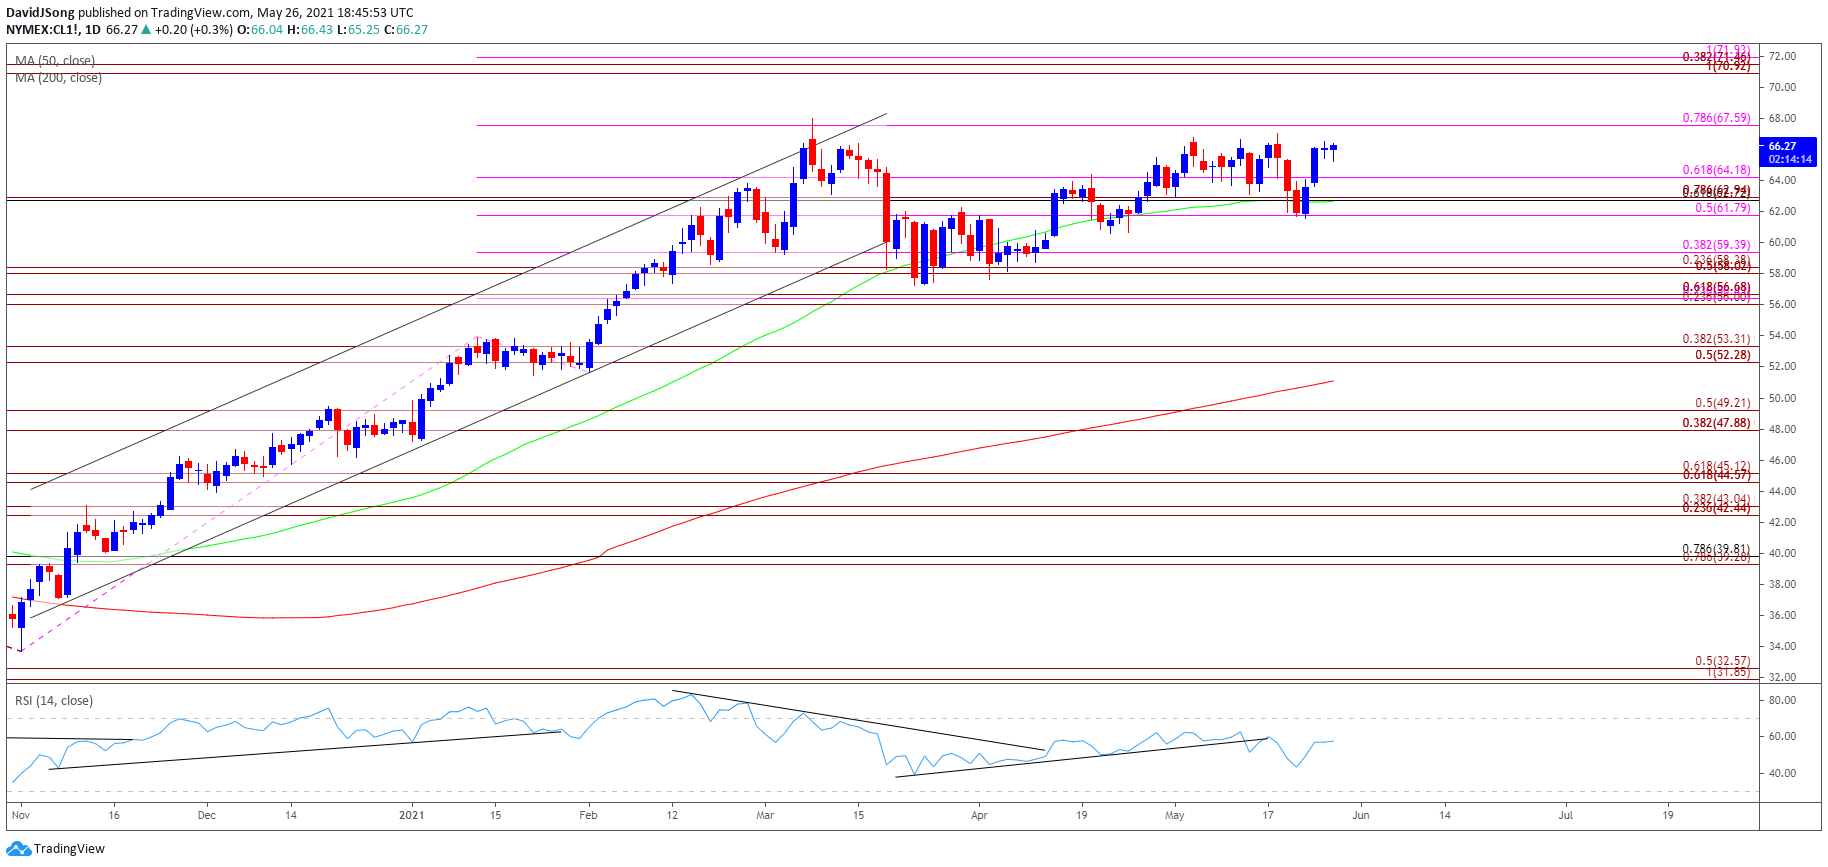
Source: Trading View
- Keep in mind, crude broke out of the range bound price action from the third quarter of 2020 as it established an upward trending channel, with the price of oil taking out the 2019 high ($66.60) as both the 50-Day SMA ($62.67) and 200-Day SMA ($51.10)established a positive slope.
- It remains to be seen if the decline from the March high ($67.98) will turn out to be a correction in the broader trend or a change in market behavior as the price of oil fails to retain the upward trending channel from late last year, but recent developments in the Relative Strength Index (RSI) warn of a larger decline in crude prices as the indicator snaps the upward trend from earlier this year.
- The price of oil has snapped the opening range for May following the failed attempt to test the $67.60 (78.6% expansion) zone, with a double top formation taking shape amid the lack of momentum to test the March high ($67.98).
- Failure to retain the series of higher highs and lows from earlier this week may pull the price of oil back towards the $64.20 (61.8% expansion) region, with a break/close below the $62.70 (61.8% retracement) to $62.90 (78.6% expansion) zone bringing the $$61.80 (50% expansion) area on the radar.
- Next region of interest comes in around $59.40 (38.2% expansion) followed by the Fibonacci overlap around $58.00 (50% expansion) to $58.40 (23.6% expansion).
— Written by David Song, Currency Strategist
Follow me on Twitter at @DavidJSong
Be the first to comment