

ipopba
Shift Change
Our previous newsletter garnered the most awareness of our 60+ editions since 2008. It wasn’t because it was necessarily contrarian or sensationalistic. More so because, we believe, it did a good job putting the current generational market opportunity into context. That newsletter can be found here. We will refer to some of the same concepts below, but the main takeaway is that we are now 3 months removed from our last update and the theory of declining inflation, max pessimism and generational low valuations appears to be playing out correctly.
A lot of damage was done in the financial markets in 2022. There was definitely froth and excess in pockets of the market which was created by easy money and low interest rates. As those bubbles burst, the reverberations were felt across the market as a whole. Some examples where we saw this were complete sell-offs across entire sectors, independent of the individual value of each asset. We call this indiscriminate selling. This combination of indiscriminate selling paired with operational resiliency is how and why this opportunity has arisen. The current disconnect between company value and stock market valuation is the largest we have ever seen.
Our mistakes in 2022 were largely macro economic. Interest rates went higher and at a much faster pace than anticipated. This lowered stock multiples across the board, even of already attractively priced companies. Poor stock price performance was not indicative of the actual performance of the underlying business. As stated in our last newsletter, this is where the frustration stems from because all of our top investments are on pace to have record years!1 Both record revenues and record profits.2 . Updating this statement with year- to-date earnings reports, management meetings, and industry growth metrics, we affirm this outlook plus forecast record revenues and record earnings in 2023 as well. The intrinsic value of these businesses has continued to increase.
There are a lot of similarities between the start of 2023 and 2009. This market has the same feeling as the beginning of 2009 from a sentiment perspective. At that time the media and the majority of investors were still extremely bearish, but momentum was beginning to turn, and quality businesses were still performing well but trading on extremely cheap multiples. As stock pickers, we can find investments that will still grow earnings in this environment and now historically speaking are at historical low multiples. To reinforce this view, we’ll reference the most important macro economic points, hit on the valuation disconnect again and provide an example of the type of opportunities available in a market like this.
Economic Outlook
As a firm we spend most of our time researching companies. We don’t try and time the market and pick tops and bottoms. There are however important stats that stick out from time to time. We’ll stress a few below because they seem to be the most important, and in our opinion trump most other data points right now.
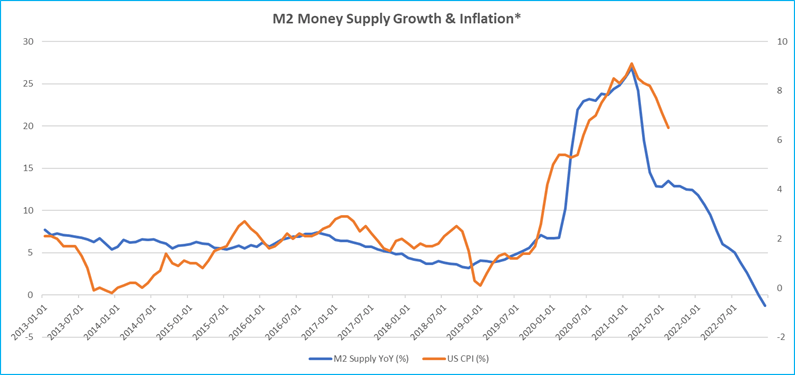
First is inflation and its relation to money supply. The combination of Covid shutdowns impacting supply chains and a once in a lifetime influx of money, is the definition of too much money chasing too few goods. The supply disruption side of inflation has been well covered. Inputs like the cost of shipping, the cost of computer chips, the price of steel, and the price of lumber have all corrected back to pre-covid levels after historic spikes. Money growth saw unprecedented growth during Covid but that has now started to reverse, and the last reported growth metric was negative, for the first time in history. Money supply growth has already corrected, and we believe the lagging CPI numbers will follow suit much faster than what is anticipated.
A quick comment on the threat of increasing wages and their impact on inflation. IMF economists analyzed 22 scenarios in the past five decades where inflation and wages rose, and the unemployment rate held low. They found none of the cases resulted in wage-price spirals.4
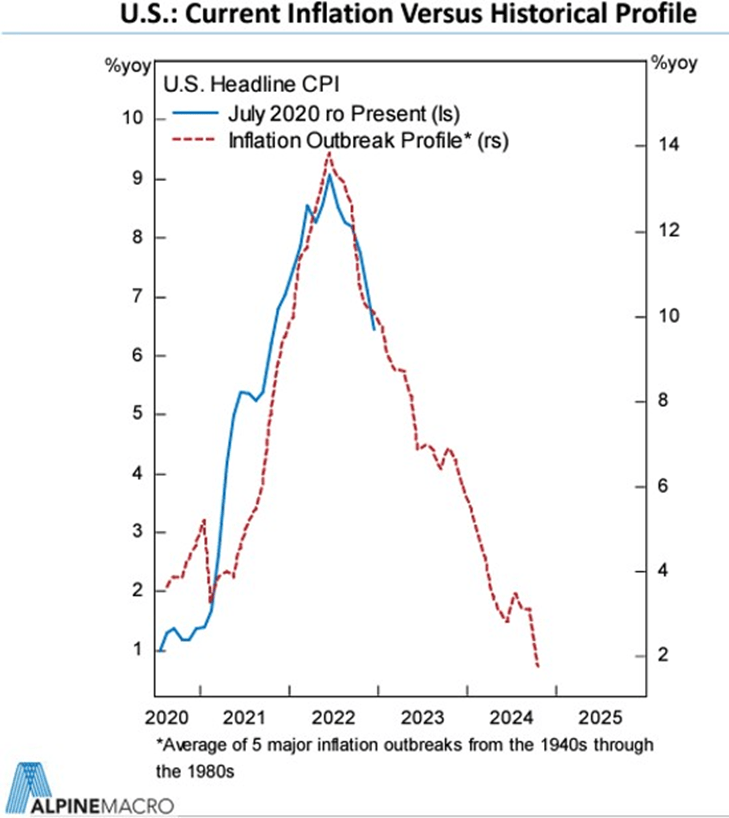
One final macro chart is from Alpine Macro.5 They combined the past 5 inflation outbreaks since the 1940s into an average (red line). They then add this current inflation outbreak to the chart and the profiles speak for themselves.
There are endless economic data points to track. Some more important than others. The fact that consumers have a considerable amount of cash in their bank accounts, they have jobs (supported by low unemployment rate), and finally, that we suspect inflation peaked and will fall much faster than anticipated. These are the overarching economic signals to follow.
Valuations/Opportunity
As referenced in the previous newsletter and included below, we see this cycle’s valuations as even more attractive than 2008/2009. Combine this with interest rates peaking and the historical extremes in small cap valuations won’t last much longer.
2008/2009 Financial Crisis Case Study
|
Company |
2008/2009 Low Market Cap (M) |
2009 Cash PE |
2009 Revenue Growth |
2009 Margins |
Price to Growth 2009 |
Return 1 Year |
Return 2 Years |
Return 5 Years |
|
Average |
$ 598 |
6.0 |
20% |
18% |
6.8 |
76% |
146% |
493% |
Current Example DKAM Company Fundamentals
|
Company |
2022 Low Market Cap (M) |
2023 Cash PE |
2023 Revenue Growth |
2023 Margins |
Price to Growth |
|
Average |
$ 901 |
5.6 |
25% |
21% |
10.5 |
We believe that market found its bottom late in 2022 and has started to improve. Small cap growth stocks are starting to show promise and momentum but are still trading at extremely cheap valuations. At the time of this writing, the fund’s portfolio stocks on average are trading on roughly 8x 2023 cash forecast earnings with 28% revenue growth, 34% projected earnings growth and net cash balance sheets (more cash than debt or no debt at all).6 We have never had such a margin or safety between company fundamentals and valuation.
New Stock Pick
Included at the end of this newsletter is our analysis on the company Reitmans. We have included this analysis because the stock is a new investment in the fund but also because it is a good example to show the type of opportunities in this type of market. The stock is a small cap growth company in Canada that now has impressive unit economics after undergoing a restructuring. It is also very intriguing because many of us have grown up with some type of connection to the Reitmans brands plus it just went through an intriguing turn of events that investors will enjoy reading. Please take a look and let us know your thoughts.
Conclusion
Last year was extremely painful. Our fund bore the brunt of the fastest pace of interest rate hikes in history. Even though all of our top investments are on pace to have record years!1 Both record revenues and record profits.2 Plus we are affirming our forecasts for 2023, and our investments to increase revenue and earnings even further. We have made contrarian calls in the past, like in January 2009 and March 2020. We see this current environment as a great opportunity and would enjoy further discussing its merits with investors.
Feel free to reach out questions or comments,
J.P. Donville & Jesse Gamble
|
All estimates, projections, and calculations have been generated by DKAM. This does not constitute advice for personal investments but rather a breakdown of how Donville Kent approaches stock analysis. 1 – Top investments refers to our 12 largest long positions, which represents over 80% of the fund 2 – Adjusted for fiscal year end 3 – Bloomberg. * US Money Supply Growth advanced 16 months against CPI inflation data 4 – IMF Wage Price Spirals, https://www.imf.org/en/Publications/WP/Issues/2022/11/11/Wage–Price–Spirals–What–is– the–Historical–Evidence–525073 5 – Alpine Macro Webinar – Live Webcast – ‘Markets, Surprises And Strategy For 2023’ January 17th, 2023 6 – DKAM estimates based on projected earnings |
DISCLAIMERReaders are advised that the material herein should be used solely for informational purposes. Donville Kent Asset Management Inc. (DKAM) does not purport to tell or suggest which investment securities members or readers should buy or sell for themselves. Readers should always conduct their own research and due diligence and obtain professional advice before making any investment decision. DKAM will not be liable for any loss or damage caused by a reader’s reliance on information obtained in any of our newsletters, presentations, special reports, email correspondence, or on our website. Our readers are solely responsible for their own investment decisions. The information contained herein does not constitute a representation by the publisher or a solicitation for the purchase or sale of securities. Our opinions and analyses are based on sources believed to be reliable and are written in good faith, but no representation or warranty, expressed or implied, is made as to their accuracy or completeness. All information contained in our newsletters, presentations or on our website should be independently verified with the companies mentioned. The editor and publisher are not responsible for errors or omissions. Past performance does not guarantee future results. Unit value and investment returns will fluctuate and there is no assurance that a fund can maintain a specific net asset value. The fund is available to investors eligible to invest under a prospectus exemption, such as accredited investors. Prospective investors should rely solely on the Fund’s offering documentation, which outlines the risk factors in making a decision to invest. The S&P/TSX Composite Total Return Index, the S&P 500 Total Return Index, and the Russell 2000 Total Return Index (‘the indexes’) are similar to the DKAM Capital Ideas Fund LP (‘the fund’) in that all include publicly traded North American equities of various market capitalizations across several industries, and reflect both movements in the stock prices as well as reinvestment of dividend income. However, there are several differences between the fund and the indexes, as the fund can invest both long and short, can utilize leverage, can take concentrated positions in single equities, and may invest in companies that have smaller market capitalizations than those that are included in the indexes. In addition, the indexes do not include any fees or expenses whereas the fund data presented is net of all fees and expenses. The source of the indexes’ data is Bloomberg. DKAM receives no compensation of any kind from any companies that are mentioned in our newsletters or on our website. Any opinions expressed are subject to change without notice. The DKAM Capital Ideas Fund, employees, writers, and other related parties may hold positions in the securities that are discussed in our newsletters, presentations or on our website. |
Reitmans (RET:CA): Executive Summary
|
Company |
REITMANS (CANADA) LTD-A |
|
Ticker Voting Shares |
RET CN |
|
Ticker Non-Voting |
RET/A CN |
|
Stock Price3 |
$2.99 |
|
Market Cap3 |
$146,112,330 |
|
Enterprise Value |
$79,031,330 |
|
Yield |
0.0% |
|
2023E PE1 |
1.9x |
|
2023E FCF Yield1 |
45% |
|
52 Week High3 |
3.03 |
|
52 Week Low3 |
0.75 |
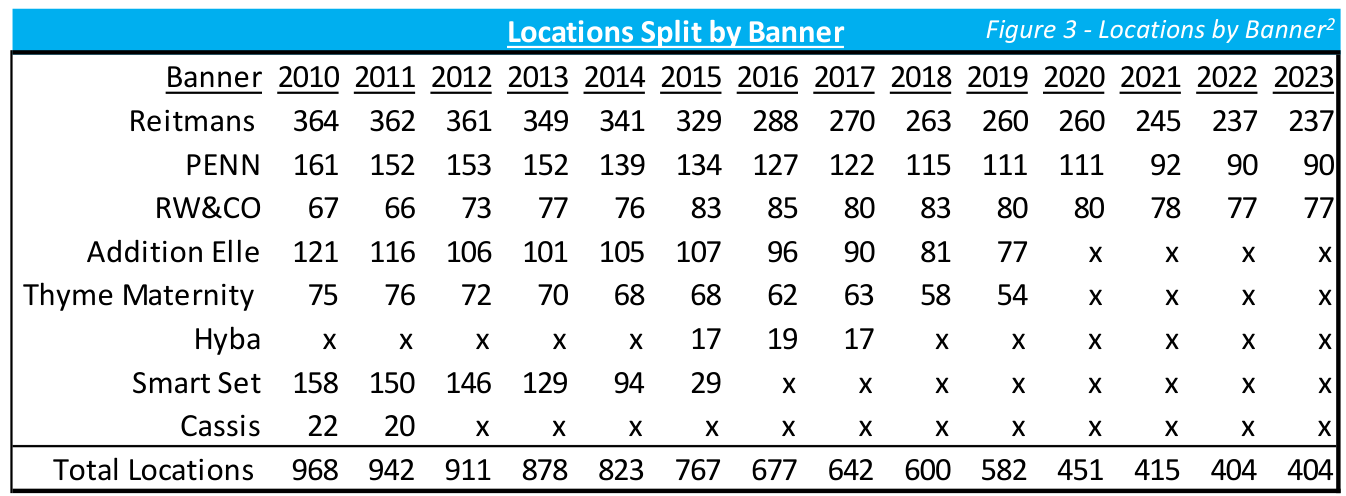
Covid lockdowns proved to be a decisive moment for Reitmans. Due to government forced store closures, Reitmans strategically entered CCAA protection and restructured their business. They exited this process in 2022 after closing over 30% of their stores, consolidating their banners from 5 to 3, laying off 1,600 employees, and paying 50 cents on the dollar to settle debt and liabilities. This process gave them cover, and a cheaper way to close unprofitable stores and renegotiate retail leases at an opportune time. We estimate they saved 10% on lease costs across their high-tier locations, and over 60% on their second-tier locations.
Now the business carries $68m of cash, no debt, has reported Net Income of ~$60m in the last 12 months, owns roughly $240m of real estate in Montreal1, all while trading at a $146m market cap. Add in a quickly growing e- commerce segment, now representing 25% of sales, positive online search trends, increasing revenue per square foot, and decreasing cost per square foot, we think the profitability is sustainable.
In past recessions, like 2001/2002 and 2008/2009, the business remained profitable, as they are a value brand, plus they are one of the few retailers with a growing customer base. We estimate their target market is growing 3.3% per year. We think the stock will see a massive re-rating in 2023 as it gets back onto investors’ radars and reinstates dividends & buybacks, plus gets a push to monetize real estate.
The Company
Reitmans is a publicly-owned, family-controlled business that operates women’s apparel retail stores under the Reitmans, Penningtons, and RW&Co names. Its stores are located in malls and retail power centers throughout Canada and offer affordable fashion to consumers. The company has marketed under the slogans “Affordable, stylish fashions designed to fit everybody and every body”, and “Inspired by role models, not supermodels”.
The Reitmans banner, operating stores averaging 4,700 sq. ft., is one of Canada’s largest women’s apparel specialty chains.
The Penningtons banner, is a leader in the Canadian plus-size market, offering trend-right style and affordable quality for plus-size fashion sizes 12-32. Penningtons operates stores averaging 6,000 sq. ft. in power centres across Canada.
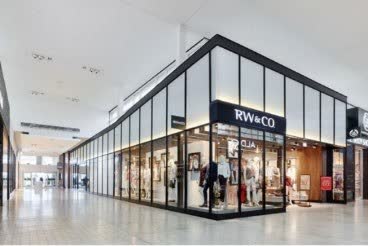
The RW&CO banner operates stores averaging 4,500 sq. ft. in premium locations in major shopping malls, catering to a customer with an urban mindset by offering fashions for men and women.

Reitmans History
Summary of Reitmans History 1926 – 2022
- 1926 – The Reitman’s Dry Good General Store was opened in 1926 by Herman & Sarah on St. Lawrence Blvd in Montreal
- 1929 – Reitmans operated 4 stores in Montreal and restricted its offering to hosiery, lingerie & gloves
- 1936 – First store was opened in Ottawa
- 1939 – First store was opened in Toronto, bringing the total of the chain to 22
- 1941 – Herman ran the company until his death in 1941 and then his son Jack took over
- 1947 – Went public on the Montreal Stock exchange in April 1947
- 1958 – Opened first Western Canadian store in Calgary, Alberta
- 1959 – Opened first Eastern Canadian store in Halifax, Nova Scotia (total chain at 104 stores)
- 1960’s – Evolution of the shopping mall increased total store count to 222 by 1969
- 1965 – Moved main office to 250 Sauve Street West in Montreal (still own and operate in this office building)
- 1967 – Added an additional 4th floor (+40,000 sq. ft)
- 1972 – Added an additional 5th floor (+40,000 sq. ft)
- 1976 – Added an additional 140,000 sq. ft. (385,000 sq. ft total)
- 1970’s – store count grows to 589 by 1979
- 1980’s – Open sourcing office in South Korea
- 1992 – Close South Korea office and open Hong Kong sourcing office (100 employees in Hong Kong by 2006)
- 1995 – Acquired Penningtons banner
- 1996 – Jack Reitman passes away
- 1995 – Acquired 21% interest in NetStar Communications (TSN) ~$40m
- 1996 – Acquired Dalmys (Dalmys, Antels, Cactus)
- *Tax Loss Strategy – closed the stores over the next 4 years
- 1999 – Sold 17% Interest in NetStar Communications for ~$94m
- 2000 – Launched RW&Co (588 total combined stores)
- 2001 – Construction starts on new Distribution Centre in Montreal
- 2002 – Reitmans acquired publicly traded Shirmax for $85m
- Upon closing, the combined entity operated 800 retail stores under 7 banners
- Reitmans, Smart Set/Dalmys, Penningtons, RW&Co, Addition Elle, A/E Sports Co & Lingerie for Addition Elle
- 2003 – Opens new 566,000 sq. ft distribution facility
- 2005 – Open sourcing office in Shanghai, China
- 2006 – Acquire their Sauve Street office/facility for $8,169,000
- 2007 – Launched their e-commerce websites for Penningtons & Addition Elle
- 2008/2009 – Reitmans sales remained flat & maintained profitability during the recession
- 2019 – Chairman & CEO Jeremy Reitman passes away (Succeeded by COO & brother Stephen Reitman)
- 2020 – Temporarily Closes all 587 stores due to Covid restrictions & layoff 90% of retail employees
- 2020 – Announces intentions to restructure operations (Companies’ Creditors Arrangement Act)
- 2020 – Shares delisted from TSX (July) & relisted on TSV (September)
- 2021 – Reitmans announces the results of the CCAA Process
- 2020/2021 – Permanently reduces retail headcount by 1,100 and head office by 300 employees
- 2020/2021 – Full closures of 178 stores (leaving 404 total stores)
- 2022 – Rebrands Penningtons & announces the planned launch of RCL Market
Covid and CCAA Restructuring
As one might expect, Covid lockdowns were especially hard on retailers. For Reitmans, all retail locations were closed effective March 17, 2020. In connection with the store closures, the company laid off 90% of their retail workforce and 30% of head office employees starting March 29th and 30th. Reitmans stores span across the country and each province had varying Covid lockdown policies. As of fiscal Q4 2021, 58% of Reitmans stores were still closed, partial shutdowns continued into fiscal Q1 2022 and even through fiscal Q1 2023, there were still store capacity constraints in place. As of July 31, 2021, all stores were fully re-opened, and all restrictions were lifted at the end of fiscal Q1 2023.
With all the stores closed, China factory shutdowns limiting the supply of goods, and debt/lease liabilities on the balance sheet, Reitmans announced entering CCAA protection on May 19th, 2020. During this process, they closed all Thyme Maternity & Addition Elle stores and laid off 1,600 employees (closed about 131 stores total). In 2020 those brands accounted for $164m in revenue, 49% gross margins and lost $1.1m (-1% net margins). During the CCAA process the stock was delisted July 29th, 2020 and relisted on the Venture September 3rd, 2020. In 2020, they also announced they would be promoting then President & COO Stephen Reitman to CEO (CEO Jeremy Reitman passed away December 28th, 2019). In addition, they revamped the leadership team and appointed new board members.
The total liability claims were $195m with the largest creditors listed below. After negotiations, Reitmans settled the $195m in liabilities for a total cost of $95m. They emerged from bankruptcy proceedings on January 12th, 2022.
|
CCAA Proceedings – Sample List of Creditors |
|
|
Landlords ((Rent)) |
$39,729k |
|
Supplemental Executive Retirement Plan |
$20,936k |
|
Employees |
$12,281k |
|
Talentex Limited |
$6,960k |
|
Buttress International Trading |
$5,229k |
|
Postes Canada |
$3,954k |
|
Jiangsu Sainty Techowear |
$3,797k |
|
Tainan Enterprises |
$3,395k |
|
RCL Asia |
$3,344k |
|
Defined benefit pension plan |
$3,225k |
|
*Total Claims |
$192,656,167 |
|
*Over about ~1,700 claims CCAA Process had them pay $95m to cover the +$190m |
One of the most important aspects of the process was lease negotiations. With over 400 retail locations across the country, rent costs are a major expense.
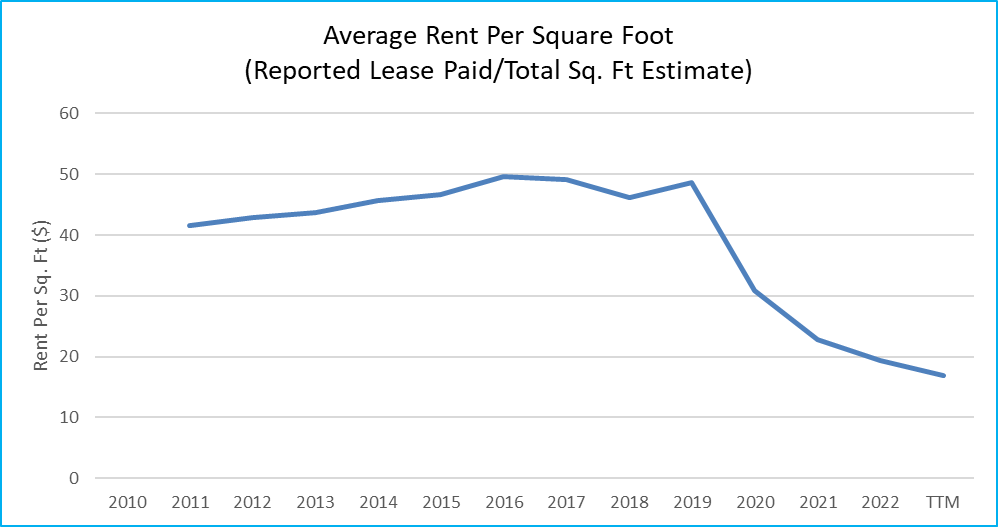
Reitmans hasn’t released specifics surrounding the lease negotiations for the remaining stores during CCAA but there are a few data points to follow. For starters, negotiating during Covid gave Reitmans the upper hand considering the market became one of the best “renter’s markets” in recent memory. One of their Landlords, SmartCenter (SRU-U), is known as being one of the strictest in the industry. On page 59 of the Q3 MD&A they disclose gross rent and leased area by client. Over the last four quarters, Reitmans is
paying 10% less per square foot versus the preceding four quarters at SmartCenter locations. This represents about 15% of all Reitmans locations. As the graph to the right depicts, it appears like Reitmans was able to negotiate much better lease terms. Based on disclosed ‘lease payment’ and estimated total square feet, we estimate other landlords in less attractive locations negotiated much higher discounts for Reitmans.
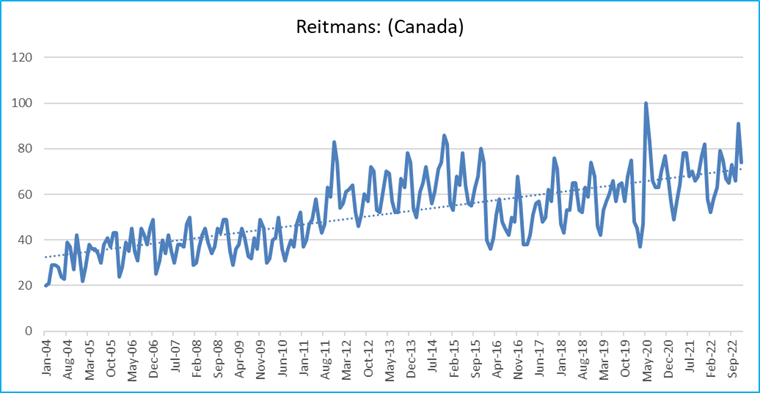
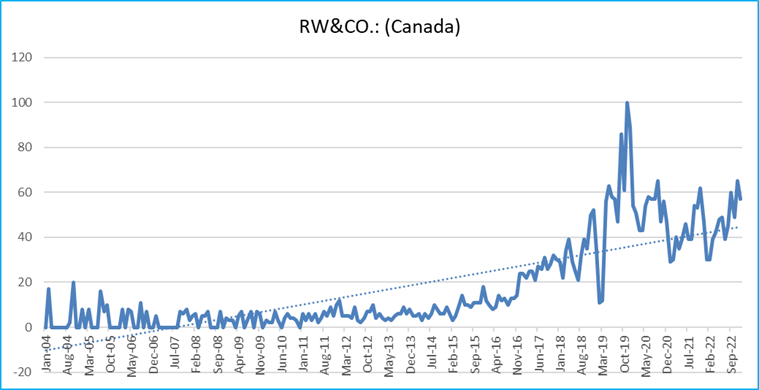
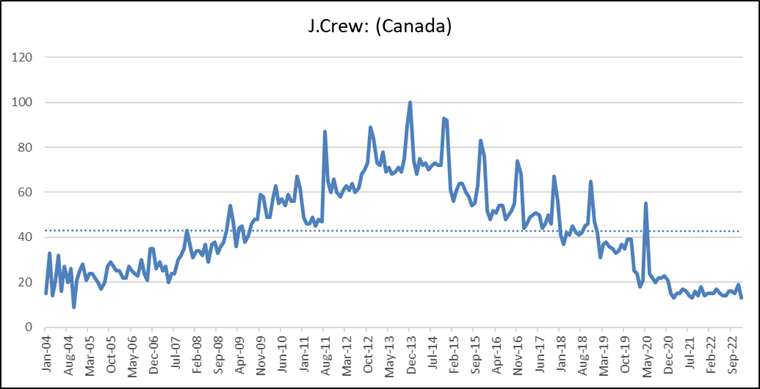
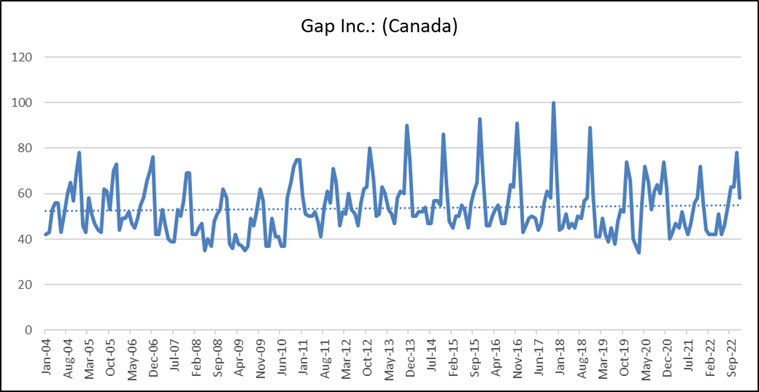
Online Search Trends
Retail can be hard to analyze because there are overarching macro factors that have an impact across the entire industry, but there are a lot of individual nuances that vary from company to company. These unsystematic risks include decisions relating to fashion choices, marketing strategy, product value, customer experience, etc.
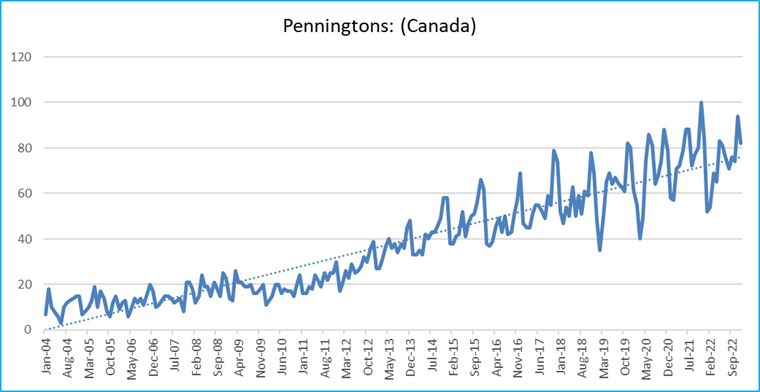
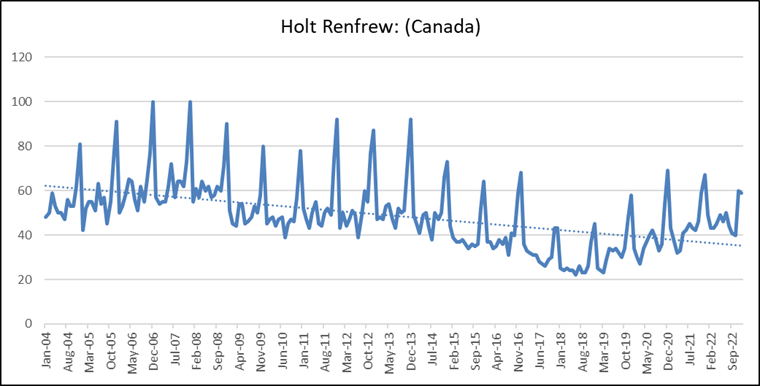
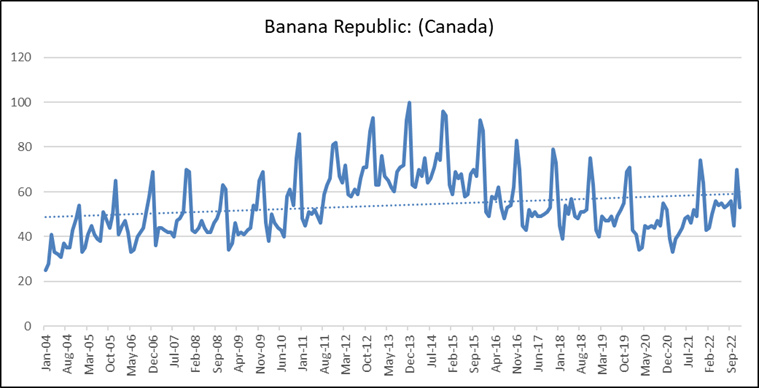
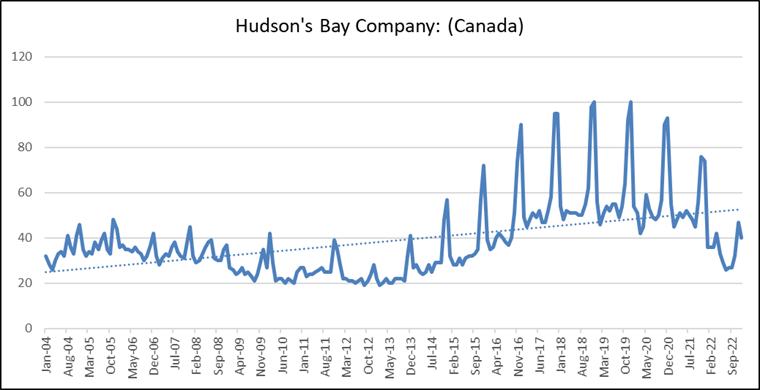
In order to gauge how well Reitmans has been performing relative to its competitors, we have included over the next three pages the online Google search trends for Reitmans’ 3 banners compared to some of their competitors during the same timespan. As one can see, the trendlines for each of their banners have been trending in a positive direction for a long time. What makes this more impressive however, is the relative performance versus many of their competitors. Based on our analysis, we believe Reitmans has been connecting with the consumer based on fashion, marketing, value, and experience while many competitors have stagnated and fell behind. Penningtons specifically has been most impressive, and we think a lot of the success has to do with lack of competition in a segment that has underlying demographic growth. Refer to Appendix 1 and 2 for information regarding competition per women’s size bracket plus demographic growth. Penningtons is the one banner Reitmans plans on growing in calendar 2023, adding 10 locations overall.
E-Commerce
Reitmans launched their inaugural websites in 2007. From fiscal 2015 to 2018 they disclosed e-commerce sales growth:
|
Fiscal Year |
E-Commerce Sales Growth |
|
2015 |
63.5% |
|
2016 |
69.1% |
|
2017 |
50.7% |
|
2018 |
38.2% |
Part of the reason many of their financial metrics have been improving as of late is due to the success of their omni-channel strategy. E-commerce sales now account for 25% of all sales. Over the past few months, we have experimented with buying from each site, shipping to multiple locations, and returning items. What we have found is a top tier online experience.
In our experiments, we experienced the following with the various aspects of the process:
- Online Ordering: immediate email confirmations
- Shipping: shipping confirmations and tracking numbers provided the same day as order
- Delivery: delivered next day for urban addresses, and within two days for rural
- Returns: ‘Returns’ button within order confirmation allows one to print return labels; notification received when it was delivered and refunded
Much of the growth and margin improvement can be tied to their e-commerce abilities. Overall, the quality and growth of their e-commerce offering is one of the main drivers of their operating success.
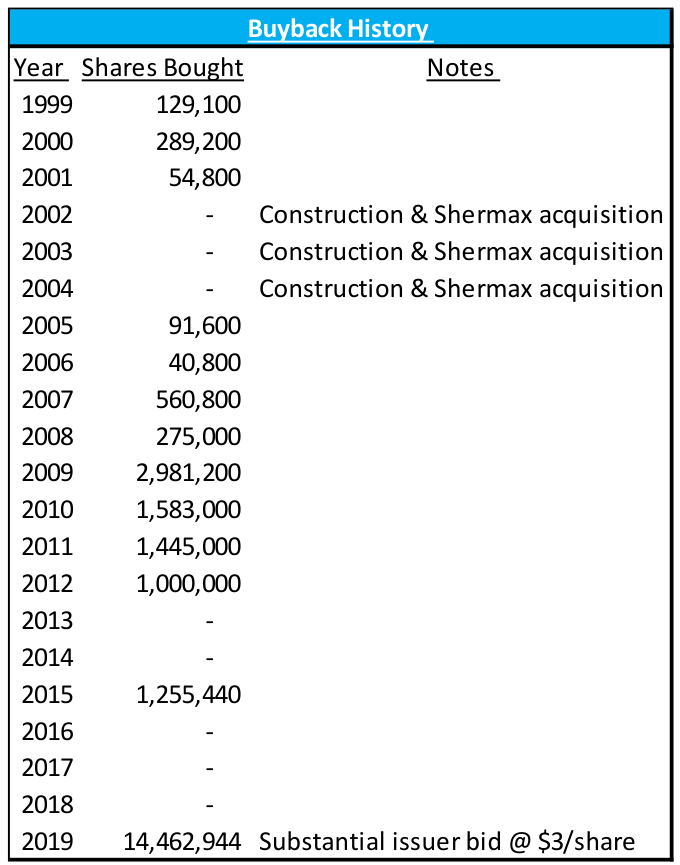
Buybacks and Dividends
Reitmans’ management has a propensity for buybacks and dividends, and we believe this trend, plus their current cash levels and valuation1, set up an ideal scenario for the company to renew their buyback and dividend policies. However, we expect management to be conservative in the short-term considering the macro environment.
When asked about capital allocation, management has stated they are focused on profitability at the moment. In the past, the company’s stated objective was to payout 50-80% of sustainable earnings per share. Considering the amount of free cash generation, cash on the balance sheet will build quickly. Considering the current valuation1, stock buybacks are extremely accretive for shareholders, and we expect management will continue to be pushed into initiating a NCIB.
Financial Outlook
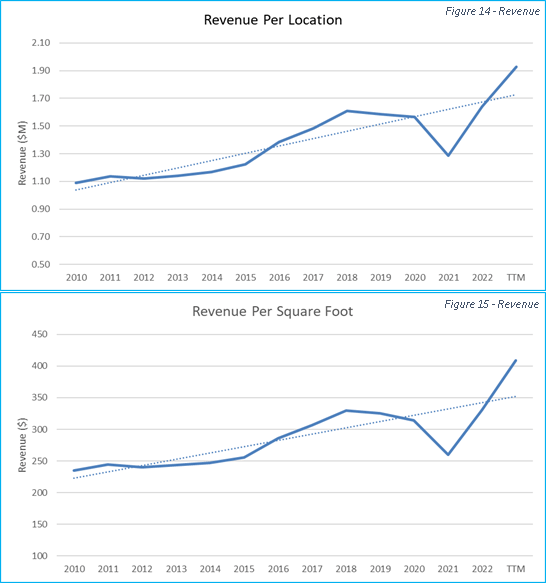
With the company exiting their Covid issues with a much cleaner balance sheet and streamlined operations, the profitability metrics have improved considerably. The growth of their e-commerce business and past store rationalizations have helped improve their profitability metrics for over a decade (See Figures 14 and 15 below).
As shown below, using square foot estimates from Appendix 3, revenue per location and revenue per square foot (not adjusted for online sales), has been steadily improving.
The most important aspect of this investment in our view, is assessing the reliability of earnings going forward. Below we weigh secular growth, gross margin inputs, cost savings, incentives, and company history to come to the conclusion that Reitmans’ earnings will be much more resilient than what is currently priced into the stock.
Revenue Growth
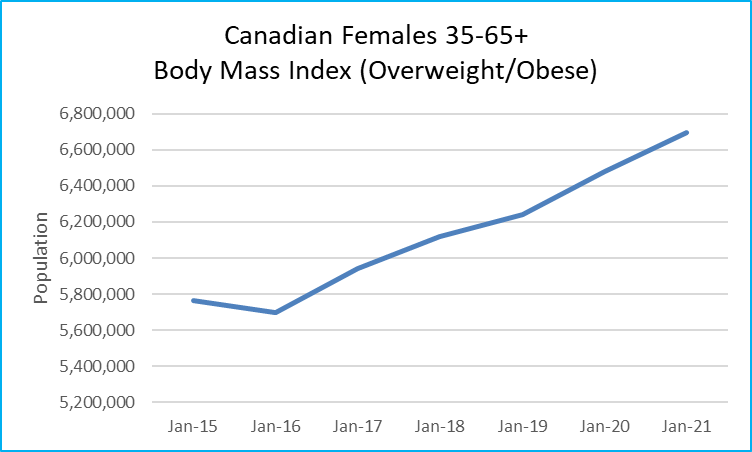
- Reitmans is one of the only retailers with favourable demographics. With a focus on mature women, with specific banners and brands servicing plus size women, we estimate their target population is growing 3.3% per year (See Appendix 2).
- Reitmans has now completed their store rationalizations and plan on growing the Penningtons banner by 10 stores, representing roughly 3% growth in Reitmans overall square footage.
- According to Mastercard SpendingPulse, Canadian Apparel Spending was up 3.2% in November 2022 vs. 2021. This is the most recent data available on the industry in general. More specifically, retail spending on apparel was up 6.6% YoY on Black Friday (November 25th, 2022). Both data points suggest a fairly stable retail environment.
- Based on the above factors, and being conservative and factoring in an economic slowdown for 2023 (recession), we’re projecting 3.1% revenue growth in Fiscal 2024 (February 2023-January 2024).
Gross Margins
- Gross margins are most impacted by foreign exchange, followed by promotional activity, input costs, and shipping. Reitmans margins faced headwinds in 2020-2022 that we think have now subsided and the outlook is for gross margins to return to +60% like they were from 2011-2015.
- Foreign Exchange – Merchandise payments are settled in USD (80% of products from China). In the past they have used derivative instruments to hedge this exposure. The USD is down to start 2023 but was strong in the second half of 2022. Depending on time of orders, the strength in the USD could hurt gross margin in Q4 and Q1.
- Promotional Activity – The amount of promotional activity in any given season can vary widely from retailer to retailer. In order to get a sense of promotional activity this year versus prior years we used Waybackmachine.com to monitor the 3 banners online and compare their discounts from 2019-2023. As you can see below, the 2022 holiday period seems to have needed less promotional activity across all three banners. We view online ads plus in store visits quite favourably for 2022.
Annual Forex Rates
|
USD/CAD3 |
|
|
Current |
$ 1.35 |
|
2022 Average |
$ 1.30 |
|
2021 Average |
$ 1.25 |
|
2020 Average |
$ 1.34 |
|
2019 average |
$ 1.33 |
Online Deals
|
Comparing Discounts 2019-2023 |
||||
|
Reitmans |
12/29/2022 |
12/29/2021 |
12/25/2020 |
12/31/2019 |
|
Headline Deal |
Up to 70% off sale items *Extra 20% |
Up to 70% off sale items *Extra 30% |
Up to 70% off sale items *Extra 30% |
40% off everything |
|
Other |
25% off new arrivals |
25% off new arrivals |
25% off new arrivals |
Up to 70% off sale styles |
|
Subscriber Rebate |
15% off code |
20% off code |
20% off code |
20% off code |
|
Penningtons |
1/5/2023 |
1/20/2022 |
1/19/2021 |
12/24/2019 |
|
Headline Deal |
30% of Active Zone |
30% off (almost) everything |
Extra 60% off sale items |
Extra 50% off sale styles |
|
Other |
– |
– |
– |
– |
|
Subscriber Rebate |
– |
– |
– |
– |
|
RW&CO |
1/6/2023 |
1/20/2022 |
1/19/2021 |
12/31/2019 |
|
Headline Deal |
30% off regualr priced items |
25% off outerwear |
Up to 70% off |
Up to 70% off sale items *Extra 20% |
|
Other |
Up to 60% off sale items *Extra 30% |
Up to 60% off sale items *Extra 30% |
– |
– |
|
Subscriber Rebate |
10% off code |
10% off code |
10% off code |
10% off code |
|
Cost of Cotton3 |
|
|
Current |
$ 83.39 |
|
2022 Average |
$ 112.62 |
|
2021 Average |
$ 93.53 |
|
2020 Average |
$ 64.15 |
|
2019 average |
$ 67.19 |
|
Cost of Shanghai Export Container3 |
|
|
Current |
$ 1,031 |
|
2022 Average |
$ 3,345 |
|
2021 Average |
$ 3,818 |
|
2020 Average |
$ 1,261 |
|
2019 average |
$ 811 |
- Input Costs – The main input cost for Reitmans is the cost of cotton. The price of cotton spike at the beginning of 2022 but has since dropped 46% from the highs in May. The current price is back to 2018 levels and we see this is as a positive for gross margins for calendar 2023.
- Shipping Costs – The most drastic price jump was shipping costs. 2020 saw an increase but nothing like 2021 and 2022. At its peak, the cost of shipping from China increased +400% from 2019 to 20223. The price has since dropped 80% from its peak and it back to 2018-2019 levels which should help boost margins going forward.
- Seasonality – Fiscal Q1 is by far the weakest, where the company historically operates around breakeven and makes a majority of their earnings in Fiscal Q2 & Q4
- Overall, these factors are lining up well for improved gross margins in Fiscal Q4 2023 and Fiscal 2024.
Cost Savings
- Debt Costs – Reitmans paid off all existing interesting-bearing debt in fiscal Q2 2023. They paid off the remaining $34.4m of debt using cash and cash flow.
- Lease Payments – As referenced in Figure 2, the CCAA process allowed Reitmans to negotiate much better terms on leases. The overall cost savings is hard to estimate but Smart Centre (SRU-U) is known as one of the strictest landlords, and in their Q3 MD&A they disclose a 10% decrease in cost per square foot for Reitmans. Based on disclosed ‘lease payments’ and estimated total square feet, we estimate other landlords in less attractive locations negotiated much higher discounts for Reitmans.
- Head Office Rationalization – During CCAA proceedings, Reitmans laid off 1,600 employees. Most of these employees worked at Thyme Maternity or Addition Elle, but we estimate 10-15% of the 1,600 were head office employees. The Thyme Maternity & Addition Elle brands were losing money and a drag on the business. The restructuring process allowed them to close the stores and layoff employees is a more beneficial way for the company.
Incentives
During the CCAA process, the company put a new bonus structure in place. The bonuses are tied to operating profit per store less direct overhead. A minimum is established, and bonuses are paid on exceeding such minimum. Incentives in this case are directly tied to store profits and mesh with management’s recent comments that their focus is on company profitability. However, these bonuses are a risk because the company is under Reitman family control. There is a possibility of excessive bonuses and unaligned economics. The bonuses were fairly large over the past two reported quarters. That being said, the company overall was still extremely profitable after this expense.
History
The fact that Reitmans has been in business for almost 100 years offers some insight into relative performance during economic slowdowns. For example, during the economic downturn in Canada in 2002, Reitmans had their best retail operating results in their history. They have resilience due to the fact that their banners are perceived as “value stores” versus leisure, luxury, or specialty. In 2008, during the financial crisis, Reitmans’ total revenue declined 0.6% and they maintained 8.2% profit margins ($86m in profits). As the recession continued into 2009, Reitmans’ revenue increased 0.5% with 6.4% net margins ($67m in profits).
Valuation
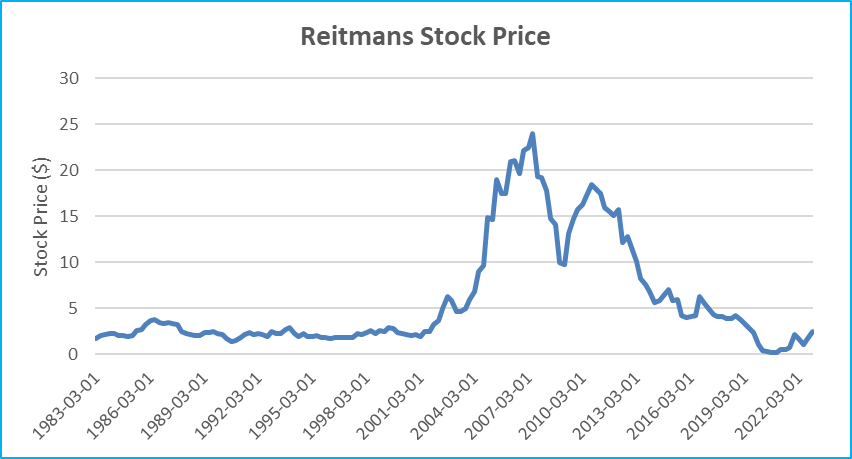
Reitmans’ valuation is the most compelling aspect of the story from an investment standpoint. We believe the stock is as cheap as it is mainly due to the complexity and confusion of the CCAA proceedings. In addition, there is no analyst coverage, and many institutional investors cannot invest on the TSX Venture, especially not in something that’s currently this small ($146m market cap).
From 2010-2019, the stock traded on an average price to cashflow of 7.7x, and we currently estimate it is trading on 2-2.5x cashflow. Plus, the company is currently sitting on $68m of cash and no debt as of last quarter, and has about $240m of real estate assets.1
Equity
- Over the trailing 9 months, Reitmans has reported over $60m in operating cash flow
- Based on costs savings and resilient revenue described above, we believe the business can conservatively generate $57-$62m in cash flow over the next 12 months.
- Factoring interest rates, we believe the equity value of the stock should trade on at least a 7x cashflow.1
- This values the operating business at $8.16-$8.88 per share.1
Cash
- In Reitmans’ most recent quarter they reported $68m of cash.
- Their quarter ending January 31st, 2023 should increase this amount by roughly $90m.1 This accounts for approximately $1.84 per share but we highly discount this amount in our value because management is known to be conservative and maintain large sums of cash on the balance sheet.
- A portion of cash should be used for a stock buyback which would be significantly accretive at a 40% cash- flow yield.
Real Estate

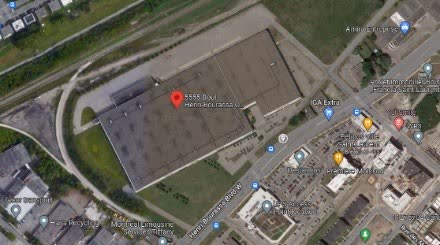
- As referenced in the history timeline, Reitmans moved into their current office building in 1965, added two floors plus additional space.
- We estimate the building is currently worth
$118,400,000.4
- Reitmans started construction on their distribution facility in 2001 and opened it in 2003.
- The facility has 40 shipping and receiving docks, capable of processing more than 55m units of merchandise per year.
- We estimate the building is currently worth $123,490,000.5
- This is most likely conservative because it doesn’t factor in the 1.1m sq.ft of total land the building operates on

- Much like the comments around cash on the balance sheet, a discount needs to be applied to the real estate value because the probability is much less than 100% that value for shareholders will be realized here.
- We believe Reitmans will be asked by shareholders to complete a sale and leaseback of this real estate.
- The Reitman family should purchase this land from Reitmans the corporation, and enter in a long-term lease.
- This allows investors to invest solely in the operating business (retail business).
- We believe the current office space is underutilized by the company.
- The value of both assets is much more separate than together and allows public shareholders to invest in the retail business outright.
- This is becoming a fairly regular occurrence in public markets.
- In 2003, Reitmans did a sale and leaseback on their distribution center handling equipment.
- Some other companies that currently have are currently doing a sale/leaseback, or have recently completed one include: Firan Technology (FTG), McCoy Global (MCB), Bally’s Corp (BALY), Life Time (LTH), Kohl’s (KSS), Sherwin-Williams (SHW), and Six Flags (SIX).
- We believe after fees, taxes and applying a conservative discount, a real estate divestiture could yield the company over $3.50/share.
Base Case
- Our base case for the stock factors in a +$8/share value1 for the operating business and no value being created by management when it comes to cash and real estate.
Upside Scenario
- Our upside scenario is +$12/share1 which factors in a share buyback, sale/lease of property, and continued trajectory of operating performance.
Risks
- Fashion – With any apparel retailer there is the main fashion risk. Being late or completely missing trends can destroy value.
- Foreign Exchange – Fluctuations in USD/CAD will impact gross margins and profitability.
- Weather – Above or below average temperatures can impact demand for seasonal products. Canada’s current mild winter may factor into weak winter clothing sales.
- Recession – Economic weakness can decrease consumer spending.
- Structure – Reitmans operates with a dual class share structure. The Reitman family currently controls the majority of the voting shares and therefore controls the company.
Summary
Covid, CCAA proceedings and the current economic environment have created the current opportunity in Reitmans stock. With the business now streamlined and focused on profitability, we think the stock will trade back to a regular multiple. We believe there is enough upside to invest strictly based on the retail operating business. That being said, there is a significant opportunity to monetize the balance sheet which limits the overall downside at these prices.
DISCLAIMERAll estimates, projections, and calculations have been generated by DKAM. This does not constitute advice for personal investments but rather a breakdown of how Donville Kent approaches stock analysis.
Readers are advised that the material herein should be used solely for informational purposes. Donville Kent Asset Management Inc. (OTC:DKAM) does not purport to tell or suggest which investment securities members or readers should buy or sell for themselves. Readers should always conduct their own research and due diligence and obtain professional advice before making any investment decision. DKAM will not be liable for any loss or damage caused by a reader’s reliance on information obtained in any of our newsletters, presentations, special reports, email correspondence, or on our website. Our readers are solely responsible for their own investment decisions. The information contained herein does not constitute a representation by the publisher or a solicitation for the purchase or sale of securities. Our opinions and analyses are based on sources believed to be reliable and are written in good faith, but no representation or warranty, expressed or implied, is made as to their accuracy or completeness. All information contained in our newsletters, presentations, reports or on our website should be independently verified with the companies mentioned. The editor and publisher are not responsible for errors or omissions. Past performance does not guarantee future results. Unit value and investment returns will fluctuate and there is no assurance that a fund can maintain a specific net asset value. The fund is available to investors eligible to invest under a prospectus exemption, such as accredited investors. Prospective investors should rely solely on the Fund’s offering documentation, which outlines the risk factors in making a decision to invest. DKAM receives no compensation of any kind from any companies that are mentioned in our newsletters or on our website. Any opinions expressed are subject to change without notice. The DKAM Capital Ideas Fund, employees, writers, and other related parties may hold positions in the securities that are discussed in our newsletters, presentations, reports, or on our website. |
Appendix 1 – Women’s Plus Size Items
|
Number of Women’s Items Sizes 0-32 |
|||||||||||||||||
|
Size |
0 |
2 |
4 |
6 |
8 |
10 |
12 |
14 |
16 |
18 |
20 |
22 |
24 |
26 |
28 30 |
32 |
|
|
Penningtons |
30 |
120 |
119 |
113 |
112 |
108 |
105 |
66 |
80 36 |
40 |
|||||||
|
Reitmans |
45 |
50 |
73 |
77 |
70 |
79 |
80 |
82 |
79 |
83 |
80 |
67 |
65 |
||||
|
RW&CO |
90 |
92 |
93 |
88 |
91 |
88 |
73 |
75 |
56 |
||||||||
|
Old Navy (Plus) |
483 |
510 |
464 |
456 |
425 |
427 |
366 |
368 |
372 |
360 |
318 |
314 |
378 |
399 |
461 430 |
||
|
Forever 21 (Plus*) |
7 |
15 |
17 |
19 |
17 |
14 |
10 |
3 |
9 |
10 |
10 10 |
4 |
|||||
|
H&M |
272 |
312 |
356 |
377 |
368 |
330 |
375 |
408 |
419 |
452 |
236 |
44 |
30 |
34 |
|||
|
Laura.ca (Plus) |
103 |
47 |
832 |
928 |
936 |
889 |
828 |
783 |
596 |
312 |
287 |
270 |
213 |
||||
|
J-Crew |
175 |
191 |
188 |
190 |
183 |
180 |
169 |
174 |
171 |
137 |
146 |
148 |
157 |
||||
|
Eddie Bauer (Plus) |
40 |
41 |
40 |
41 |
40 |
40 |
40 |
38 |
38 |
26 |
21 |
20 |
20 |
||||
|
Banana Republic |
102 |
103 |
99 |
97 |
95 |
93 |
95 |
98 |
99 |
97 |
69 |
||||||
|
The Gap |
70 |
43 |
82 |
80 |
77 |
80 |
75 |
74 |
71 |
54 |
53 |
||||||
|
Aritzia |
291 |
283 |
284 |
272 |
255 |
248 |
252 |
143 |
137 |
||||||||
|
Total Items |
1678 |
1687 |
2528 |
2625 |
2557 |
2468 |
2393 |
2366 |
2157 |
1634 |
1322 |
971 |
977 |
509 |
551 476 |
44 |
|
|
Reitmans’ Banners (%) |
8% 8% 7% |
6% |
6% |
7% 8% |
12% |
12% |
12% |
15% |
18% |
17% |
13% |
15% |
8% |
91% |
|||
*Only numerical sized items included
**Canadian websites
Appendix 2 – Canadian Females BMI
Appendix 3 – Square Foot Estimate
|
Reitmans Total Sq. Ft. Estimate |
||||||||||||||
|
Banner |
2010 |
2011 |
2012 |
2013 |
2014 |
2015 |
2016 |
2017 |
2018 |
2019 |
2020 |
2021 |
2022 |
2023 |
|
Reitmans |
4,700 |
4,700 |
4,700 |
4,700 |
4,700 |
4,700 |
4,700 |
4,700 |
4,700 |
4,700 |
4,700 |
4,700 |
4,700 |
4,700 |
|
PENN |
6,000 |
6,000 |
6,000 |
6,000 |
6,000 |
6,000 |
6,000 |
6,000 |
6,000 |
6,000 |
6,000 |
6,000 |
6,000 |
6,000 |
|
RW&CO |
4,500 |
4,500 |
4,500 |
4,500 |
4,500 |
4,500 |
4,500 |
4,500 |
4,500 |
4,500 |
4,500 |
4,500 |
4,500 |
4,500 |
|
Addition Elle |
6,000 |
6,000 |
6,000 |
6,000 |
6,000 |
6,000 |
6,000 |
6,000 |
6,000 |
6,000 |
6,000 |
6,000 |
6,000 |
6,000 |
|
Thyme Maternity |
2,400 |
2,400 |
2,400 |
2,400 |
2,400 |
2,400 |
2,400 |
2,400 |
2,400 |
2,400 |
2,400 |
2,400 |
2,400 |
2,400 |
|
Hyba |
3,000 |
3,000 |
3,000 |
3,000 |
3,000 |
3,000 |
3,000 |
3,000 |
3,000 |
3,000 |
3,000 |
3,000 |
3,000 |
3,000 |
|
Smart Set |
3,400 |
3,400 |
3,400 |
3,400 |
3,400 |
3,400 |
3,400 |
3,400 |
3,400 |
3,400 |
3,400 |
3,400 |
3,400 |
3,400 |
|
Cassis |
3,600 |
3,600 |
3,600 |
3,600 |
3,600 |
3,600 |
3,600 |
3,600 |
3,600 |
3,600 |
3,600 |
3,600 |
3,600 |
3,600 |
|
Total Square Feet |
4,500,700 |
4,370,800 |
4,248,400 |
4,111,400 |
3,891,500 |
3,678,600 |
3,279,900 |
3,103,200 |
2,924,800 |
2,839,600 |
2,248,000 |
2,054,500 |
2,000,400 |
2,000,400 |
Editor’s Note: The summary bullets for this article were chosen by Seeking Alpha editors.
Editor’s Note: This article discusses one or more securities that do not trade on a major U.S. exchange. Please be aware of the risks associated with these stocks.
Be the first to comment