

Drew Angerer/Getty Images News
Written by Sam Kovacs
Introduction
It’s clear now.
The Fed has signaled that it is willing to accept a recession to tame inflation.
Taking a page out of Paul Volker’s playbook, or we could even say “went full Volcker,” when Jerome Powell announced yet another 75bps hike to the Fed Funds rate.
His statement Wednesday confirmed this:
The chances of a soft landing are likely to diminish to the extent that policy needs to be more restrictive, or restrictive for longer. Nonetheless, we’re committed to getting inflation back down to 2%.
Higher rates spell trouble for the economy.
For markets, it’s a different story. Markets price expectations and are forward-looking.
Markets will drop on the expectation of bad news. They might drop more on the confirmation of bad news, but then they look ahead to determine their direction.
Right now markets are at a clear inflection point where, as I said in a recent article, the S&P 500 could easily be up 25% or down 25% depending on how things play out.
A 25% drop from these levels sounds daunting, but I’m totally unfazed by it.
My 10-year outlook for U.S. stocks remains super strong. Yes, some still think that China will overtake the U.S. by the end of the decade.
Others have said that of Japan, of Russia in the past. It is clear today those claims were ridiculous.
And whether the Chinese economy manages to get to number 1 or not, does not mean it will de facto become the best market to invest in equities.
In fact, no nation has ever even gotten close to the U.S.’s standard of shareholder capitalism, one in which we recognize that without the owners of the business, there would be no business. Sure, that can be said of workers as well, but we can agree that when workers need money and shareholders have money, the balance of power is tipped to one side.
The demise of Jack Ma last year is a story that I think about at least once a month.
China is not the U.S. Nor does it give individuals the liberty to express themselves and build wealth. It has no aspiration to become that, so why act like it will?
That’s without mentioning that the U.S. has near hegemony of cultural influences in a globalized world.
I’m at the other side of the world, in Bali, writing on an American Dell laptop, wearing an American Apple Watch, listening to American Hip hop in my American Apple Airpods (dammit Apple, you got me good), and tonight I’ll go home and watch some American TV and read a book by an American author.
Yet I’ve only stepped on American soil once in my life, when I was 16 (I am planning on travelling through the U.S. next year, however).
If you, like me, believe the U.S. is here to stay, then you can invest in stocks for the long haul.
If you want to do better than the indices, then you have to be smart about it.
Our dividend freedom investing framework gives us the perspective we need to take on some of the major components of a winning stock market strategy:
- It focuses our attention on high-quality stocks.
- It forces us to buy low.
- And it disciplines us to sell high.
- All while taking a long-term approach.
So we are net buyers in all market conditions. There is always something overvalued, and always something undervalued, even among the world’s best companies.
That being said, among the pool of good buying opportunities, we always try and buy the stocks which have the best outlook given current market parameters (these change over time).
With a hawkish Fed, it might be a good time to pick a couple of defensive stocks which are still historically undervalued.
Here are two stocks which we believe will do great in the current environment, and one which we think is worth selling.
Two High Growth Dividend Buys
Buy Amgen
Amgen Inc. (AMGN) seems to have been forever on our buy list.
The stock has been struggling as it is in a transitory phase where some of its key drugs are seeing reduced sales and its other drugs are still ramping up.
But here’s the thing: healthcare is one of the most defensive sectors, and Amgen’s diversified portfolio continues to see new drugs gain approval and gain market share.
From a valuation point of view, Amgen is looking great right now.
Take the 10-year MAD Chart below. (To learn more about MAD Charts, click here.)
AMGN 10 Year MAD Chart (Dividend Freedom Tribe)
During the past 10 years, AMGN’s yield has gravitated between 1.43% and 3.5%.
It currently sits at 3.4%.
Looking at a 5-year MAD Chart will give us a better picture of the yield ranges. As you can see above, the lower yields were frontloaded in the first 3 years of the past decade.
AMGN 5 Year MAD Chart (Dividend Freedom Tribe)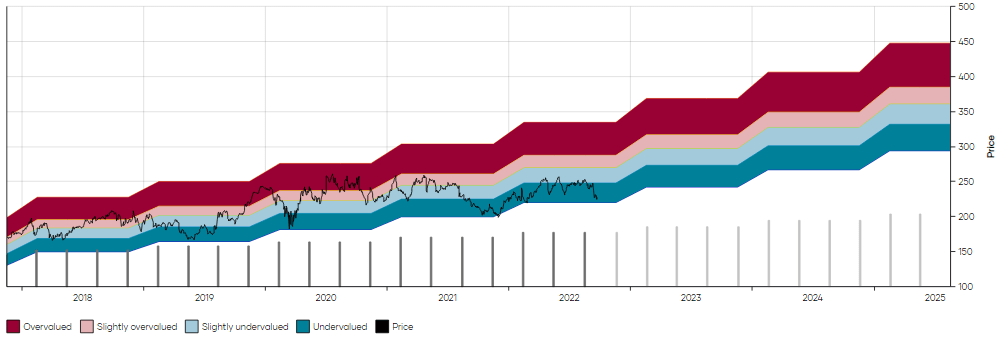
During the past 5 years, the range of yields has been a lot tighter, between 2.35% and 3.5%.
The core 50% of the time, it has yielded between 2.7% and 3.1% (represented by the pink and light blue areas on the chart) and yielded a median 2.9%.
Whenever the stock has reached or approached a 3.5% yield, it has bounced. You can see this in 2019, 2020, and 2021.
That means the stock would theoretically have no more than 3% downside from here. Of course, things could always get worse, but given the defensive nature of the healthcare sector, I’d be willing to wager AMGN being close to a bottom.
Given that two quarters from now, we can expect an 8% to 10% dividend increase, there is a good case to make for AMGN.
An 8% dividend increase would set the implied price for AMGN at its median yield of 2.9% at $300, which would provide 30% upside from current levels.
Why am I confident that AMGN can increase its dividend by at least 8%?
A few reasons.
The first is that during the past 5 years, management has been willing to let payout ratios ramp up, as the dividend has outpaced earnings and free cash flow. Payout ratios have gravitated from 35-40% to 50-55% of free cash flow.
I wouldn’t be surprised to see management let them run to 60-65%.
AMGN Payout Ratios (Dividend Freedom Tribe)
This is a mixed signal. On one end, it shows that AMGN is accepting a position where a larger portion of its capital is returned to shareholders.
It also means that unless growth can pick up, it will have to slow down the rate of growth.
On the other end, it means that a combination of modest growth and buybacks, combined with a slight reduction in dividend growth, would be sufficient to keep payout ratios stable.
You see over the last year, AMGN has bought back a convincing 6.7% of its shares.
A 6.7% reduction in shares allows for a 7.5% increase in dividends without changing payout ratios.
Growth, then, only requires 0.5% growth for payout ratios to remain stable and healthy.
I think this is a very low threshold for AMGN to meet.
Furthermore, with the 3.4% yield, 8% dividend growth is more than enough to meet income expectations of most investors.
If you were to invest $10K in AMGN today, and the dividend was to grow at 8% per annum and you were to reinvest the dividends, then in year 10 you’d expect annual income of $1,024 or 10% of your original investment.
AMGN Dividend Simulation (Dividend Freedom Tribe)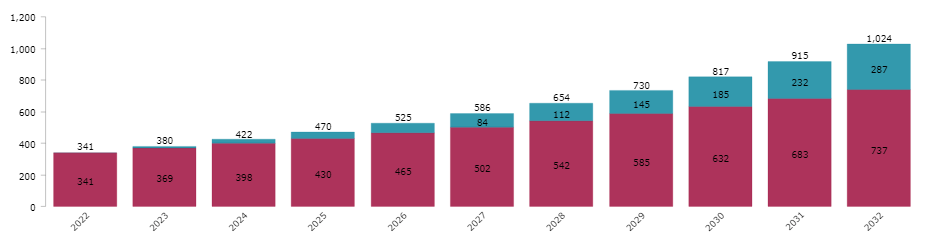
Many defensive names are trading at premiums.
Not AMGN.
You get to buy a defensive stock, at a great valuation, with a shareholder-friendly management. It’s a no-brainer, in my opinion.
Buy ONEOK
ONEOK, Inc. (OKE) was one of our best pandemic peaks where we rode the stock from $30 up.
I have long suggested that it is a great pick for dividend investors all the way up to $60.
The midstream natural gas company is more dependent on natural gas volumes than on natural gas or oil prices themselves, as is shown in the slide below by management.
Q2 Earnings Call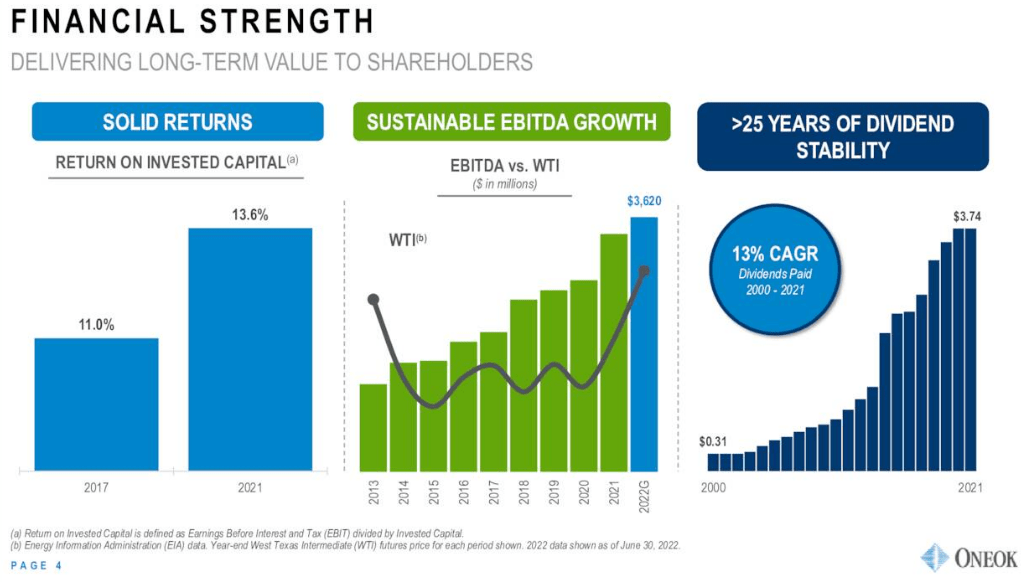
And as management pointed out in the second quarter earnings call, volumes have been higher. The outlook remains high also.
Compared with the first quarter of 2022, higher second quarter results were driven by increased NGL volumes across our operations and higher realized commodity prices primarily benefiting our Natural Gas Gathering and Processing segment.
With Russia cutting off natural gas to Europe, the US started exporting much more of its natural gas to the continent, as much as 60% in August.
With supply remaining tight for the foreseeable future, volumes should remain high through OKE’s assets, which bodes well for growth.
This has allowed management to invest in expansion opportunities, which will fuel growth in upcoming years.
We expect total 2022 capital expenditures to trend towards the upper end of the range of our guidance range of $900 million to $1.05 billion, driven by higher producer activity levels and expansion opportunities in our natural gas pipeline business.
Various bolt-on projects, like the expansion of storage capabilities which are 90% subscribed for the next 7 years, prove the nature of OKE’s cash printing model.
Additionally, we are expanding our storage capabilities in Oklahoma, enabling an additional 4 billion cubic feet of storage capacity to be contracted. This project is expected to be complete in early 2023, and is nearly 90% subscribed through 2029.
Now, of course, the problem with OKE has been management getting too excited too quickly when it ramped up operations.
This has happened in between 2014 and 2016, when following large expansion and increased leverage and dividend payments, the oil & gas market tanked.
It then happened again in 2020, when after 3 years of large CAPEX outlays, the pandemic killed oil & gas once more.
OKE 25 Year MAD Chart (Dividend Freedom Tribe)
But payout ratios are now trending towards 100%, and are likely to be below that level in 2023.
By 2024, we might even see another dividend increase.
The last time management mentioned the dividend was in the 4th quarter earnings call last year:
We’re also focusing on a dividend payout ratio. As you see at the guidance, we’re starting to break under 100%. And that’s trending again and also in the right direction. And we’d like to see that get some room under that 100% as we look and think about capital in the future. But there’s no doubt that our flexibility as we move forward and these metrics get in line continues to broaden and be a little bit more flexible. And we’ll look at that as the year and going into ’23 progress.
What this means is that first they’ll let the payout ratios become more manageable, and then move to increase the dividend again.
Throughout the pandemic, management thought tooth and nail to keep the dividend on, and this is now paying off.
If we turn to the 5-year MAD Chart, we’ll get a more precise idea of the yield ranges for OKE.
OKE 5 Year MAD Chart (Dividend Freedom Tribe)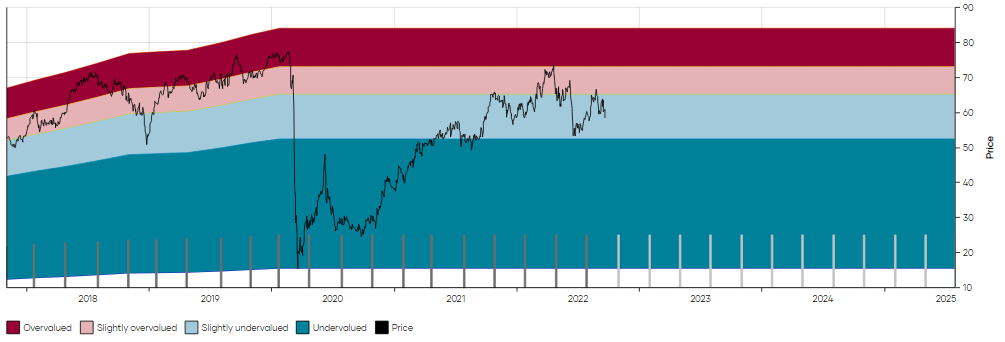
This chart is nice, because it gives us a clear idea of pre-pandemic ranges and post-pandemic ranges.
The stock currently yields 6.5%.
Pre-pandemic, OKE’s yield ranged between 4.5% and 5.7%.
After the initial pandemic drama, OKE’s yield has stabilized between 5.7% and 7%.
This tells me, that within two years, with a modest dividend increase at the end of that period, OKE’s price could very well return to $75, as that would be supported by historical valuations, and make sense, given the steady cash flows the business is capable of delivering.
And in the meantime, a 6.5% yield, when reinvested, compounds very nicely.
Below, I show a $10K investment, with dividends reinvested annually and no dividend growth.
OKE Dividend Simulation (Dividend Freedom Tribe)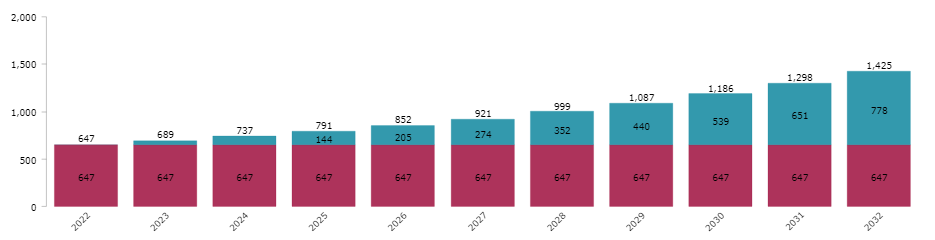
By year 10, you could expect $1,425 in annual income, or 14.25% of your original investment.
Management has this catchy slide that they present in every single one of their earnings presentations.
It goes from showing how within the S&P 500, if you only keep investment grade credit rating stocks, with a market cap above $270bn, with a high ESG rating, 5% consensus EPS growth and a high yield and 25 year+ history of dividends, then there is only one stock: OKE.
Q2 Earnings Call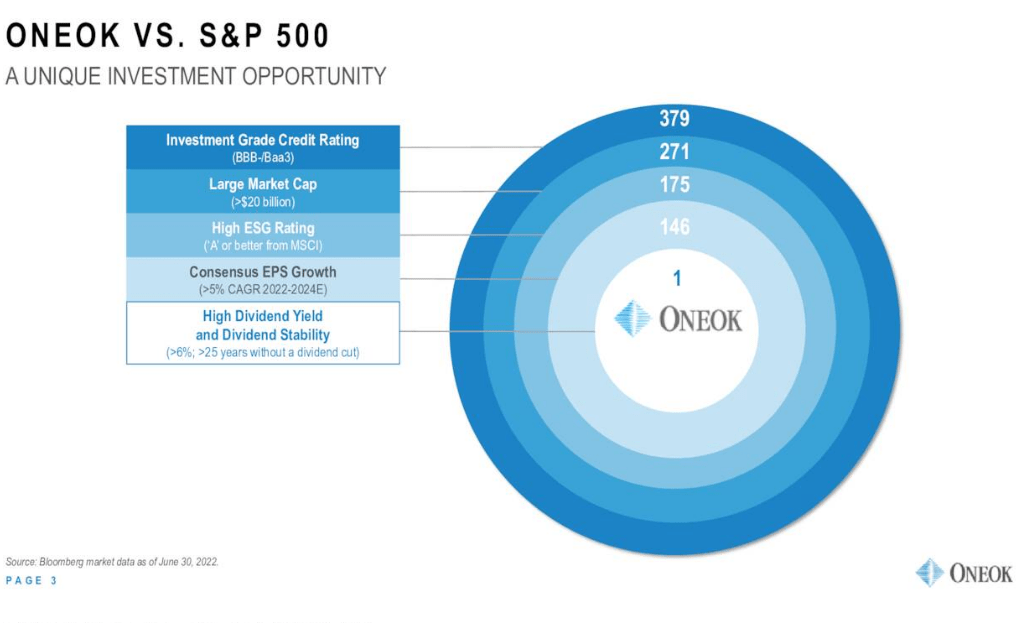
It’s gimmicky, but it does make a strong case for OKE.
Given that the possibility of a recession will likely do very little to change anything about OKE’s outlook, and that the current dividend provides great income regardless of any growth, I think it is a brilliant buy.
One Strong Sell: Iron Mountain
Sometimes you buy them, sometimes you sell them.
Iron Mountain Incorporated (IRM) was a stock which we once categorized as a “slam dunk.”
If you dunk a crazy two-hand reverse windmill, you might choose to hang on to the ring for a while for effect. After a while, you’ll want to let go of the ring, else you’ll just look weird.
It’s time for us to part ways with IRM.
Iron Mountain was part of our Hybrid All Weather dividend portfolio, which is beating the S&P 500 by 30% since inception in May 2020.
Hybrid All Weather vs S&P 500. (Dividend Freedom Tribe)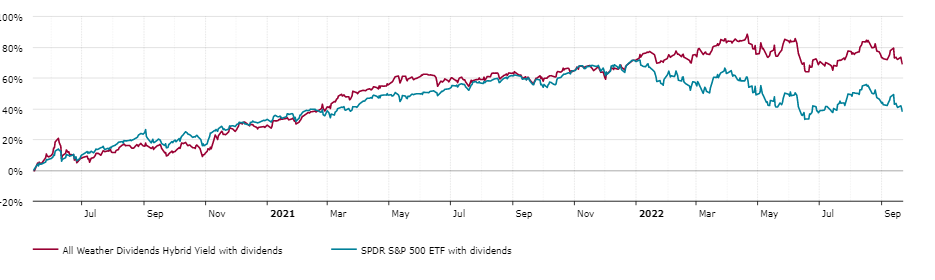
Below is an extract of the transactions on IRM, which synchronize with our recommendations of the stock here on Seeking Alpha.
| Date | Number of Shares | Price | Type | Total | Total Shares After Tx |
| 04/04/22 | 32 | $55.83 | SELL | $1,786.56 | 31 |
| 03/02/22 | 32 | $50.48 | SELL | $1,615.36 | 63 |
| 01/05/22 | 47 | $48.50 | SELL | $2,279.50 | 95 |
| 08/31/20 | 66 | $30.09 | BUY | -$1,985.94 | 142 |
| 06/30/20 | 76 | $26.10 | BUY | -$1,983.60 | 76 |
Let’s assume we sell the remaining shares at $50 this month, exiting the position entirely.
That’s an 82% return over two years, plus another 12% from dividends. That’s 94% in two years or more or less 39% annualized returns.
It’s been a successful trade, but we’re now happy to exit IRM entirely. Why?
Yes, the balance sheet is well positioned. Most of its debt is fixed rate with an average 6.6 years maturity. It has lots of liquidity, and its revenue and earnings are growing rapidly on the back of its digital center expansion.
Q2 Earnings call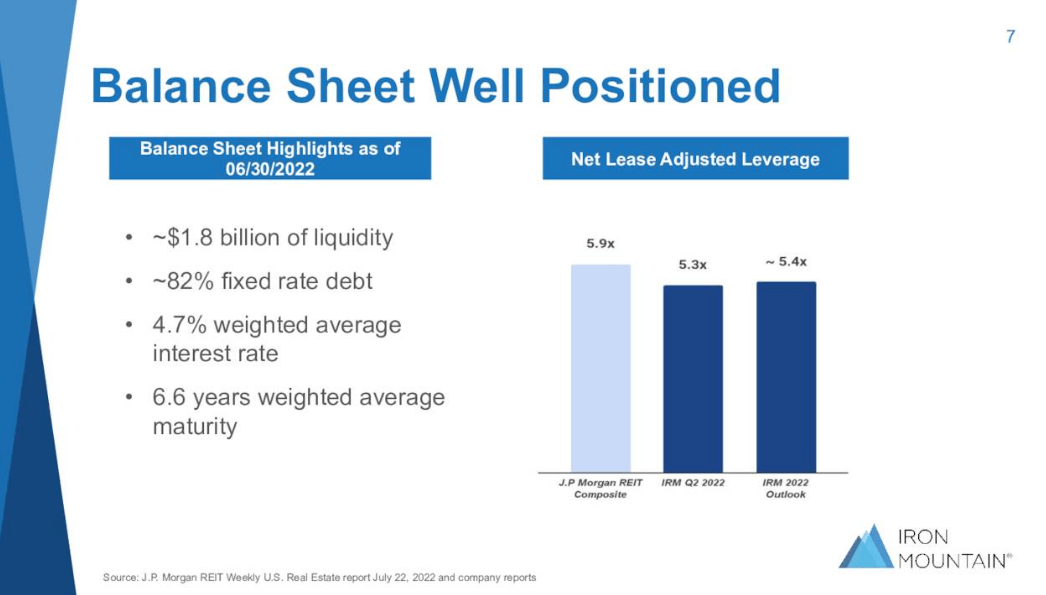
But the valuation has reached the higher point it has been in the past 8 years, relative to its dividend.
IRM MAD Chart (Dividend Freedom Tribe)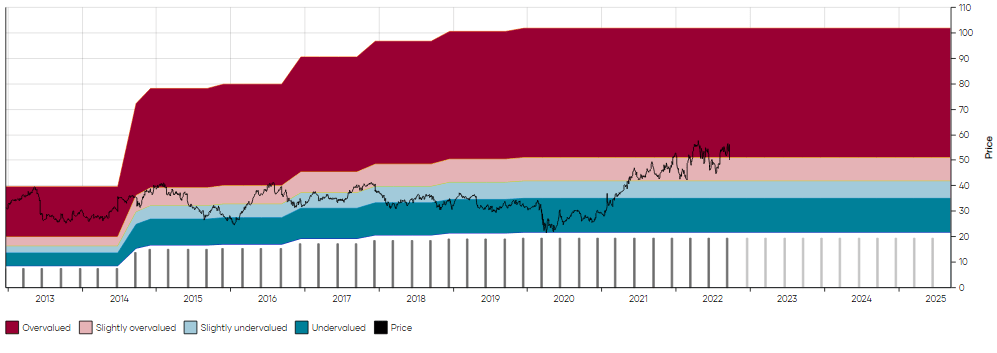
The stock now yields just 4.5%. This requires about 3.5% dividend growth to be as satisfactory in terms of income as AMGN over the next 10 years.
But Dividend growth has stalled for a couple of years, and we’re not quite close to seeing another increase. The CEO said at the Stifel 2022 Cross Sector Conference:
Thanks, Shlomo. We have a fairly long-standing plan as it relates to the dividend and our target payout ratio. So the way we think about it is we have a target payout ratio of AFFO of low to mid-60s. And if you go back just a couple of years ago, we were in the kind of higher 80s on that metric. And then last year, we got into the 70s. And if you work through our guidance, it would be kind of at the mid to upper 60s this year at year-end. At the end of the first quarter, on a trailing basis, we’re 69% as a payout ratio.
So mechanically, if you just kind of work through the math and AFFO is growing, just to hold that target ratio once we get into it, you kind of have to grow the dividend generally in line with the growth in AFFO. I think that’s the way folks ought to be thinking about it going forward in light of our long-standing policy.
When they revealed Q2 earnings, they announced that:
On a trailing four-quarter basis, our payout ratio is now 68%, approaching our long-term target range of low to mid-60s.
Then let’s look at the 2022 guidance for more color.
Q2 Earnings Call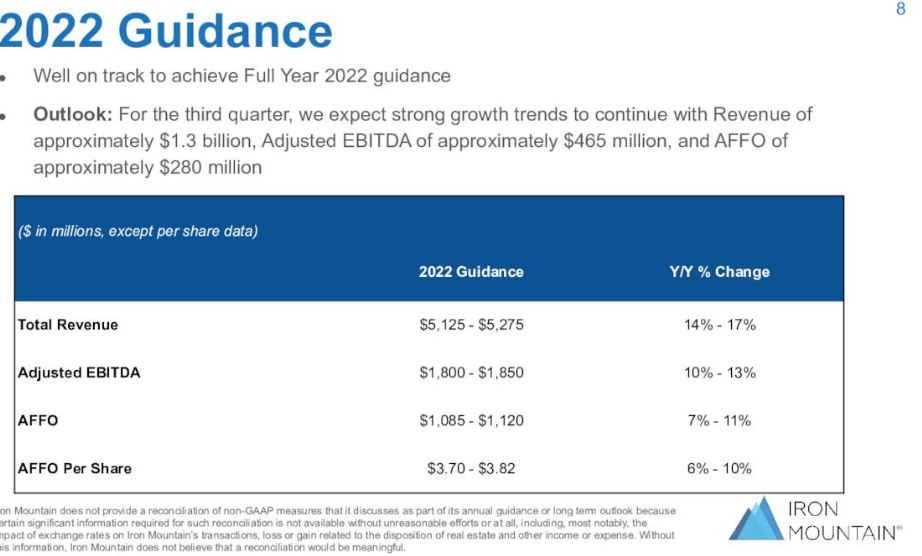
So if we use the top-of-the-range guidance, they would reach 65% payout ratio by the end of the year, and by the end of next year be in a position to increase the dividend.
IRM historically increased the dividend in the first quarter of the year.
If they are overly optimistic they might increase it in Q1 of 2023, but I see it as much more likely that they increase it by Q2 of 2024, thus giving themselves a margin within their 60% to 65% AFFO payout target.
While you wait for this to play out, IRM’s stock has little upside. If the entire REIT sector gets hit, it will come down with it.
The common sense thing to do is to sell stocks when they’re high, and rotate into cheaper names, especially in the current environment.
IRM is a brilliant business, a one-of-a-kind REIT, which we’ll actively track for good entry points and reconsider our stance if the dividend is getting closer to getting raised.
In the meantime, let’s take our profits and run.
Conclusion
Taking profits is healthy.
The “time in the market vs timing the market crowd” always gets upset when we suggest they sell their stocks.
First thing: don’t get attached, it’s some letters and a number on a screen, not an NBA franchise.
Second thing: time in the market doesn’t change if you sell and rotate to another name.
Third thing: Doing so allows you to shift to value, which protects your downside.
Fourth thing: Doing so gives you the opportunity to increase your dividend income. If you buy a 4% yielding stock, sell it when it yields 2% and buy another 4% yielding stock, before taxes you’ve doubled your income.
I wish you all successful investing in these challenging times. While there is a lot to be worried about right now, capitalism has always prevailed. I’d be surprised if it didn’t work out this time.
Be the first to comment