

U.S. DOLLAR ANALYSIS
- Markit – ACT: 58.3; EST: 59.1.
- ISM – ACT:61.1;EST: 60.0.
NOVEMBER U.S. MANUFACTURING PMI’S
Prior to today’s release, PMI’s (a print above 50 is considered expansionary and vice versa) have been incrementally rising presenting a healing U.S. economy. The Markit November issue came in marginally lower than estimates (see calendar below), ISM then came in roughly in line with forecasts. The dollar dismissed data as markets look ahead to unemployment figures on Friday.
U.S. MANUFACTURING PMI (NOV):
Source: DailyFX economic calendar
DOLLAR FUNDAMENTAL BACKDROP
ROLLERCOASTER WEEK FOR THE U.S. DOLLAR
The U.S. Dollar Index (DXY) whipsawed yesterday during Fed Chair Powell’s ‘hawkish’ testimony where he mentioned the Fed’s willingness to discuss inflationary pressures and the possibility of speeding up asset purchases. Completing the tapering process sooner than expected is extremely bullish for the greenback and markets have already revised their first rate hike to July 2022 – a full month earlier than yesterday viewpoint.
FED INTEREST RATE PROBABILITIES:
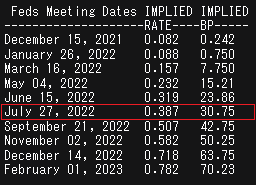
Source: Refinitiv
The WHO earlier today eased Omicron fears by stating that no sever cases have been reported thus far with infectants showing mostly mild symptoms. This alleviates risk-off sentiment currently weighing the dollar down as investors seek higher yielding currencies after an extended dollar pre-Omicron. This makes it difficult to forecast a directional bias for the dollar at this point however with more data points leading up to the Fed meeting later this month, markets should have more clarity.
FOCUS SHIFTS TO NFP’S ON FRIDAY
Markets now turn to Friday’s Non-Farm Payroll (NFP) data estimated at 550K which would result in the fourth consecutive monthly increase. The print would add significant tightening pressure to current situation and possibly push back rate hike expectations to June 2022.
USD ECONOMIC CALENDAR:
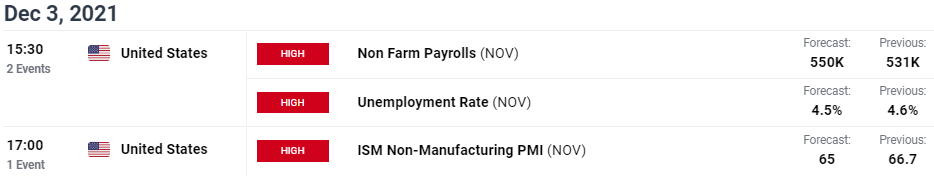
Source: DailyFX economic calendar
TECHNICAL ANALYSIS
U.S. DOLLAR INDEX DAILY CHART
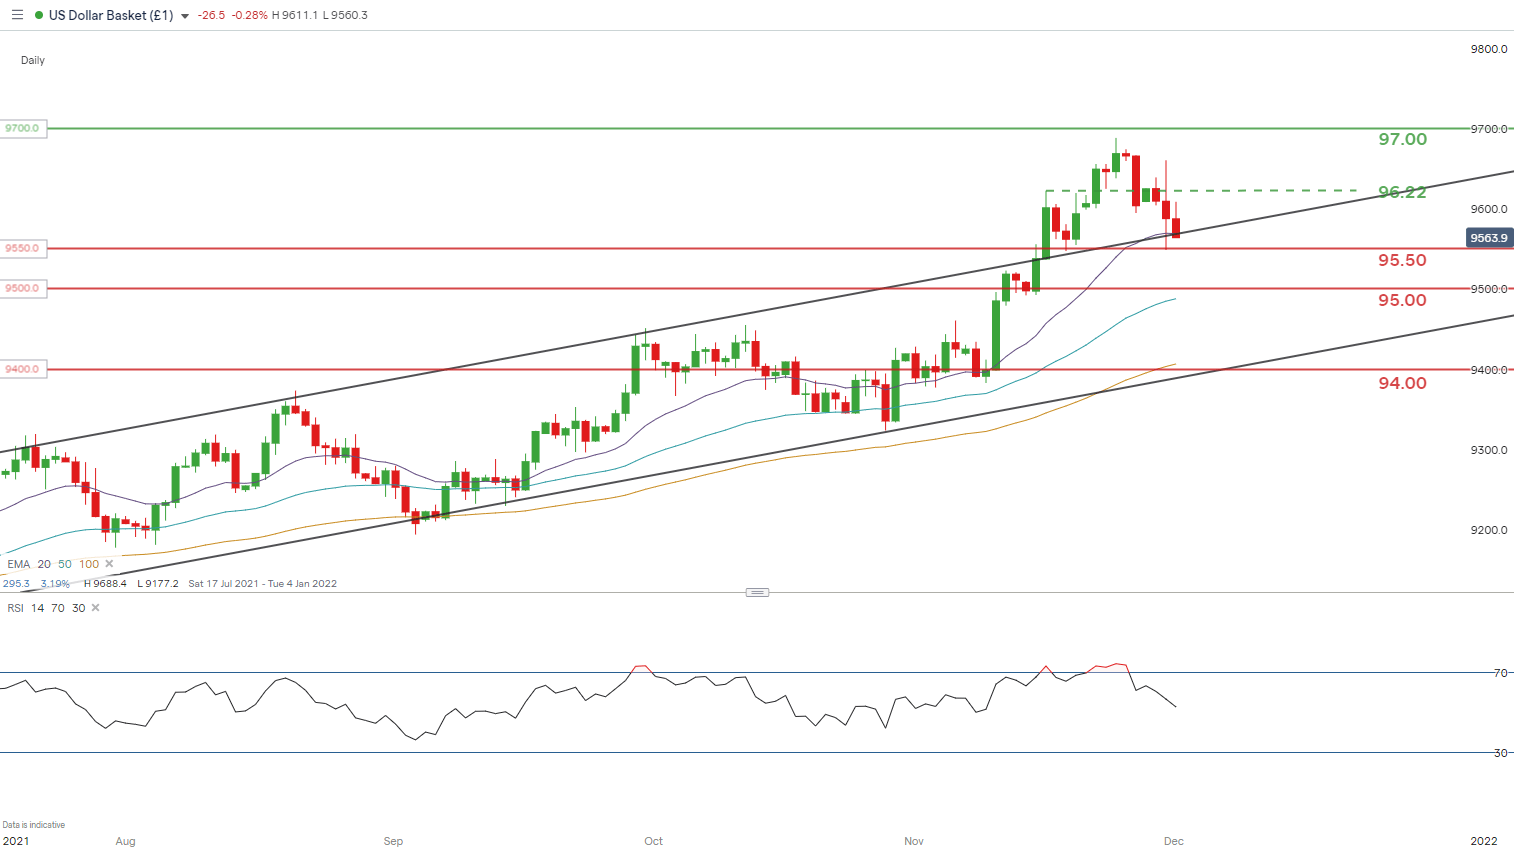
Chart prepared by Warren Venketas, IG
Resistance levels:
- 97.00
- 96.22
- Channel resistance/20-day EMA (purple)
Support levels:
Contact and follow Warren on Twitter: @WVenketas
Be the first to comment