

Japanese Yen Talking Points
USD/JPY has reversed course after taking out the July low (109.06) amid a recovery in longer-dated US Treasury yields, but fresh data prints coming out of the US may rattle the recent advance in the exchange rate as inflation is expected to slow for the first time in 2021.
USD/JPY Outlook: Dollar Rally to Face Slowing US Inflation
USD/JPY trades back above the 50-Day SMA (110.13) as it climbs to a fresh monthly high (110.60), and the exchange rate may stage a larger recovery ahead of the Kansas City Fed Economic Symposium scheduled for August 26 – 28 as a growing number of Federal Reserve officials show a greater willingness to switch gears.
However, the updated CPI figures may rattle the recent rally in USD/JPY as the headline reading is expected to narrow to 5.3% from 5.4% in June, with the core rate of inflation anticipated to reflect a similar dynamic as the figure is projected to print at 4.3% in July versus 4.5% the month prior.
In turn, signs of transitory inflation may drag on US yields as it raises the Federal Open Market Committee’s (FOMC) scope to retain the current course for monetary policy, but a stronger-than-expected CPI may spark a further advance in the exchange rate, which could fuel the recent shift in retail sentiment like the behavior seen earlier this year.
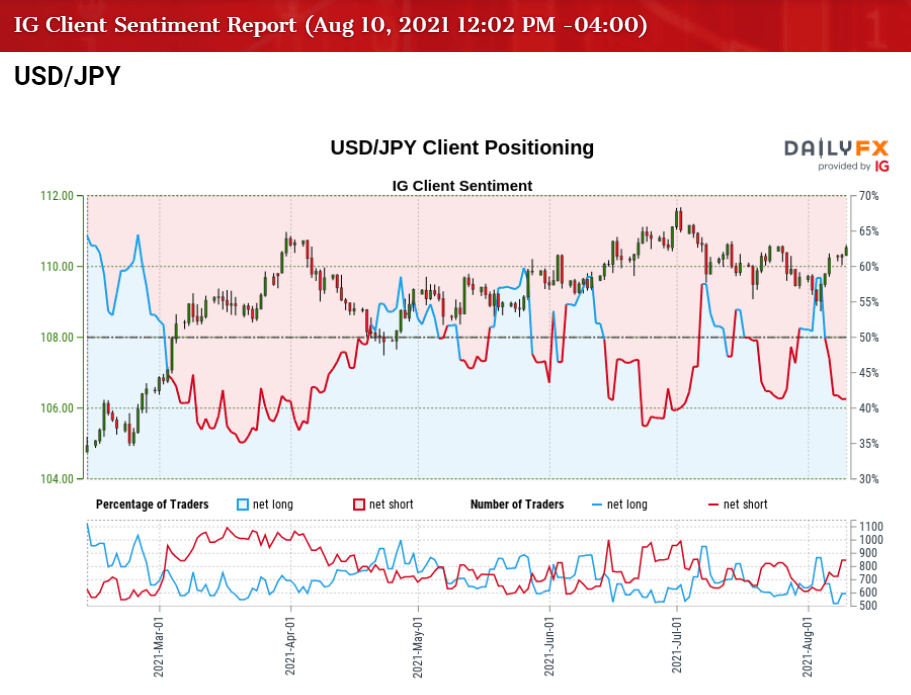
The IG Client Sentiment report shows 43.09% of traders are currently net-long USD/JPY, with the ratio of traders short to long standing at 1.32 to 1.
The number of traders net-long is 18.12% higher than yesterday and 19.41% lower from last week, while the number of traders net-short is 1.29% higher than yesterday and 35.80% higher from last week. The decline in net-long position could be a function of profit-taking behavior as USD/JPY trades to a fresh monthly high (110.60), while the jump in net-short interest has fueled the shift in retail sentiment as 50.75% of traders were net-long the pair last week.
With that said, a further advance in USD/JPY may fuel the shift in retail sentiment like the behavior seen earlier this year, but the update to the US CPI may rattle the recent rally in the exchange rate as inflation is expected to slow for the first time in 2021.
USD/JPY Rate Daily Chart
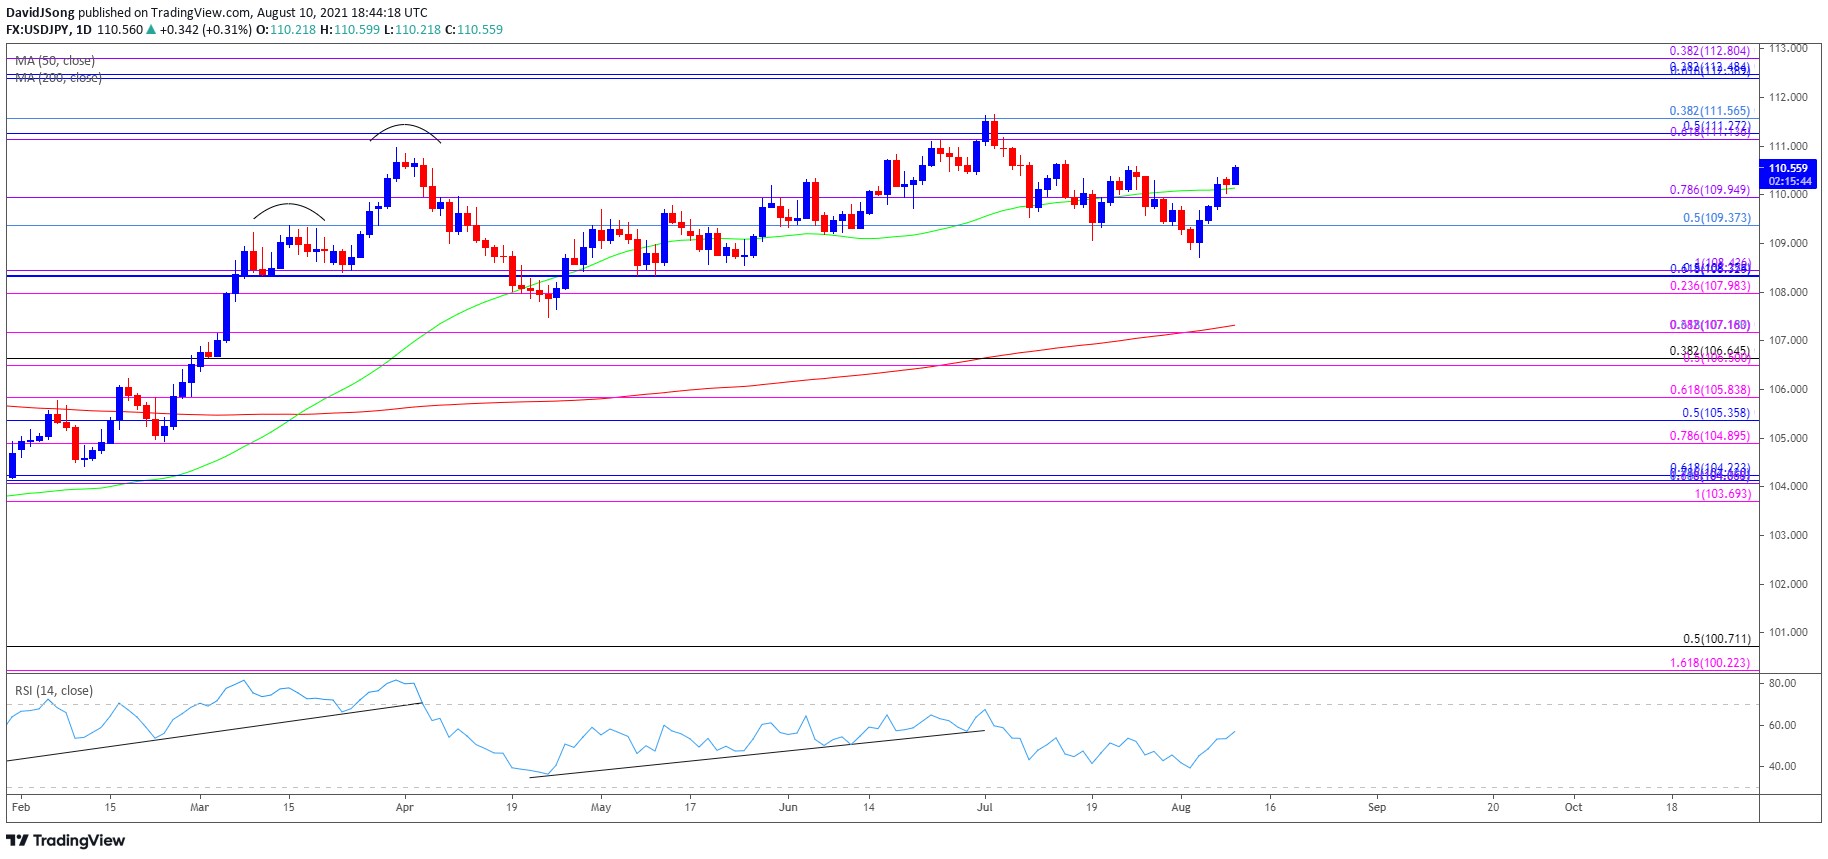
Source: Trading View
- USD/JPY approached pre-pandemic levels as a ‘golden cross’ materialized in March, with a bull flag formation unfolding during the same period as the exchange rate traded to a fresh yearly high (110.97).
- The Relative Strength Index (RSI) showed a similar dynamic as the indicator climbed above 70 for the first time since February 2020, but the pullback from overbought territory has undermined the upward trend from this year, which briefly pushed USD/JPY below the 50-Day SMA (110.13) for the first time since January.
- Nevertheless, USD/JPY reversed ahead of the March low (106.37) to largely negate the threat of a head-and shoulders formation, with the exchange rate climbing back above the moving average to trade to a fresh yearly high (111.12) in June.
- A similar scenario took shape in July as USD/JPY traded to a fresh yearly high (111.66), but lack of momentum to hold above the 109.40 (50% retracement) to 110.00 (78.6% expansion) region ultimatelyled to a break of the July low (109.06).
- Since then, USD/JPY has reversed course amid the failed attempt to test the Fibonacci overlap around 108.00 (23.6% expansion) to 108.40 (100% expansion), with the exchange rate climbing back above the 109.40 (50% retracement) to 110.00 (78.6% expansion) region as it trades to a fresh monthly high (110.60).
- Need a break/close above the overlap around 111.10 (61.8% expansion) to 111.60 (38.2% retracement) to open up the 112.40 (61.8% expansion) 112.80 (38.2% expansion) region.
— Written by David Song, Currency Strategist
Follow me on Twitter at @DavidJSong
Be the first to comment